S&P 500 (SPX) Has Risen in 10 of 10 Midterm Sep 23-Jul 12 Windows, Averaging 19.27% Gains
The S&P 500 is wrapping up a strong midterm election year and approaches a 293-day window starting Sep 23 that has never been negative in the last 10 midterm cycles, even as earnings strength and options-driven volatility shape the backdrop.

What is the seasonal pattern for S&P 500 (SPX)?
S&P 500 has risen in 10 of 10 midterm-year windows starting around Sep 23, with an average gain of 19.27% in winning years.
- 10 for 10 in this window, averaging 19.27% gains in winning years across the last 10 midterm election cycles.
- Seasonal window runs roughly Sep 23 through Jul 12, spanning 293 days as the calendar shifts from the midterm election year into the year before the presidential election.
- Percent Profitable is 100%, with 10 winners and 0 losers in the historical sample.
- Median profit of 20.75% and cumulative compounded return of 466% highlight how powerful this SPX seasonal trend has been.
- TradeWave Ratio of 1.85 and Sharpe ratio of 1.75 point to strong upside travel in the trade direction with solid risk-adjusted returns.
- Intraperiod drawdowns have still appeared in some years, with adverse moves reaching double digits even in windows that finished higher.
According to historical data from TradeWave.ai, this late-midterm stretch into the year before the presidential election has behaved very differently from an average year on the calendar. The next section walks through what that pattern has looked like for S&P 500 and how it frames the coming 293 days.
How has S&P 500 (SPX) traded in the Sep 23 to Jul 12 midterm window?
S&P 500 has finished higher in every one of the last 10 midterm-year windows that begin around Sep 23 and run roughly through mid-July, averaging gains of 19.27% with a median return of 20.75%. The upcoming 293-day stretch opens on Sep 23, 2026, with the index sitting near record territory after a powerful earnings-driven run and less than 2% from its 52-week high, leaving little obvious valuation cushion as the next seasonal regime approaches.[1] This window also overlaps the long midterm-to-pre-election “100-Year Pattern” regime that has historically delivered unusually steady upside for SPX across decades, making its track record hard for macro traders to ignore.
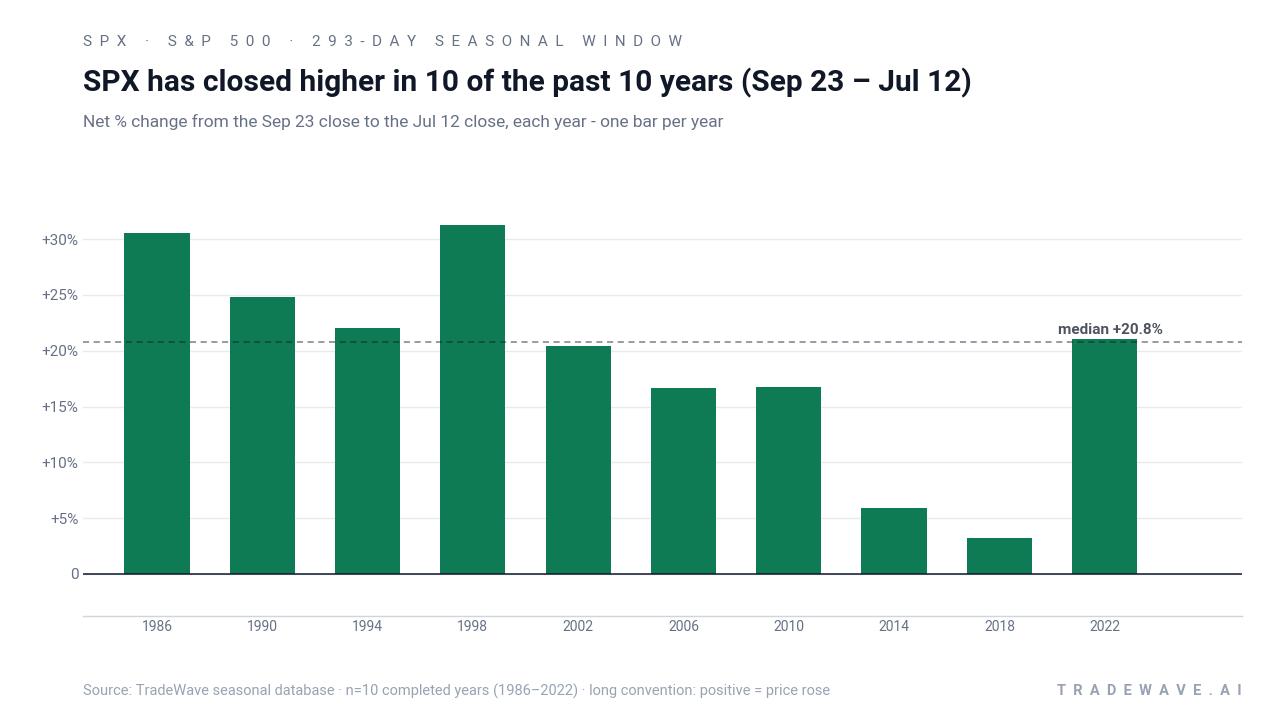
Grouping the data by the presidential election cycle matters here because this 293-day slice always starts in the late part of a midterm election year and runs deep into the year before the presidential election, a phase that has often coincided with friendlier policy signals, improving earnings breadth and a more risk-on stance from institutional allocators.[1] In this sample, the trade direction is long, and every completed window from 1986 through 2022 finished with a positive net return, from a modest 3.23% gain in 2018 to a 31.24% surge in 1998.
The average profit of 19.27% across all 10 years sits close to the 20.75% median, which suggests the SPX seasonal trend in this window has been driven by a cluster of solid double-digit advances rather than a single outlier year. The annualized return of 18.94% and Sharpe ratio of 1.75 indicate that, on a risk-adjusted basis, this has been one of the smoother long regimes in the midterm election year playbook. Add it up and stacking this window back-to-back across the last 10 midterm cycles would have compounded to a 466% cumulative gain.
Intraperiod behavior has not been a straight line. Maximum favorable excursions, or the best point-to-peak moves within each window, have often run slightly ahead of the final net gains, which means SPX has tended to overshoot to the upside at some point before settling back by the end of the period. At the same time, maximum adverse excursions, the worst drawdowns from the entry, have ranged from almost flat in 2006 to nearly 20% in 2018, showing that even a “10 for 10” window can include gut-check pullbacks along the way.
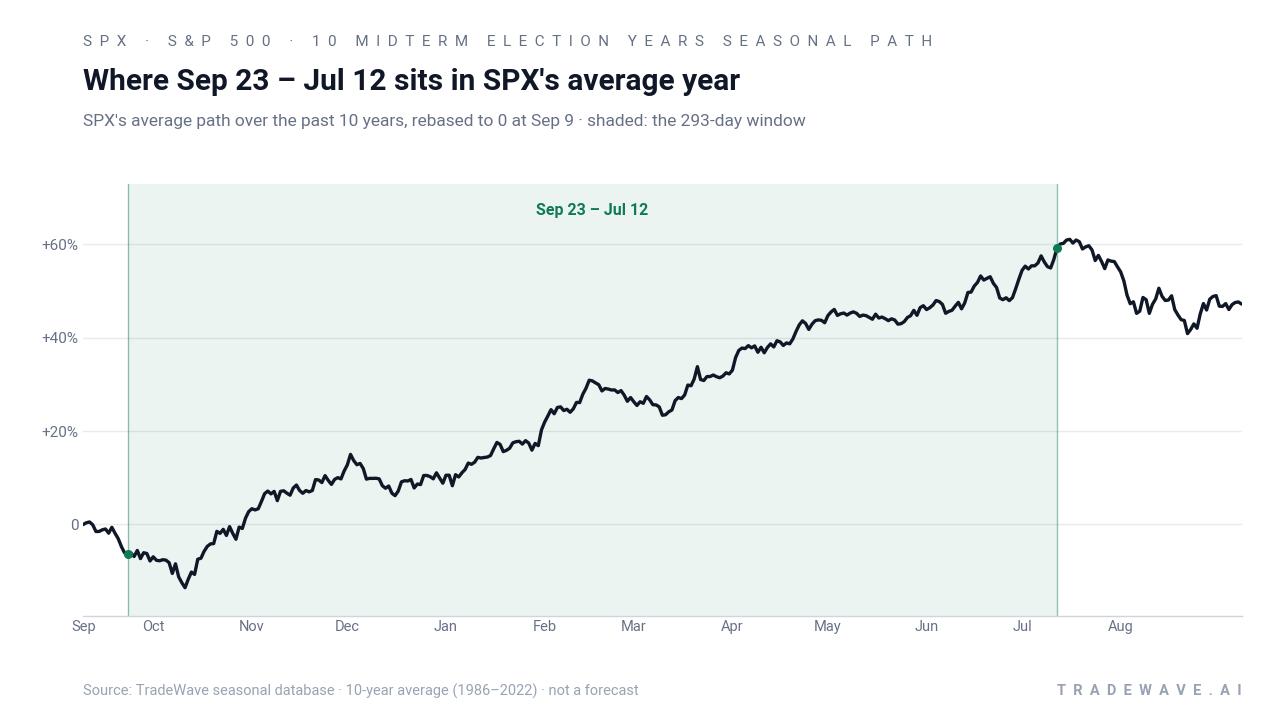
The trend view of the average year in this window shows a pattern that starts firm, accelerates through the turn of the calendar into the year before the presidential election, and then grinds higher into early summer. That shape lines up with the broader “100-Year Pattern” narrative in which midterm-year volatility in the first half of the year gives way to a more persistent climb once late September arrives and policy uncertainty begins to clear.
Yearly net and intraperiod swings show how upside and drawdowns have coexisted inside this midterm-to-pre-election window.
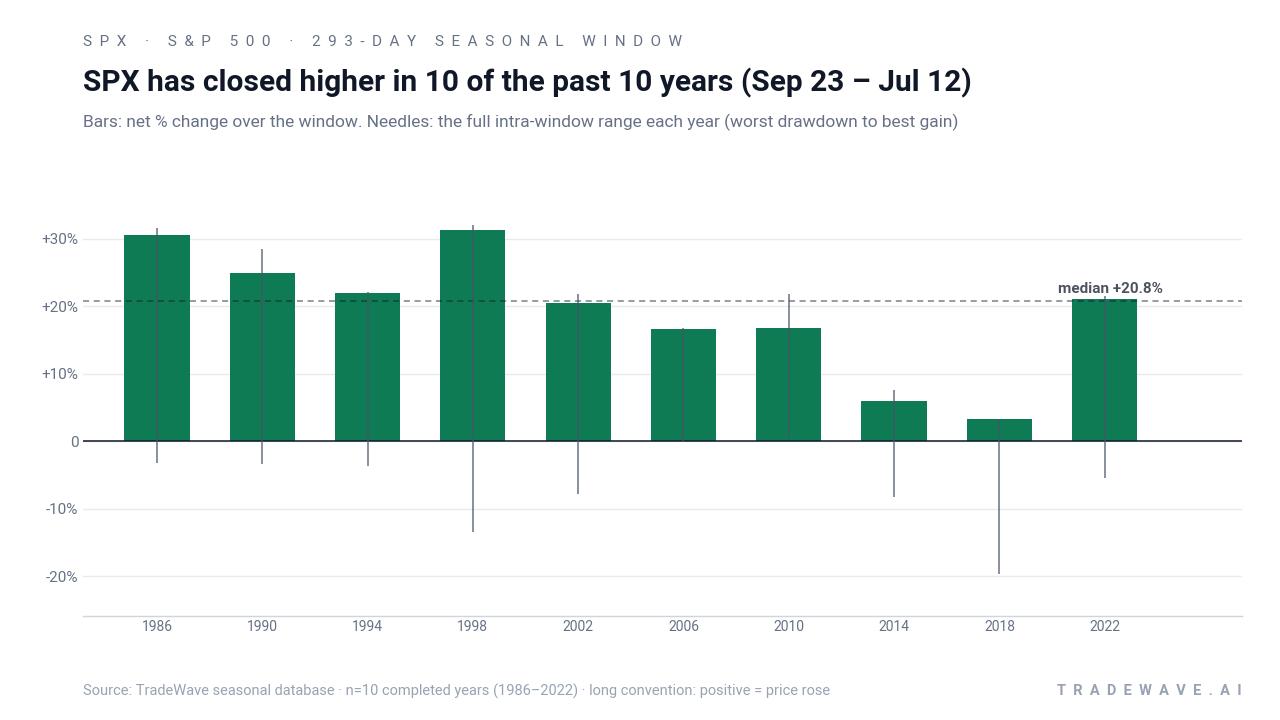
The per-year profile underlines that this is a high-conviction long pattern rather than a coin flip. Nine of the 10 windows delivered double-digit gains, and even the softest outcome in 2018 still finished positive despite a nearly 20% intraperiod drawdown. The pattern is clear: this window has favored longs in 10 of 10 years, with average gains near 20% and enough volatility inside the range to matter for risk management.
Why does S&P 500 (SPX) follow this seasonal pattern?
One likely driver is the way the policy and earnings calendar lines up in the late midterm election year and the year before the presidential election. Analysts have pointed to a mix of fading policy uncertainty, improving corporate earnings growth and year-end to midyear portfolio rebalancing as reasons risk assets often get more support in this phase.[1] The pattern may also reflect sector rotation into growth and cyclicals as investors position for easier monetary policy and stronger profit trends after the midterm vote.
History does not guarantee future results; adverse excursions can be large even in winning windows, and past seasonal strength does not ensure similar outcomes in future cycles.
What is driving S&P 500 (SPX) today?
S&P 500 is trading near record or near-record highs as the midterm election year winds down, powered by a surge in index-level earnings and expectations that profit growth will stay elevated into 2026.[1] In August, Bloomberg highlighted what it called “outlier” earnings strength, with FactSet data showing Q2 results running far ahead of typical cycles and helping justify richer valuations for the benchmark.[1] At the same time, Wall Street strategists have tied their higher year-end targets to a mix of strong earnings and anticipated Federal Reserve rate cuts, arguing that easier policy could keep the equity risk premium compressed even at these levels.[2]
Options activity has become a central part of the story. In early August, CNBC reported a record-breaking week for options trading that coincided with a sharp SPX surge, underscoring how derivatives flows can amplify intraday and multi-day moves when the index is already leaning higher.[3] That backdrop matters for the upcoming seasonal window because heavy use of short-dated options can both accelerate rallies in historically strong periods and deepen pullbacks when positioning flips.
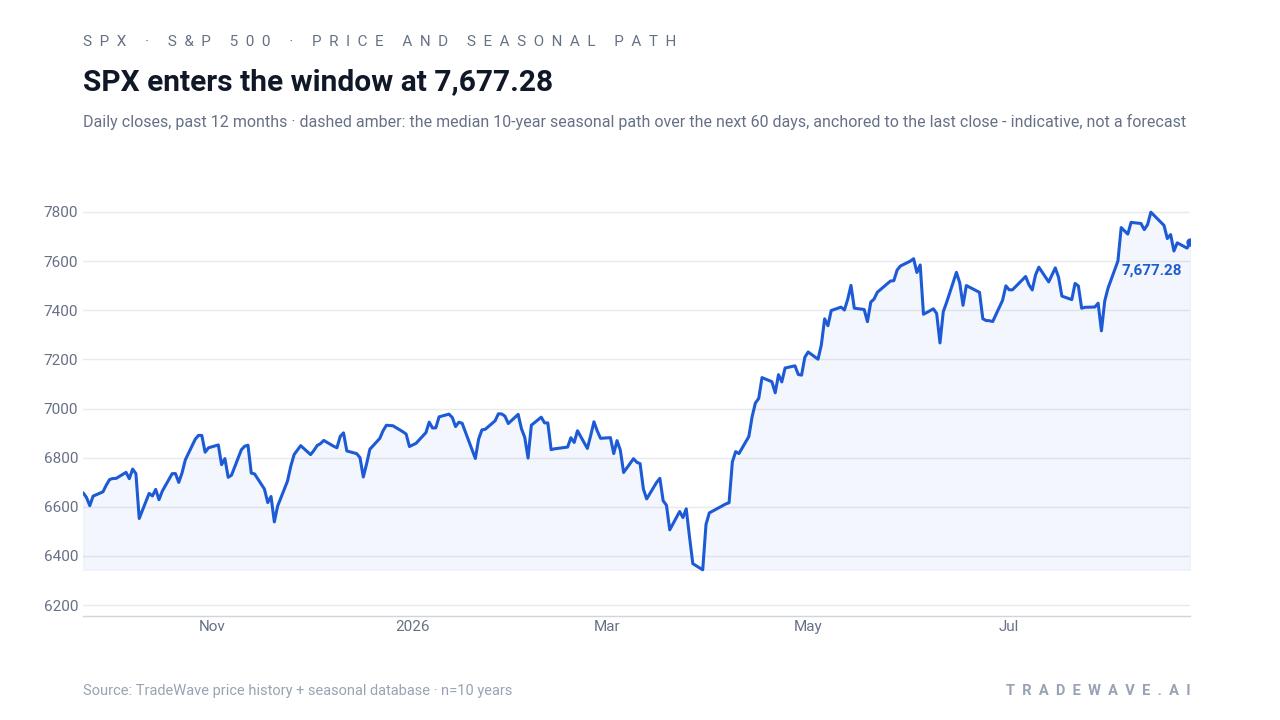
The chart below situates the latest move in its recent multi-month context, alongside a 60-day seasonal projection based on prior midterm cycles.
What should traders watch as the Sep 23 window approaches?
The first marker is the calendar itself. The 293-day window opens on Sep 23, just as the market transitions from a concluding midterm election year into the historically strong year before the presidential election, a phase that has often seen policy risk fade and earnings expectations firm.[1] Traders will be watching whether SPX can hold near its recent highs into that date or whether profit-taking and macro headlines force a reset before the seasonal tailwind typically kicks in.
Second, earnings momentum will be critical. Recent quarters have delivered unusually strong growth, and LSEG and FactSet forecasts point to mid-teens to double-digit earnings expansion into 2026, which has been a key pillar for bullish SPX targets.[1] If that earnings cadence slows or guidance softens, the historical midterm-to-pre-election pattern could face a tougher test than in prior cycles.
Third, policy expectations around the Federal Reserve and fiscal stance will shape how much room the index has to run. Strategists have tied part of the 2026 rally to anticipated rate cuts and a supportive liquidity backdrop, and any shift in that narrative could change how investors lean into or fade the seasonal edge.[2] Geopolitical risks and oil prices also sit in the background as potential volatility triggers that could interact with the window’s history of meaningful intraperiod drawdowns.
Finally, options and positioning deserve close attention. The record options volumes seen in August showed how quickly flows can push SPX through key levels when dealers and systematic strategies are forced to adjust.[3] If similar options-driven surges or air pockets appear as the Sep 23 window opens, they will either reinforce the historical pattern of strong upside travel or mark an early stress test of a seasonal record that, so far, has been flawless.
Sources
About this seasonal analysis
Seasonal pattern data is sourced from TradeWave.ai, which analyzes historical price behavior across annual calendar windows going back up to 30 years. Read the full data methodology or the book The 100-Year Pattern by Afshin Moshrefi (2026 edition). Past performance of seasonal patterns does not guarantee future results. This article is for informational purposes only and does not constitute investment advice.