This 202-Day Midterm Window Has Delivered 140% Cumulative Upside for Amphenol (APH)
Amphenol is approaching a 202-day midterm-year seasonal window that has never been negative in the data, just as the stock trades far below its 52-week high after a split and strong earnings.
Price as of Sep 4, 2026: $82.78 (last close).

What is the seasonal pattern for Amphenol (APH)?
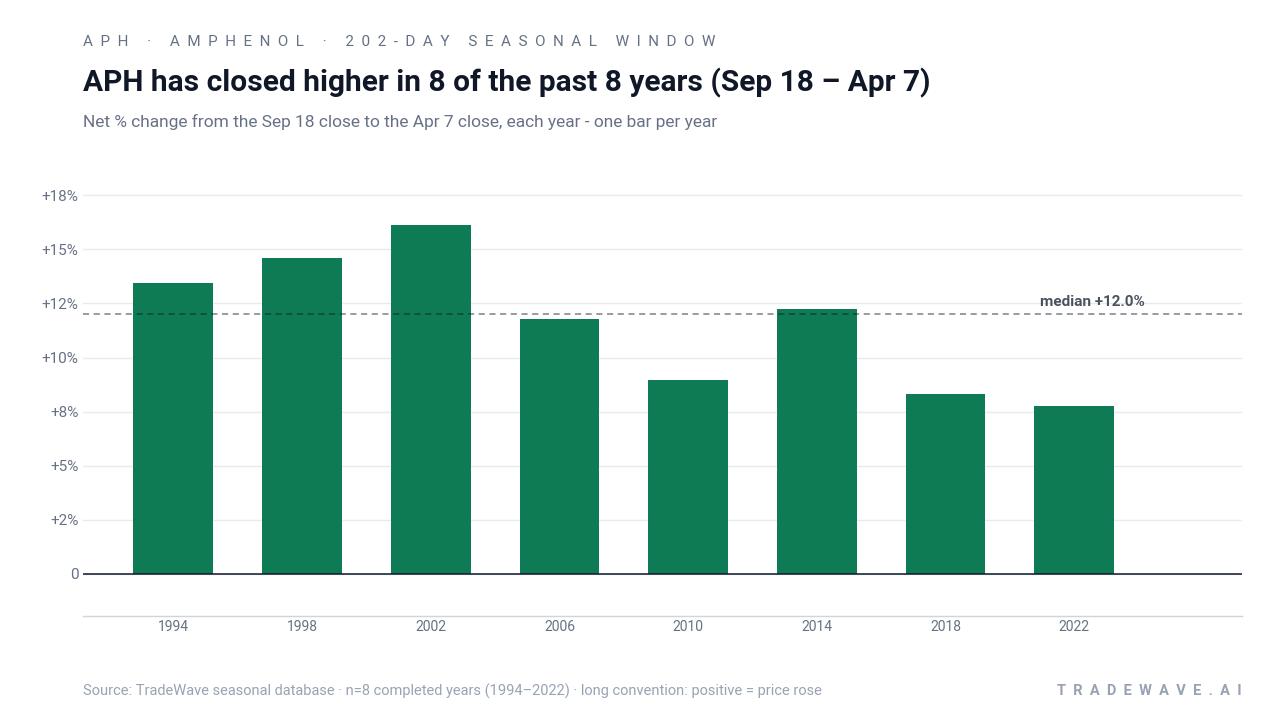
Amphenol has risen in 8 of 8 midterm-election-year windows starting Sep 18 and lasting 202 days, with an average gain of 11.66% in winning years.
- 8 for 8 in this window, with Amphenol averaging 11.66% gains across all winning years.
- The upcoming 202-day trading window runs from Sep 18 to Apr 7 and is grouped across the last 8 midterm election years.
- Percent Profitable is 100%, with 8 winners and 0 losers in the historical sample.
- Average gains in individual years range from about 7.8% to 16.1%, while the compounded return across cycles totals roughly 140%.
- Intraperiod swings have been meaningful, with some years showing double-digit drawdowns before finishing higher.
- The pattern aligns with a late midterm election year transitioning into the year before the presidential election, a phase that has often favored growth and technology hardware names.
According to historical data from TradeWave.ai, this midterm-year stretch for Amphenol has behaved very differently from an average calendar period, with a clear directional bias that shows up repeatedly across cycles.
How strong is the upcoming Sep 18 seasonal window for Amphenol (APH)?
Amphenol has risen in 8 of the last 8 midterm election years during the 202-day window that runs from Sep 18 to Apr 7, averaging 11.66% gains with a long bias. Shares finished the prior session at 82.78, up 16.7% year to date but still about 53.6% below their 52-week high of 178.52 after the recent 2-for-1 split. That combination of a clean seasonal track record and a stock that has already reset lower on the chart gives this upcoming window unusual weight for traders trying to time entries and adds a distinct layer to the APH seasonal trend story.
The election-cycle framing matters here. The pattern aggregates Amphenol’s behavior across the last 8 midterm election years, a phase that often features policy uncertainty early in the year but historically transitions into a more supportive backdrop for risk assets as markets look ahead to the year before the presidential election, when fiscal and regulatory visibility tend to improve.
In this specific window, the trade direction is long, and every completed midterm-year sample has finished positive. Percent Profitable sits at 100%, with 8 winners and 0 losers, and the average gain across those years is 11.66%. Median profit is 12.01%, which tells you the typical outcome has been close to the average rather than skewed by a single outlier year.
Individual years show a fairly tight band of outcomes for a 202-day stretch. The strongest midterm-year window in the sample was 2002, when Amphenol gained 16.11% between Sep 18 and Apr 7, while the softest was 2022, which still delivered a 7.76% net gain over the same dates. Add it up and stacking those eight windows compounds to roughly 140% cumulative return, which is what you would have captured by only being long during this specific slice of the calendar across those cycles.
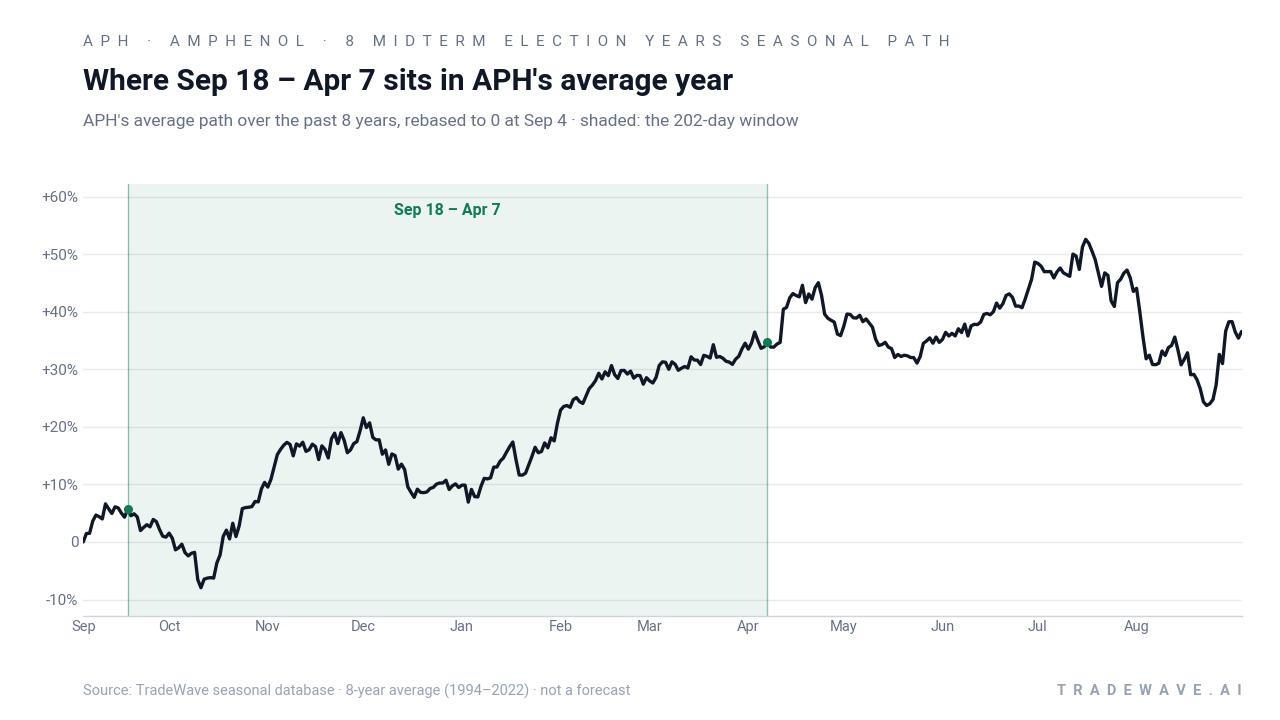
The historical seasonal average path suggests that gains in this window have tended to accrue gradually rather than in a single burst. The shaded 202-day stretch sits in the back half of the average year, with the line grinding higher through the fall and winter before flattening into early spring. That profile fits a story where institutional investors lean into technology hardware and connectors as budgets reset and capital spending plans for data centers and communications gear firm up.
Yearly net and intraperiod swings show how much room Amphenol has historically had to run and how deep drawdowns have gone before those gains locked in.
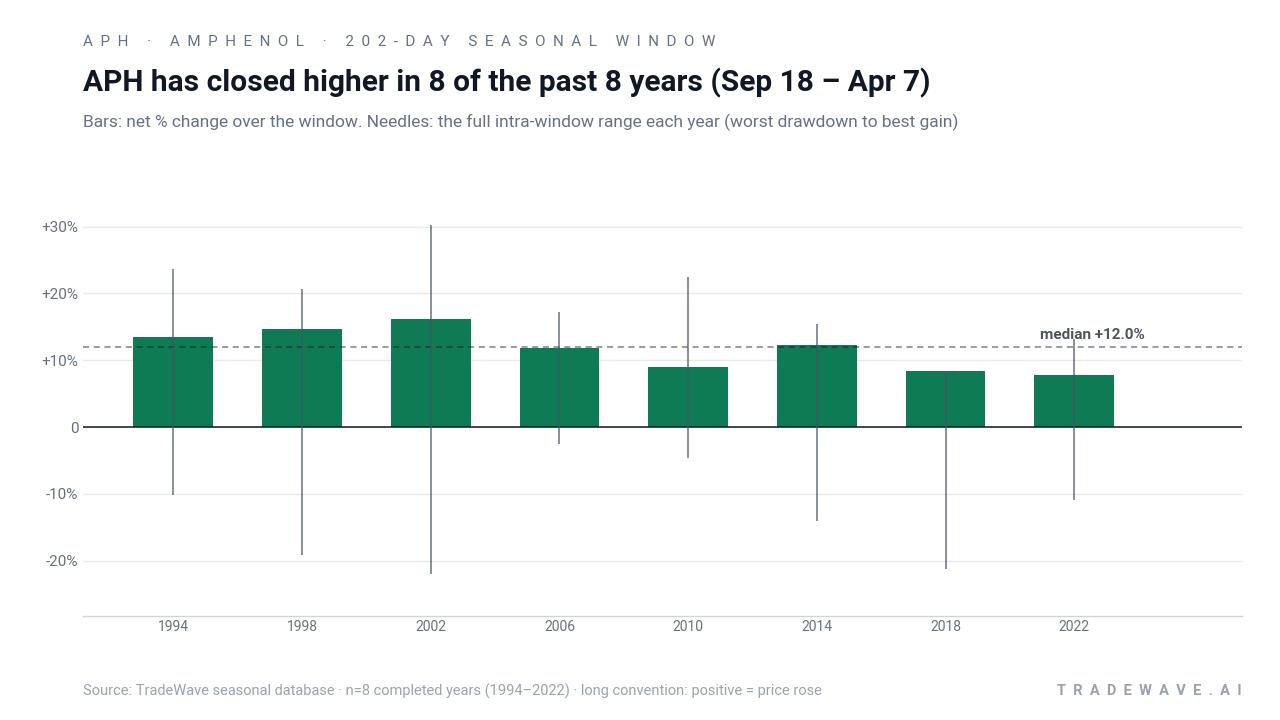
The bar-and-range chart shows that while every year finished higher, the ride was not always smooth. Maximum favorable excursions, the best point-to-peak moves within the window, reached into the low- to mid-20% range in several cycles, with 2002 posting a peak run-up of 30.18%. On the flip side, maximum adverse excursions, the worst drawdowns from the entry, hit double digits in multiple years, including intraperiod drops of roughly 19% in 1998, 21.95% in 2002, and 21.2% in 2018 before the stock recovered into positive territory.
That mix of strong average gains, a 100% win rate, and meaningful intraperiod volatility is captured in the TradeWave Ratio of 2.46, which measures how far price typically travels in the trade direction within the window regardless of the final close. A Sharpe ratio of 3.08 on end-of-window outcomes underscores that, historically, the reward per unit of volatility in this specific stretch has been unusually high for a single-stock seasonal pattern.
History does not guarantee future results; adverse excursions can be large even in winning windows, and traders need to be prepared for double-digit drawdowns inside a pattern that has historically finished higher.
Why does Amphenol (APH) follow this seasonal pattern?
One likely driver is the way Amphenol’s end markets and budget cycles line up with the political calendar. In late midterm election years, large customers in data centers, communications, and industrial electronics often finalize next-year capital spending plans, which can translate into stronger orders and visibility for connector suppliers as the year before the presidential election begins.[2] Analysts have also pointed to sector rotation into high-quality technology hardware during these phases, as investors look for earnings resilience and exposure to themes like AI and IT datacom infrastructure that are less sensitive to shifting policy headlines.[2][4]
What is driving Amphenol (APH) today?
Amphenol closed at 82.78 in the prior session, up 0.9% on the day and 16.7% year to date, but still trading about 53.6% below its 52-week high of 178.52 after a 2-for-1 stock split that became effective on Sep 3, 2026.[2] The stock has been digesting a powerful run that accelerated after blowout Q2 2026 results on Jul 29, when adjusted EPS of $1.35 topped consensus by $0.16 and revenue surged to roughly $8.76 billion, helped by strong AI and IT datacom demand and acquisitions that lifted orders to a record $10.7 billion with a 1.23 book-to-bill ratio.[2][4]
Guidance has kept the growth story intact. For Q3 2026, management projected revenue of $9.3 billion to $9.4 billion, implying about 50% to 52% year-on-year growth, and guided adjusted EPS to $1.40 to $1.42, excluding any additional tariff recoveries.[4] That backdrop, combined with the split, has helped keep analyst sentiment firmly constructive, with MarketBeat’s aggregate showing a Buy rating and a consensus price target of $191.67 that reflects expectations formed before the split-adjusted pullback.[1][3][5]
Macro tailwinds are part of the story. Demand tied to AI infrastructure and IT datacom buildouts has been a key contributor to Amphenol’s revenue growth, as hyperscale data centers and cloud providers continue to invest in high-speed connectivity and power solutions.[2][4] Within the technology sector, Amphenol’s positioning in the Electronics – Connectors industry and its high MarketRank percentile have made it a favored way to play that hardware layer of the AI theme, especially for investors looking beyond the headline chip names.[1][2]
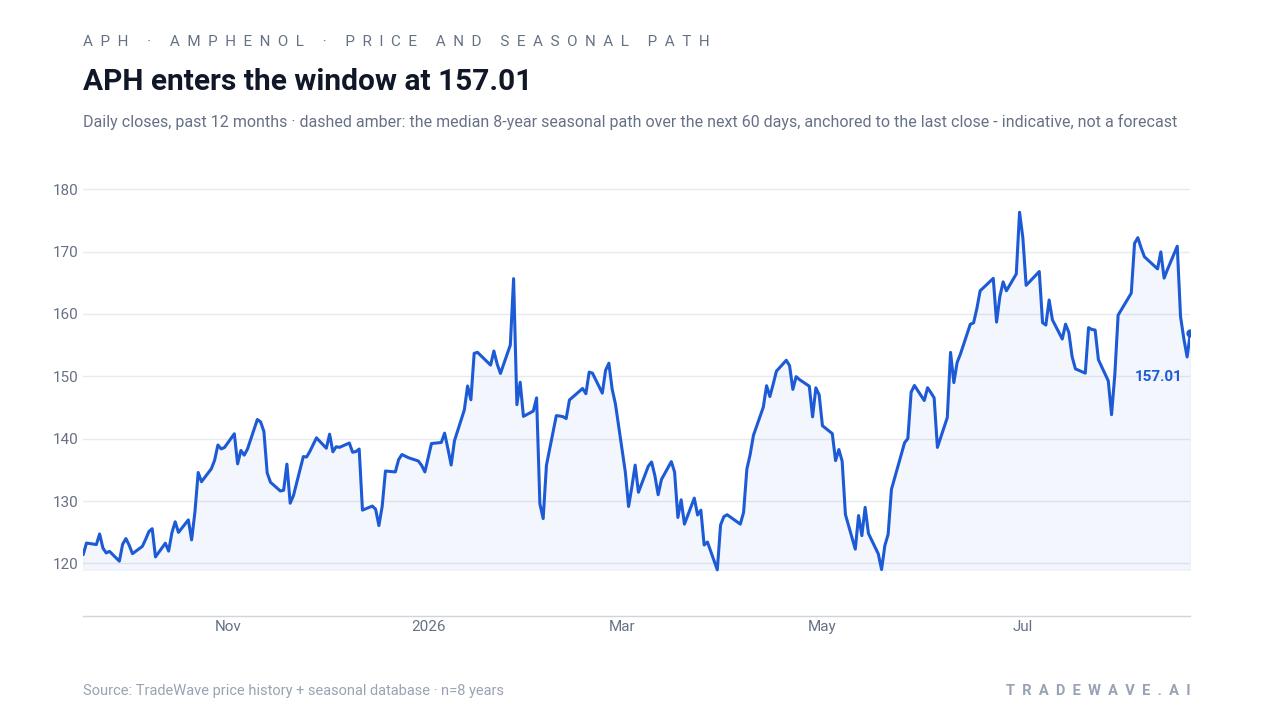
The chart below situates the latest move in its recent multi-month context and overlays the median historical seasonal path for the next 60 days.
What should traders watch as the Sep 18 window approaches?
First, the calendar. The 202-day window opens on Sep 18 and runs through Apr 7, spanning the final stretch of the midterm election year and the early months of the year before the presidential election. Historically, that phase has been friendlier to growth and technology hardware than the choppier early-midterm months, and Amphenol’s 8-for-8 record in this specific slice of the calendar reflects that backdrop.
Second, the levels. With the stock sitting well below its 52-week high but still positive year to date, traders will be watching whether Amphenol can hold above the recent post-split lows around the 79–80 area while building a base into the window. A pattern of higher lows into late September would line up with the historical seasonality, while a decisive break lower with expanding volume would be an early sign that this cycle may diverge from the past.
Third, the macro and policy tape. Any shifts in fiscal spending priorities, industrial policy, or regulation around AI and communications infrastructure as the midterm election year wraps up could influence capital spending plans for Amphenol’s customers.[2][4] Strong follow-through on AI and datacom orders into Q3 and beyond would support the historical pattern of late-year strength, while signs of budget fatigue or delayed projects would cut against it.
Finally, watch how the stock behaves inside the window relative to its historical intraperiod swings. In prior cycles, Amphenol has often seen double-digit drawdowns within the Sep 18 – Apr 7 stretch before finishing higher, so a sharp pullback on company-specific or macro headlines would not automatically invalidate the seasonal tendency. What would be more concerning for pattern followers is a sustained failure to recover those dips or a series of lower highs that persist well into the year before the presidential election, which would mark a clear break from the historical APH seasonal trend.
Sources
- MarketBeat - Amphenol (APH) Stock Price, News & Analysis
- Barchart - Dear Amphenol Stock Fans, Mark Your Calendars for September 2
- MarketBeat (instant alert) - Amphenol (NYSE:APH) Stock Passes Above 200-Day Moving Average - Should You Sell?
- Yahoo Finance - Amphenol (APH) Up 1% Since Last Earnings Report: Can It Continue?
- Yahoo Finance - Amphenol (APH) Upgraded to Strong Buy: Here's Why
About this seasonal analysis
Seasonal pattern data is sourced from TradeWave.ai, which analyzes historical price behavior across annual calendar windows going back up to 30 years. Read the full data methodology or the book The 100-Year Pattern by Afshin Moshrefi (2026 edition). Past performance of seasonal patterns does not guarantee future results. This article is for informational purposes only and does not constitute investment advice.