HP Inc. (HPQ) Ex-Dividend Date Nears as a 138-Day Midterm Rally Window Approaches
HP Inc. is approaching a historically powerful Sep 27–Feb 11 trading window just as shares hover near a 52-week high, putting extra focus on how this seasonal pattern lines up with dividends and earnings momentum.
Price as of Sep 4, 2026: $32.64 (last close).

What is the seasonal pattern for HP Inc. (HPQ)?
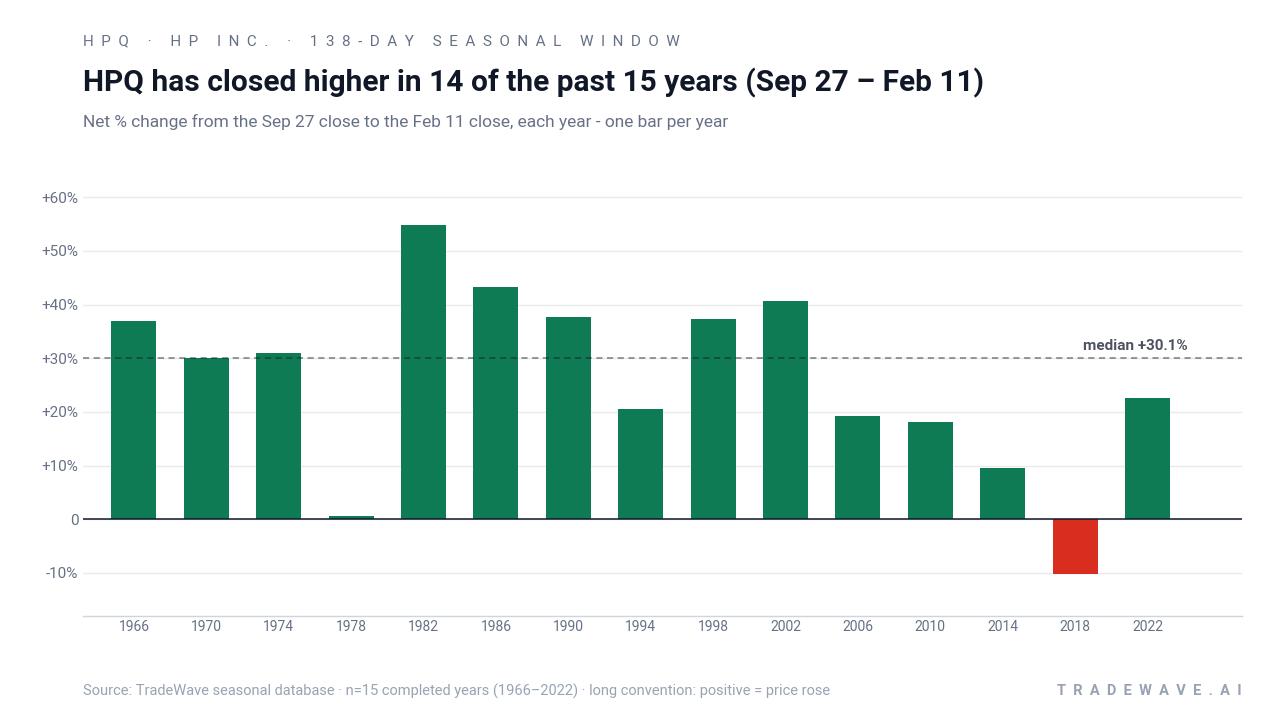
HP Inc. has risen in 14 of 15 years during this Sep 27–Feb 11 midterm-year window, with an average gain of 28.73% in winning years.
- 14 for 15 in this window, with winning years averaging 28.73% gains and only one losing year across the sample.
- The Sep 27–Feb 11 trading window spans 138 days and aligns with the last part of midterm election years, rolling into the pre-election year.
- Percent Profitable is 93%, with 14 winners and 1 loser, pointing to an unusually consistent bullish HPQ seasonal trend.
- Avg Profit - All, which includes the lone losing year, still comes in at 26%, underscoring how strong the typical outcome has been.
- Historical intraperiod swings show sizable upside runs but also meaningful drawdowns, so traders have faced real volatility inside this HP Inc. trading window.
- The pattern is long-directional, meaning the historical edge has come from being aligned with upside moves rather than betting against the stock.
According to historical data from TradeWave.ai, this specific midterm-year stretch has behaved very differently from an average few months on the HPQ calendar, and the next iteration is less than three weeks away.
How has HP Inc. (HPQ) traded in the Sep 27–Feb 11 midterm-year window?
HP Inc. has closed higher in 14 of the last 15 midterm election years during the Sep 27–Feb 11 window, with winning years averaging gains of 28.73%. Today the stock finished at 32.64, up 2.2% on the session and about 0.4% below its 52-week high of 32.78, leaving it near the top of its recent range.
Because this pattern is grouped by the presidential election cycle, it only looks at the last 15 midterm election years, not 15 consecutive calendar years. That matters for HPQ because midterm years often feature tighter fiscal policy debates and more volatile risk appetite early in the year, followed by a friendlier backdrop as markets look ahead to the year before the presidential election, which has historically been one of the stronger phases for equities.
In this window the trade direction is explicitly long, and the historical record is striking: 93% of the sampled midterm years finished higher, with 14 winners against just 1 loser. Average gains in the up years came in at 28.73%, while including the single down year still leaves an all-years average of 26%, which is unusually high for a roughly four-and-a-half-month stretch. The median outcome of 30.05% shows that the typical winning year was not just a small drift higher but a sizable move.
The per-year breakdown shows how that plays out in practice. Strong years such as 2002 and 1986 posted net returns of 40.67% and 43.28% respectively, with maximum favorable moves inside the window reaching 76.99% and 47.32% from the entry price. Even more moderate years like 2010 and 1994 still delivered double-digit gains, while the lone losing year, 2018, saw a net decline of 10.17% despite a brief 5.66% run-up before a deeper drawdown.
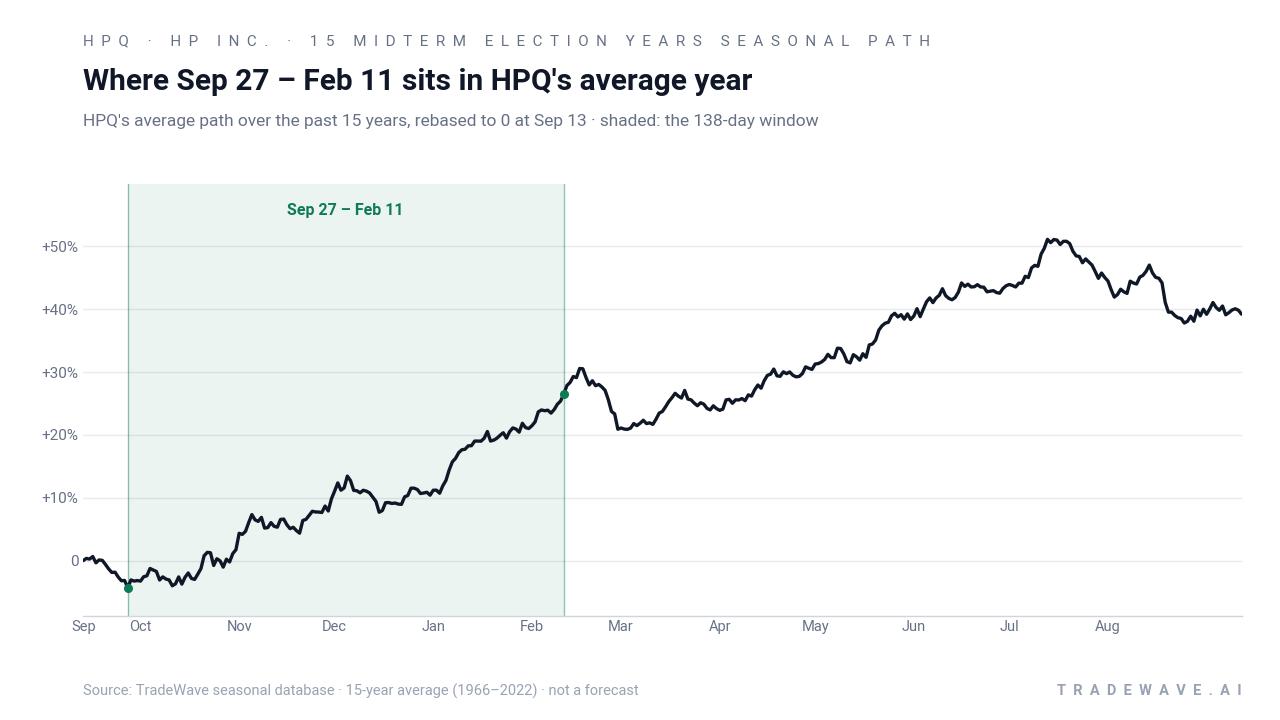
The historical seasonal average chart shows HPQ’s typical year bending higher as this window gets underway, with much of the cumulative gain accruing in the middle of the period rather than in a single burst. That suggests the pattern has tended to reward patience across the full 138 days, even though individual years have seen different paths to the finish line.
A second view of the same window highlights how far HPQ has tended to travel up and down inside the period before settling at its final result.
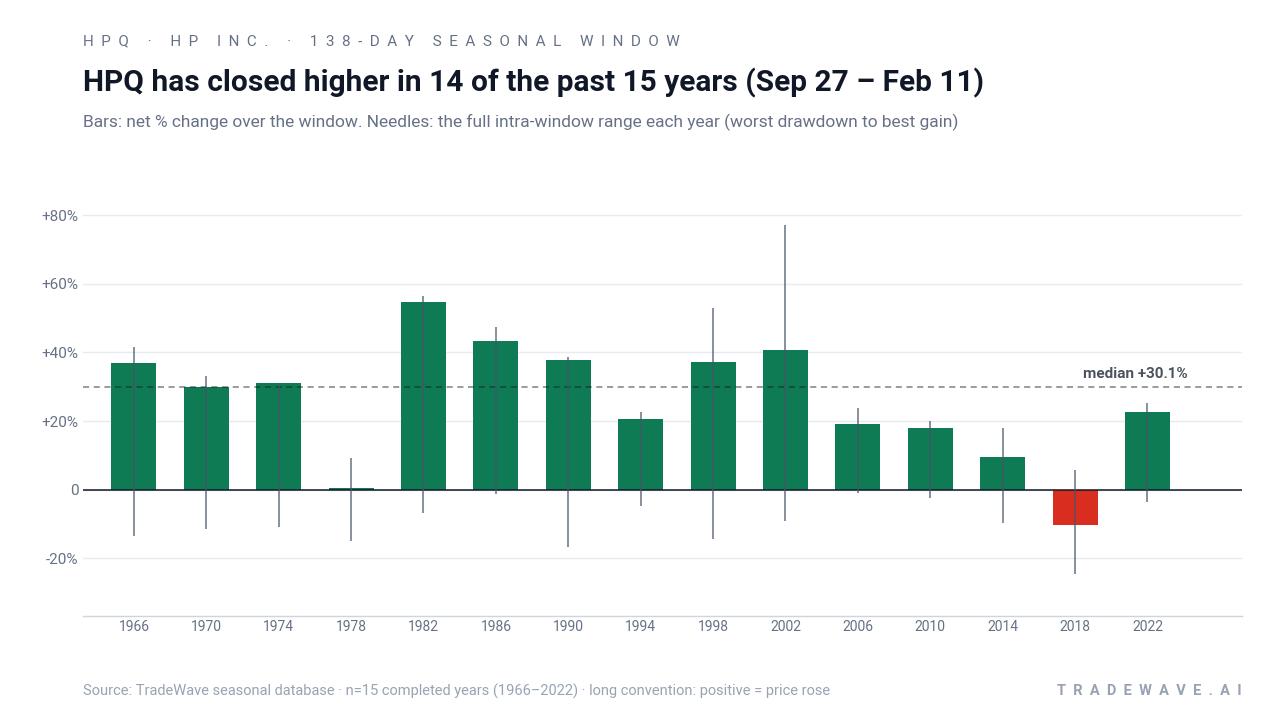
The combined net / MFE / MAE view shows that even in strong years, HPQ has often experienced meaningful downside before finishing higher. For example, 1990 and 1998 both saw double-digit maximum adverse moves of -16.74% and -14.34% inside the window, even though they ultimately closed up 37.69% and 37.31%. In the losing 2018 window, the worst drawdown reached -24.47%, illustrating that when this pattern goes wrong, it can do so with real size.
History does not guarantee future results; adverse excursions (MAE) can be large even in winning windows.
Why does HP Inc. (HPQ) follow this seasonal pattern?
One likely driver is the way HP Inc.’s earnings calendar and guidance cadence line up with the broader presidential election cycle. The Sep 27–Feb 11 stretch captures the heart of the holiday PC and printer demand season, year-end budget flush from corporate and public-sector buyers, and early-year refresh cycles, all of which can support hardware names. At the same time, institutional investors often rebalance into quality, cash-generative tech ahead of the year before the presidential election, when risk appetite has historically improved, which may help reinforce this recurring HPQ seasonal pattern.
What is driving HP Inc. (HPQ) today?
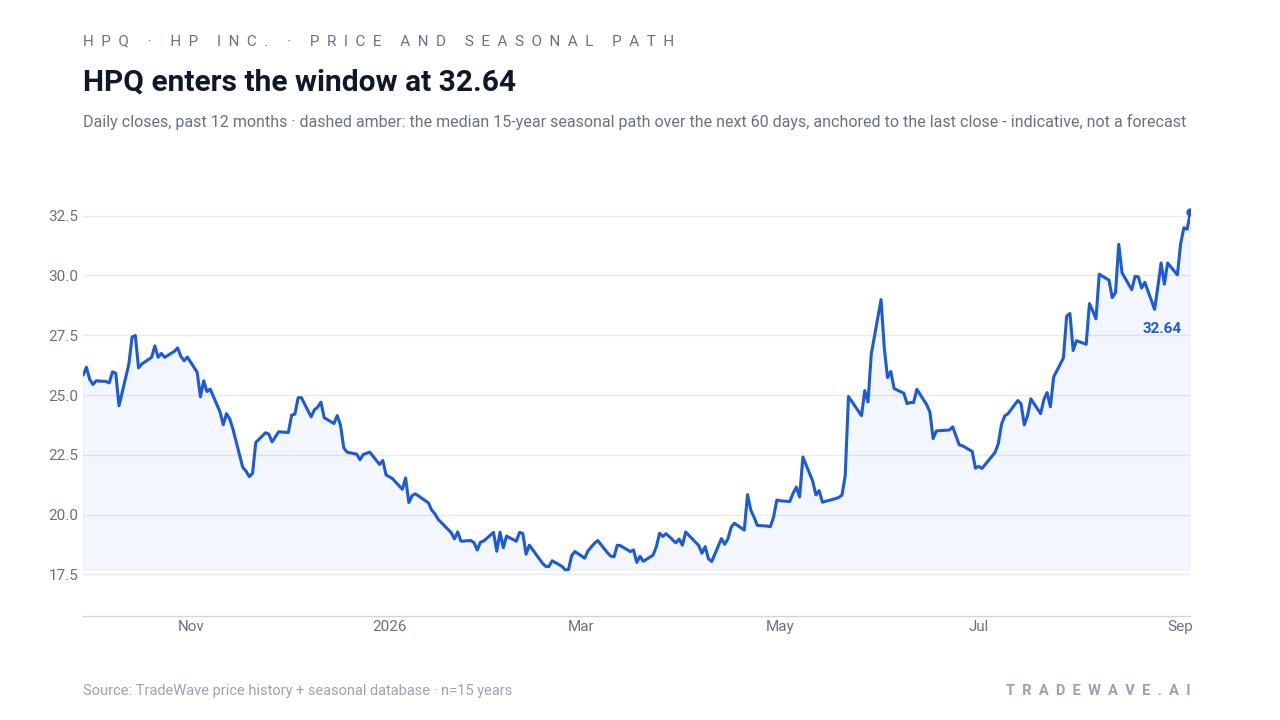
HPQ closed Monday at 32.64, up 0.71 points or 2.2% on the day, after trading between 31.625 and 32.78 on volume of about 13.3 million shares. The stock is sitting just under its 52-week high of 32.78 and well above its 50-day moving average of 27.21, with a one-month gain of 8.62% and 20-day average volume around 14.96 million shares, signaling firm interest into September.
Fundamentally, HP Inc. is coming off a quarter where it beat consensus earnings estimates by 10.67%, and Wall Street expects full-year EPS of $3.07 on roughly $60.01 billion in revenue, pointing to solid near-term profitability and cash generation that can support buybacks and dividends.[1] The company is also on lists of stocks with upcoming ex-dividend dates, a detail that can draw in income-focused investors and short-term yield strategies as the date approaches, potentially adding incremental demand around the same late-September period when the historical seasonal window opens.[1]
Sector-wise, HP Inc. sits in the Computer - Micro Computers industry, which Zacks places in the top 19% of its industry rankings, suggesting the broader hardware group has had supportive earnings and estimate revision trends relative to the rest of the market.[1] That backdrop matters because the seasonal pattern is strongest when it lines up with constructive fundamentals and a favorable sector tape, rather than fighting against a deteriorating industry cycle.
The chart below situates the latest move in its recent multi-month context and overlays the median 60-day seasonal path as a reference, not a forecast.
What should traders watch as this HPQ seasonal window approaches?
First, the calendar: the next iteration of the Sep 27–Feb 11 window begins on Sep 27, landing just after HPQ’s upcoming ex-dividend date and as investors pivot from the concluding midterm election year into the year before the presidential election. That transition has often coincided with a friendlier policy and liquidity backdrop for equities, which historically lines up with the strong HPQ seasonal pattern in this stretch.
Second, price levels: with HPQ trading near its 52-week high and well above its 50-day moving average, traders will be watching whether the stock can hold the high-20s to low-30s band as the window opens, or whether a pullback closer to the moving average appears before any potential seasonal tailwind. Behavior around that support zone will help show whether the current rally is extended or simply consolidating ahead of the historically strong period.
Third, volatility inside the window: past cycles show that even winning years have seen double-digit intraperiod drawdowns, so traders may focus on how HPQ reacts to any macro or company-specific shocks between late September and February. A pattern of sharp but contained dips followed by recoveries would rhyme with prior strong years, while a deep drawdown that fails to reverse would look more like the 2018 outlier.
Finally, flows around dividends and earnings: as the ex-dividend date passes and the next earnings update approaches, investors will be watching whether buyback activity, institutional positioning, and any options-market interest build or fade. Follow-through in those flows, combined with how HPQ trades relative to its historical seasonal path, will help confirm whether this midterm-year window continues to behave like the prior 14 winners or starts to look more like the lone losing year.
Sources
About this seasonal analysis
Seasonal pattern data is sourced from TradeWave.ai, which analyzes historical price behavior across annual calendar windows going back up to 30 years. Read the full data methodology or the book The 100-Year Pattern by Afshin Moshrefi (2026 edition). Past performance of seasonal patterns does not guarantee future results. This article is for informational purposes only and does not constitute investment advice.