Heavy Put Buying Into HP Inc. (HPQ) Q2 as a Bullish 138-Day Midterm Window Nears
HP Inc. is approaching a historically powerful Sep 27 to Feb 11 trading window just as shares hover near 52-week highs and options traders lean heavily on puts.
Price as of Sep 3, 2026: $31.93 (last close).

What is the seasonal pattern for HP Inc. (HPQ)?
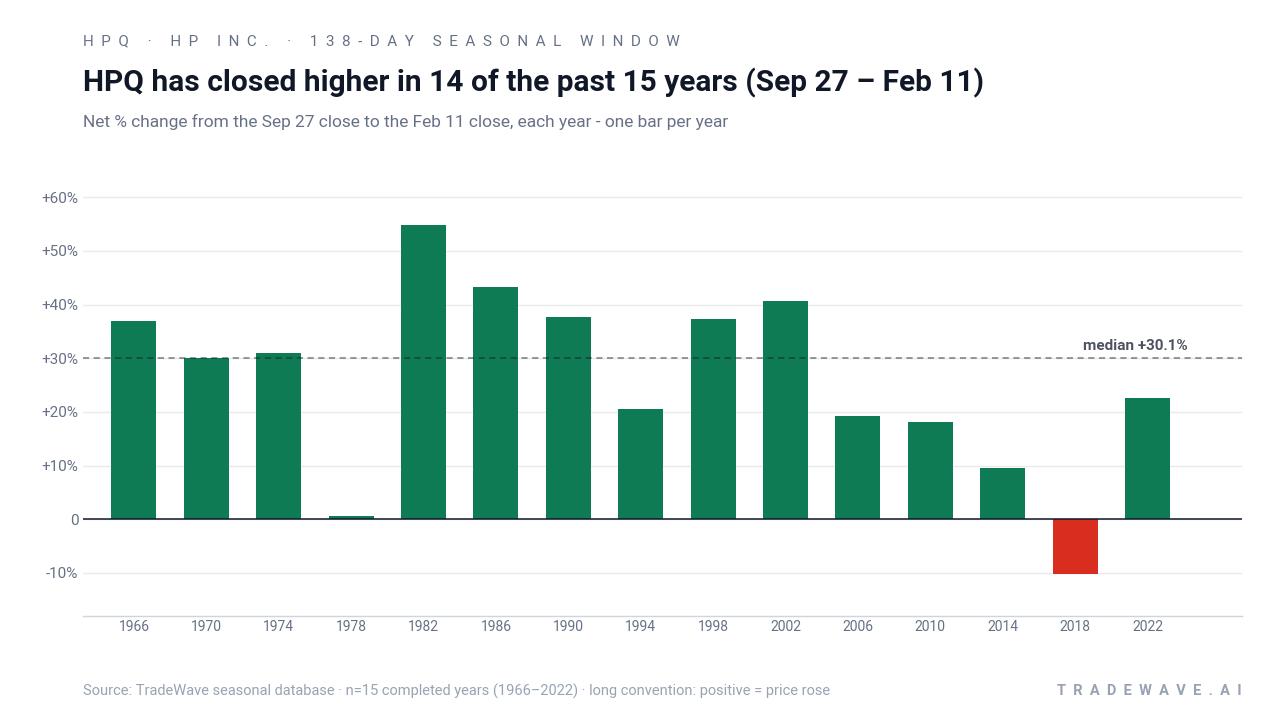
HP Inc. has risen in 14 of the last 15 midterm-year Sep 27 to Feb 11 windows, with an average gain of 28.73% in winning years.
- 14 for 15 in this window, with winning years averaging 28.73% gains and only one losing year in the sample.
- The 138-day trading window runs from Sep 27 to Feb 11 in midterm election years and has a long trade direction.
- Percent Profitable is 93%, with 14 winners and 1 loser across the last 15 midterm election-year cycles.
- Including all years, Avg Profit - All is still a strong 26%, while the single losing year saw a -10.17% decline.
- The TradeWave Ratio of 1.67 and Sharpe ratio of 1.43 point to historically strong upside moves relative to volatility.
- Intraperiod swings have included deep drawdowns in some years, so traders have faced meaningful downside before the pattern paid off.
According to historical data from TradeWave.ai, this specific midterm-year stretch has behaved very differently from an average few months on the HPQ calendar, and the next iteration is less than a month away.
How has HP Inc. (HPQ) traded in the Sep 27 to Feb 11 window?
HP Inc. has closed higher in 14 of the past 15 midterm election years during the Sep 27 to Feb 11 window, with an average gain of 28.73% in winning years. Today the stock finished at 31.93, leaving it about 1.9% below its 52-week high of 32.55 and almost double its 52-week low near 16.60. Heavy long-dated put buying and unusually large put volumes around the upcoming earnings report show that options traders are leaning defensively into this setup, even as the historical seasonal trend has favored the long side in this phase.[5]
Grouping the data by the presidential election cycle matters here because this window always lands in the final weeks of a midterm election year and runs deep into the year before the presidential election, a phase that has often coincided with clearer policy visibility and stronger risk appetite in U.S. equities. For HP Inc., that means the Sep 27 to Feb 11 stretch has repeatedly lined up with a friendlier macro and liquidity backdrop than the choppier early-midterm months.
Historically, the trade direction for this HPQ seasonal pattern is long, and the win-loss record is striking: 93% Percent Profitable with 14 winners and just 1 loser across the last 15 midterm election-year cycles. Average gains in the winning years come in at 28.73%, while the single losing year, 2018, saw a -10.17% decline over the same 138-day span. When you blend winners and the lone loser together, Avg Profit - All still lands at 26%, which is unusually strong for a multi-month stock pattern.
The per-year breakdown shows how that plays out in practice. Strong years like 2002 and 1986 delivered net returns of 40.67% and 43.28% respectively, with maximum favorable moves inside the window reaching 76.99% and 47.32% from the entry price. Even more moderate outcomes such as 2010 and 1994 still posted double-digit gains, while the weakest positive year, 2014, managed a 9.62% rise despite a mid-window wobble.
Intraperiod swings have not been one-way. The maximum adverse move, or worst drawdown from entry within the window, ranged from shallow dips of around -1% in 1986 and 2006 to a sharp -24.47% in 2018. That losing 2018 window is the outlier where HPQ briefly rallied 5.66% at best but ultimately finished down -10.17%, showing that even in a historically strong seasonal regime, a poor tape can overwhelm the pattern for a cycle.
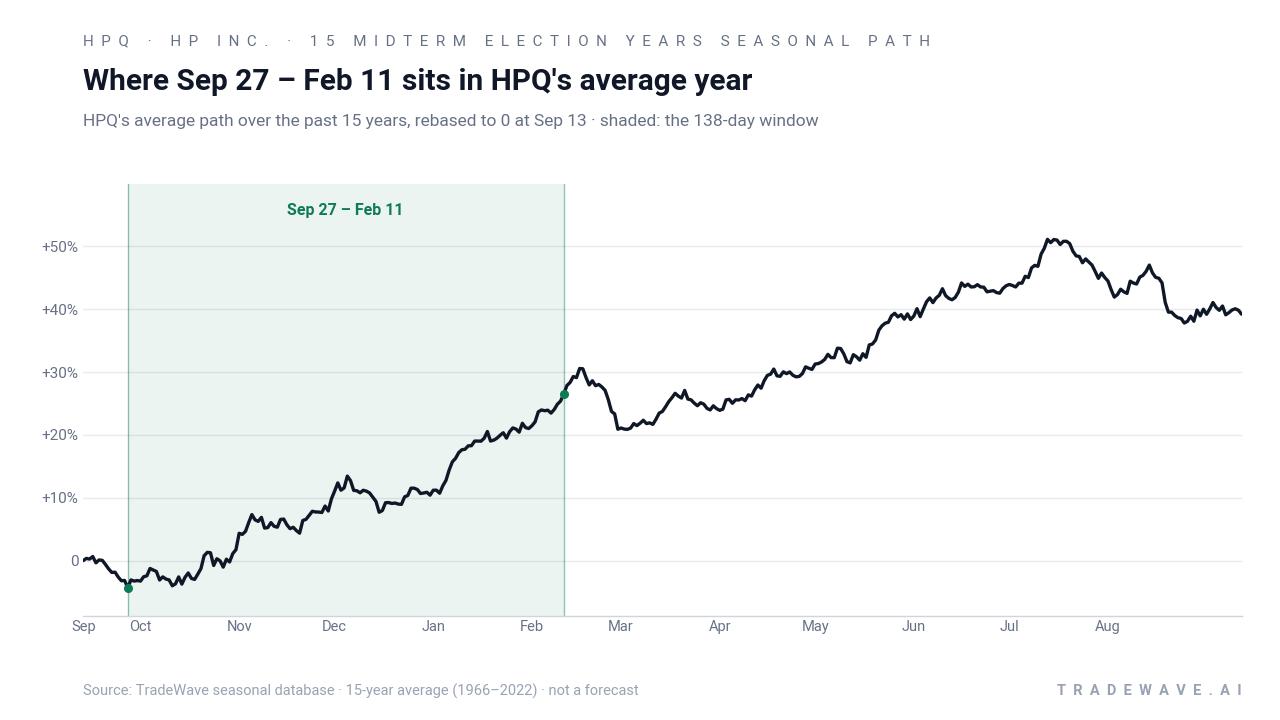
The historical seasonal average chart shows HPQ’s typical year bending higher as this window progresses, with gains often starting to accumulate early in the stretch and compounding into the winter. That profile contrasts with the flatter behavior seen in other parts of the calendar, suggesting that this midterm-to-pre-election bridge has been one of the stock’s more reliable uptrends.
A closer look at yearly ranges shows how upside and downside have coexisted inside this bullish window.
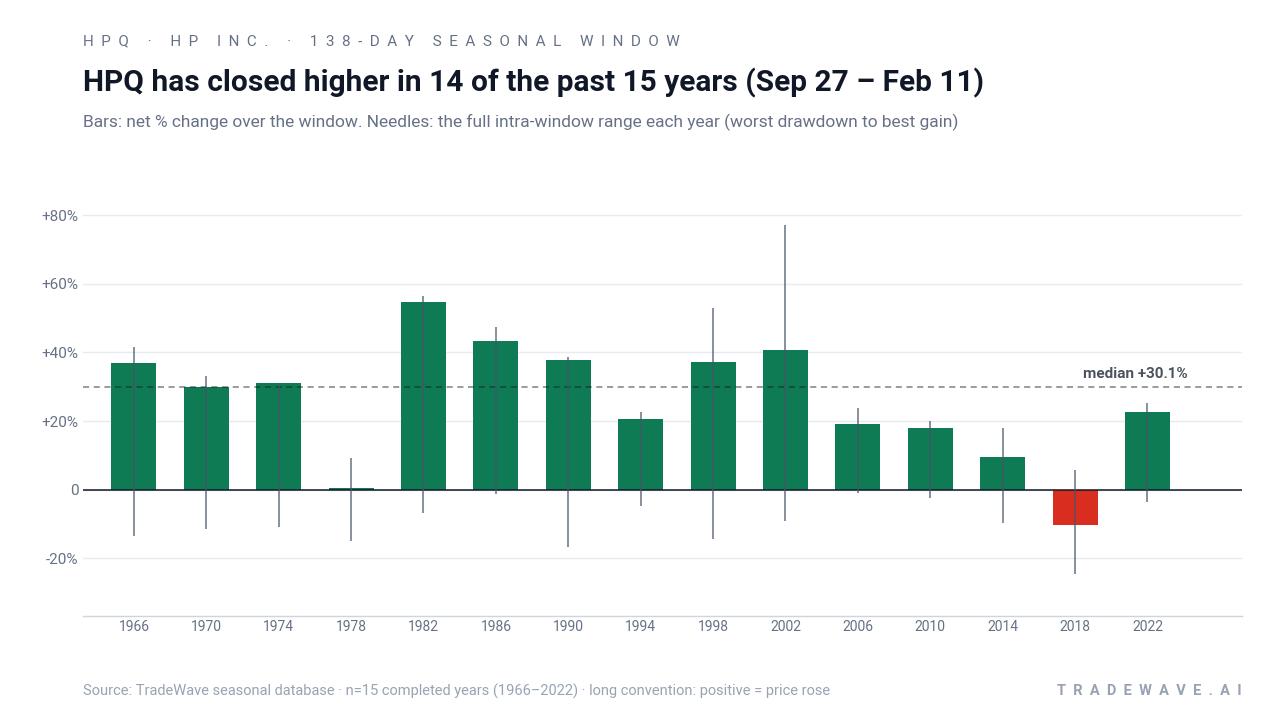
The combined net / maximum favorable / maximum adverse chart makes that trade-off clear. In many years, HPQ has enjoyed large maximum favorable excursions inside the window, often 20% to 50% above the entry, while maximum adverse moves have typically stayed in the single digits but occasionally spiked into the mid-teens or worse. That mix of strong upside potential with intermittent air pockets is what drives the 1.67 TradeWave Ratio and 1.43 Sharpe ratio, but it also means traders have had to sit through volatility to capture the pattern.
The cumulative return profile is even more dramatic. Stacking this 138-day window across the 15 midterm election years compounds to a 2,731% cumulative gain, underscoring how consistently the pattern has added value when repeated over multiple cycles. Add it up: a long-only investor who only held HPQ during this specific midterm-year window would have captured a very different return stream than someone who stayed in the stock year-round.
History does not guarantee future results; adverse excursions can be large even in winning windows, and a single outlier year like 2018 shows that the pattern can fail.
Why does HP Inc. (HPQ) follow this seasonal pattern?
One likely driver is the way HP’s fiscal calendar and earnings cadence line up with the broader presidential election cycle. The Sep 27 to Feb 11 stretch often captures fiscal year-end positioning, PC and printer demand around the holiday and back-to-school refresh, and institutional portfolio rebalancing as investors rotate into or out of value-oriented tech names. Analysts have also pointed to the year before the presidential election as a historically supportive period for risk assets, which may amplify flows into established technology hardware stocks like HP Inc. during this window.
What is driving HP Inc. (HPQ) today?
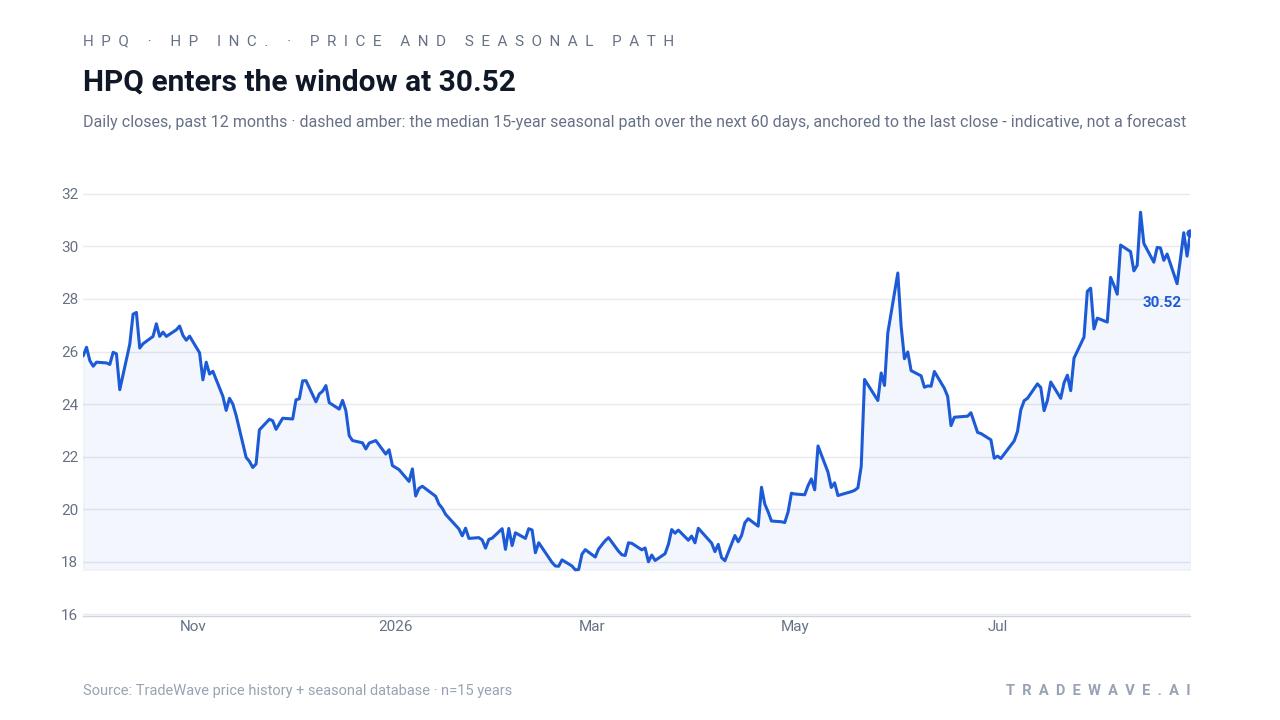
HPQ ended Friday at 31.93, down 0.19% on the day, after trading between 31.37 and 32.48 on volume slightly below its 20-day average of about 14.7 million shares. The stock sits just under its 52-week high of 32.55 and well above its 50-day moving average near 26.84, reflecting a strong rebound from last year’s lows as estimate revisions have turned more constructive in recent weeks.[2][3] At the same time, options desks have flagged heavy long-dated put activity and unusually large put volumes at specific strikes, with short-put yields around 7.4% and concentrated bearish positioning around earnings, signaling that some traders are hedging or betting on downside even into a historically strong seasonal phase.[5][6][7]
Fresh Zacks commentary this week highlighted that earnings estimates for HP have been moving higher, with consensus EPS expectations firming as the company leans on cost controls and a gradual recovery in PC demand.[2][3] That shift follows a tougher stretch earlier in the year when HP was tagged as a “Bear of the Day” on concerns about margin pressure and soft printing trends, a call that came in January 2026 before the latest rally.[8] In the background, HP’s filings and prior guidance have pointed to rising memory prices and constrained DRAM and NAND supply as ongoing headwinds for PC margins, even as management has pushed AI PC and Windows 11 refresh themes to support the personal systems segment.[1][4]
Options-focused coverage from Barchart and Yahoo Finance on Aug 11 and Aug 26 detailed “huge” unusual activity in long-dated HPQ puts, including more than 2,000 contracts trading at a single strike and multi-times normal volume around the earnings date.[5][6][7] That kind of flow can reflect outright bearish bets, hedging by existing shareholders, or yield-seeking short-put strategies, but in any case it marks HPQ as a name where positioning is more cautious than the price chart alone might suggest. For traders watching the upcoming Sep 27 seasonal window, the tension between a historically bullish HPQ seasonal trend and a market leaning into protective puts is the key setup to monitor.
The chart below situates the latest move in its recent multi-month context alongside the median seasonal path.
What should traders watch as this HPQ seasonal window approaches?
First, the calendar: the next iteration of this 138-day window opens on Sep 27, right as markets wrap up the midterm election year and pivot into the historically stronger year before the presidential election. That timing means any macro shifts in rates, fiscal policy or tech regulation into year-end could either reinforce or blunt the usual HPQ seasonal tailwind.
Second, price levels matter. Traders will be watching whether HPQ can hold above its 50-day moving average and continue to respect support in the high-20s if volatility picks up. A pattern-consistent path would see the stock avoid deep breaks below that moving average and start to build higher lows into October and November, echoing the historical tendency for gains to accrue through the heart of the window.
Third, the options signal bears monitoring. If the unusual long-dated put activity and heavy put volumes persist or expand as Sep 27 approaches, it would suggest that institutional players remain skeptical of the rally and are willing to pay for downside protection.[5][6][7] A fade in that put demand, or a shift toward call buying and put selling, would indicate that positioning is starting to align more closely with the bullish HPQ seasonal trend.
Finally, earnings and guidance will be the fundamental check on the pattern. Estimate revisions have turned more positive into the fall, but any disappointment on margins, free cash flow or PC demand could turn the lone losing precedent of 2018 into a more relevant template.[2][3] For traders who care about seasonality, the key tell will be how HPQ behaves inside the window: strength on dips and follow-through on good news would rhyme with the last 15 midterm election years, while a failure to hold support or a sharp post-earnings slide would mark a rare break from one of the stock’s most powerful historical trading windows.
Sources
- Zacks Investment Research - HPQ to Report Q2 Earnings: What's in the Cards for the Stock?
- Zacks Investment Research - Earnings Estimates Moving Higher for HP (HPQ): Time to Buy?
- Zacks Investment Research - Why HP (HPQ) is a Top Momentum Stock for the Long-Term
- U.S. Securities and Exchange Commission (SEC) - hpq-20251031
- Barchart - HP Inc. Has Unusual Put Option Activity - A 7.4% Short-Put Yield - But Is It a Trap?
- Barchart - HP, Inc. Results Today - Huge, Unusual Options Activity in Long-Dated HPQ Puts
- Yahoo Finance (republishing Barchart content) - HP, Inc. Results Today - Huge, Unusual Options Activity in Long-Dated HPQ Puts
- Zacks Investment Research - Bear of the Day: HP Inc. (HPQ)
About this seasonal analysis
Seasonal pattern data is sourced from TradeWave.ai, which analyzes historical price behavior across annual calendar windows going back up to 30 years. Read the full data methodology or the book The 100-Year Pattern by Afshin Moshrefi (2026 edition). Past performance of seasonal patterns does not guarantee future results. This article is for informational purposes only and does not constitute investment advice.