Bath & Body Works, Inc. (BBWI) Has Risen 10 Straight Midterm Autumns, Averaging 15.63% Gains
Bath & Body Works, Inc. is heading toward a historically strong 61-day fall window even as shares trade well below their 52-week high and traders brace for more volatility around earnings and options positioning.
Price as of Aug 27, 2026: $18.65 (last close).

What is the seasonal pattern for Bath & Body Works, Inc. (BBWI)?
Bath & Body Works, Inc. has risen in 10 of 10 midterm-year autumn windows from Sep 27 to Nov 26, with an average gain of 15.63% in winning years.
- 10 for 10 in this window, with Bath & Body Works, Inc. averaging 15.63% gains across all winning years.
- Seasonal window runs from Sep 27 to Nov 26 over the last 10 midterm election years, aligned with the early holiday shopping season.
- Percent Profitable is 100%, with 10 winners and 0 losers in the historical sample.
- Trade Direction is long, supported by a TradeWave Ratio of 3.81 and a Sharpe ratio of 1.93, pointing to strong risk‑adjusted returns.
- Individual years have seen intraperiod drawdowns as deep as about 17% before finishing higher, so the ride has not been smooth.
- Cumulatively, stacking this 61-day window across the 10 midterm cycles would have compounded to roughly 318% total return.
According to historical data from TradeWave.ai, this specific midterm-year autumn stretch has behaved very differently from an average month on the calendar for BBWI, and the next iteration is less than a month away.
How has Bath & Body Works, Inc. (BBWI) traded in this midterm-year autumn window?
Bath & Body Works, Inc. has closed higher in every one of the last 10 midterm election years during the Sep 27 to Nov 26 window, posting an average gain of 15.63% and a cumulative 318% across those cycles. Shares finished Friday at 18.65, down 1.3% on the day and sitting about 39.8% below their 52-week high of 30.99, with the next 61-day seasonal window set to open in less than a month.
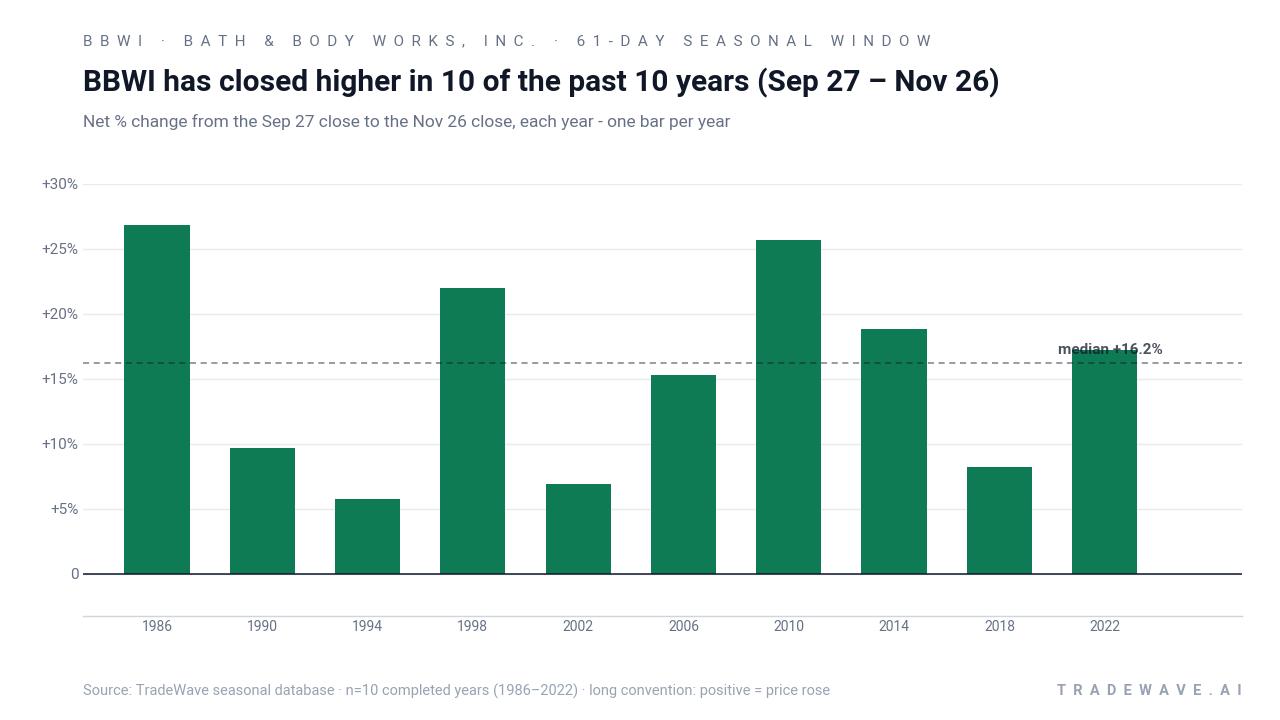
Because this pattern is grouped by the presidential election cycle, it only looks at midterm election years, which tend to feature tighter fiscal policy debates and more volatile consumer sentiment than the year before a presidential vote. For a specialty retailer tied to discretionary spending, that context matters: the window captures both early holiday merchandising and investor repositioning as markets transition from the midterm year into the historically stronger pre‑election year.
Across the 10 midterm-year samples, the trade direction is firmly long. Percent Profitable is 100%, with 10 winners and 0 losers, and the average gain of 15.63% means the typical year in this BBWI seasonal trend has delivered a mid‑teens return over just 61 days. Median profit of 16.24% shows that the distribution is not skewed by a single outlier; several years, including 1986, 2010 and 2014, posted gains between roughly 15% and 27%.
The per-year table shows the strongest window in 1986, when BBWI rallied 26.79% between late September and late November, with a maximum favorable move of 28.71% before giving back a small portion into the close. The softest outcome still counted as a win: in 1994 the stock gained 5.72%, after swinging between a best intraperiod gain of 11.76% and a worst drawdown of 9.8% from the entry level.
Intraperiod swings have been meaningful. In 2002, for example, BBWI finished the window up 6.93% but endured a maximum adverse move of 17.29% along the way, highlighting that even winning years have featured double‑digit drawdowns before recovering. On the upside, several years saw maximum favorable excursions north of 20%, including 1990, 1998, 2010, 2014 and 2022, which underscores how aggressively the stock has sometimes repriced higher once the window was underway.
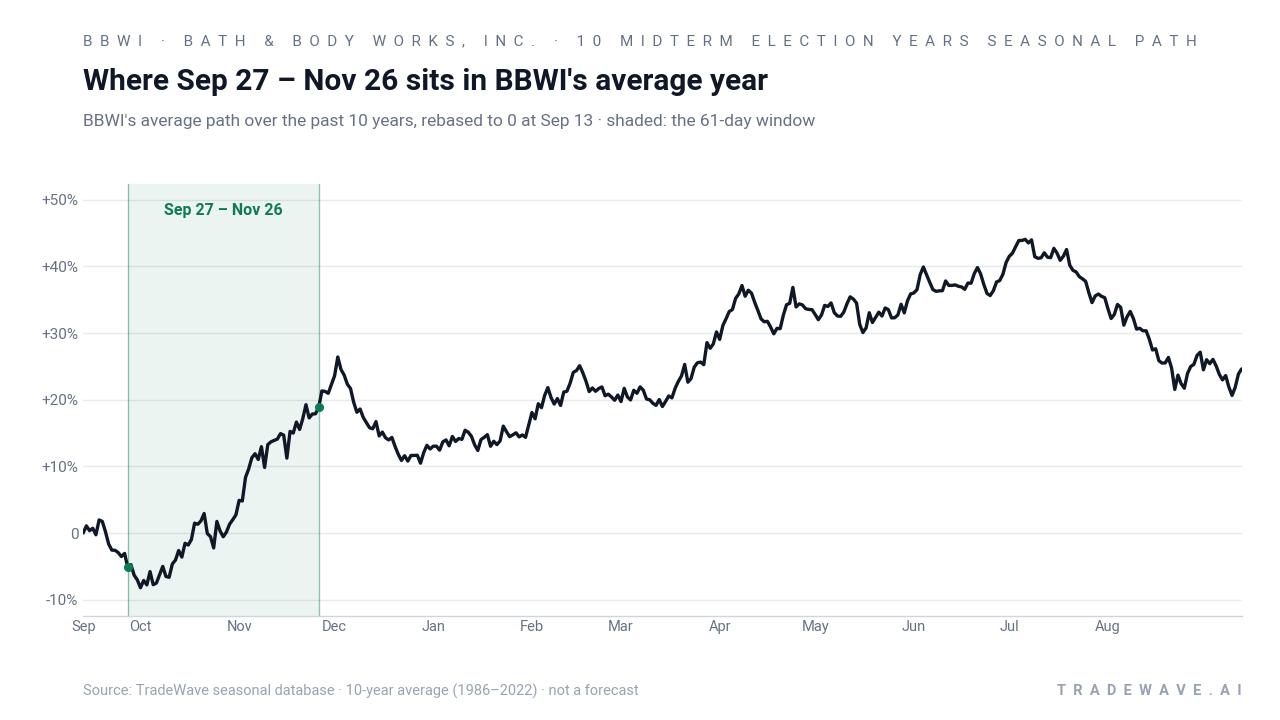
The historical seasonal average chart shows BBWI typically grinding higher through this stretch rather than spiking in a single burst. Gains tend to build from early October into mid‑November, which lines up with the ramp in holiday marketing and promotional activity across specialty retail. The path is not perfectly smooth, but the average line slopes upward for most of the 61 days, consistent with the all‑winner record.
Year‑by‑year ranges of best and worst moves inside the window show how much room BBWI has historically had to run and to whipsaw before the final close.
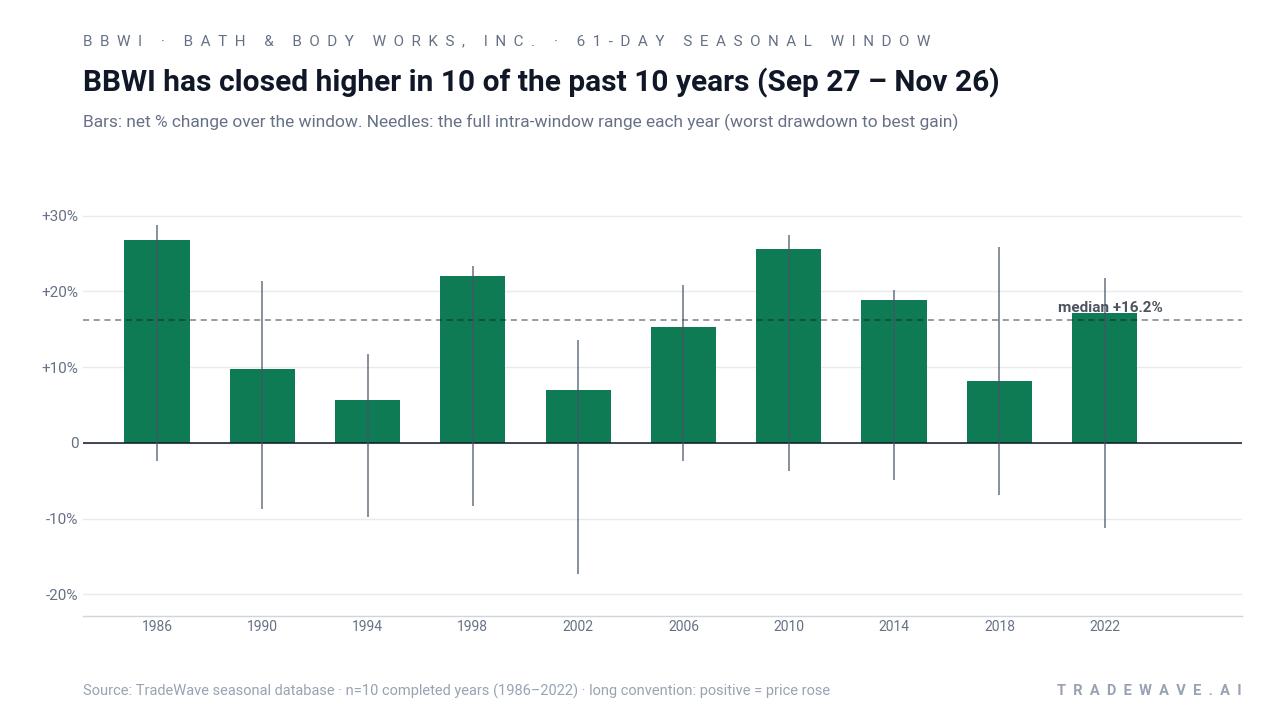
The combined net / maximum favorable / maximum adverse chart makes the volatility profile clear: in most years, BBWI has seen upside potential in the 20% to 28% range, while the worst drawdowns have often sat between 5% and 12%, with one year near 17%. That mix of large positive excursions and non‑trivial downside is what drives a TradeWave Ratio of 3.81 and a Sharpe ratio of 1.93, suggesting that historically the upside has outweighed the turbulence but that the path has rarely been straight.
History does not guarantee future results; even in windows where BBWI ultimately finished higher, intraperiod drawdowns have at times been deep and fast.
Why does Bath & Body Works, Inc. (BBWI) follow this seasonal pattern?
One likely driver is the consumer spending cycle, as this 61‑day window captures the build‑up to the holiday season when shoppers stock up on home fragrance and gifting items. Analysts have also pointed to how specialty retailers often see earnings expectations reset earlier in the year, leaving room for positive surprises and multiple expansion into late autumn.[3] The midterm‑to‑pre‑election transition may add another layer, with investors rotating back into consumer names as policy uncertainty around taxes and spending begins to clear.
What is driving Bath & Body Works, Inc. (BBWI) today?
BBWI closed at 18.65 on Friday, down 1.3% on the session and roughly 39.8% below its 52‑week high of 30.99, after a choppy stretch that has left the stock about 32.8% above its 52‑week low of 14.04. The move comes in the wake of Q2 results reported on Aug 26, 2026, where adjusted EPS printed at $0.62, though only $0.31 excluding roughly $80 million of tariff refunds, on net sales of $1.5 billion, a structure that flattered margins but left underlying demand trends looking more subdued.[3] Options traders have been leaning into that volatility, with one analysis highlighting contracts around the Aug 28 expiration pricing an implied move of about 10.69%, a sign that the market is braced for big swings rather than a quiet consolidation.[4]
That earnings mix also sits on top of a longer narrative. In Nov 2025, management cut its full‑year outlook after a quarter where adjusted EPS and revenue both missed expectations, citing “macro consumer pressures” that were weighing on discretionary spending.[2] By Aug 2026, the company had narrowed its forecast for a full‑year sales decline and raised adjusted earnings guidance, helped by the tariff refunds, but commentary still pointed to a pressured underlying business that needs cleaner demand growth to sustain any rally.[1][3]
Sector context matters as well. BBWI sits in the specialty retail group, where investors have been sorting winners and laggards based on pricing power, inventory discipline and exposure to lower‑income consumers.[5] A July 2026 fundamental review flagged BBWI’s dividend yield and balance sheet as relative strengths but also stressed that execution on product mix and traffic is critical if the stock is going to close the gap with its historical valuation multiples.[6]
The chart below shows how that backdrop has played out in price terms over the past year, alongside the median 60‑day seasonal path.
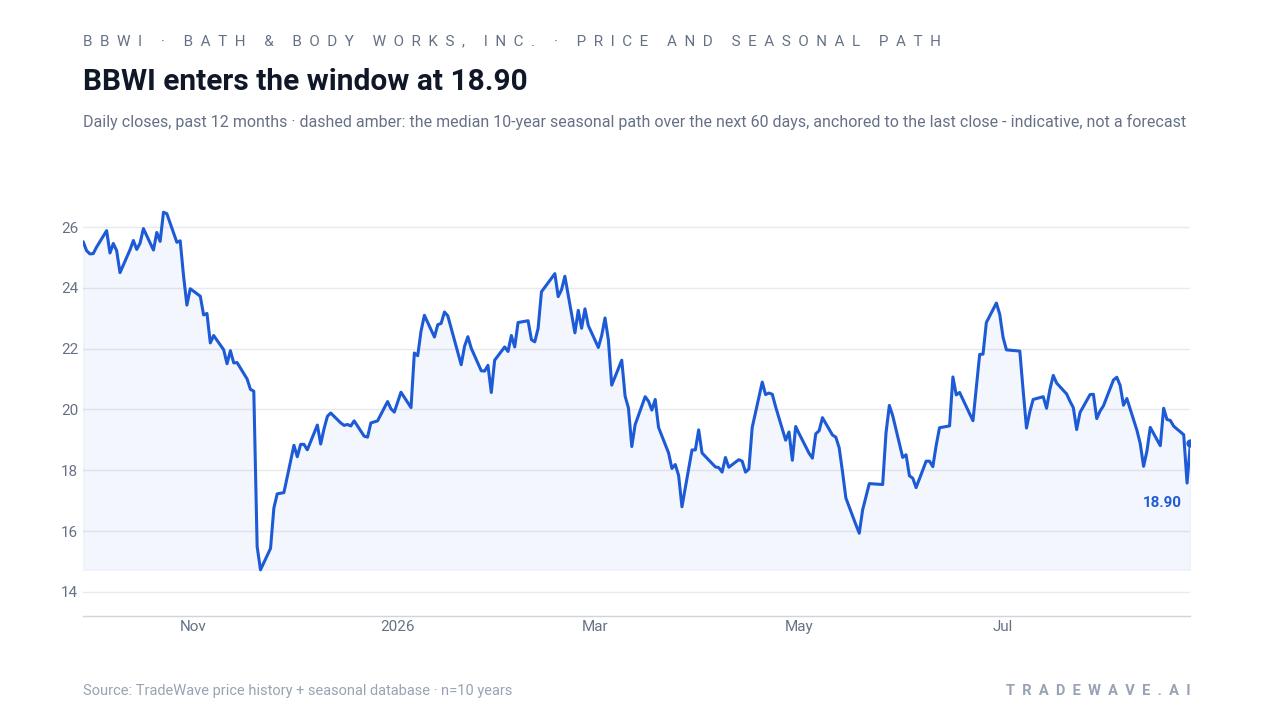
Overlaying the historical median path on the recent chart highlights the tension between a bruised share price and a historically strong autumn window. If BBWI continues to struggle despite a seasonal backdrop that has been 10 for 10 in prior midterm years, it would be a clear sign that current macro and company‑specific headwinds are overpowering the usual pattern. If, instead, the stock starts to firm into late September while options‑implied volatility remains elevated, traders may see that as confirmation that the familiar BBWI seasonal trend is reasserting itself.[3][4]
What should traders watch as this BBWI seasonal window approaches?
First, the calendar. The 61‑day window opens on Sep 27 and runs through Nov 26, overlapping the heart of the early holiday merchandising season and the final stretch of the midterm election year. Any guidance updates or demand commentary from management between now and then will shape how much investors are willing to lean into a pattern that has historically favored the long side.[3]
Second, price levels. On the downside, traders will be watching how BBWI behaves if it drifts back toward the mid‑teens zone that marked its 52‑week low. On the upside, the 50‑day moving average near 20.34 and the low‑20s band that capped rallies earlier this year are likely to be key checkpoints for whether the stock is starting to track its historical seasonality or simply chopping sideways.
Third, volatility and positioning. Options flow around earnings already showed the market pricing a roughly 10.69% swing into the Aug 28 expiration, and follow‑through in that activity will be important to monitor as the seasonal window nears.[4] If implied volatility stays bid and call buying builds into late September, it would suggest traders are positioning for a move that rhymes with the historical pattern; if volatility bleeds off and volume fades, it would argue for a more muted interpretation of the BBWI seasonal trend.
Finally, macro and policy signals. Because this pattern is specific to midterm election years, any shifts in the fiscal or regulatory outlook that affect consumer spending could either reinforce or blunt the usual behavior. Stronger consumer data or clearer policy guidance could help the stock lean into its 10‑for‑10 record, while renewed macro pressure on discretionary budgets would raise the odds that this midterm‑year window breaks from its historical script.[2][5]
Sources
- Public.com - BBWI Earnings: Latest Report, Earnings Call & Financials
- CNBC - Bath & Body Works (BBWI) Q3 2025 earnings
- The Motley Fool - BBWI Q2 2027 Earnings Call Transcript | The Motley Fool
- Barchart - Bath & Body Works Must Prove Body Care Has Stopped Bleeding or Admit the Turnaround Stalled
- Yahoo Finance - Bath & Body Works, Inc. (BBWI) Stock Price, News, Quote & History - Yahoo Finance
- ChartMill - Bath & Body Works (NYSE:BBWI): A Top Dividend Stock With a 3.79% Yield and Strong Financial Health
About this seasonal analysis
Seasonal pattern data is sourced from TradeWave.ai, which analyzes historical price behavior across annual calendar windows going back up to 30 years. Read the full data methodology or the book The 100-Year Pattern by Afshin Moshrefi (2026 edition). Past performance of seasonal patterns does not guarantee future results. This article is for informational purposes only and does not constitute investment advice.