Low-Vol Backdrop Leaves CBOE Volatility Index (VIX) Exposed to Another 129-Day Slide
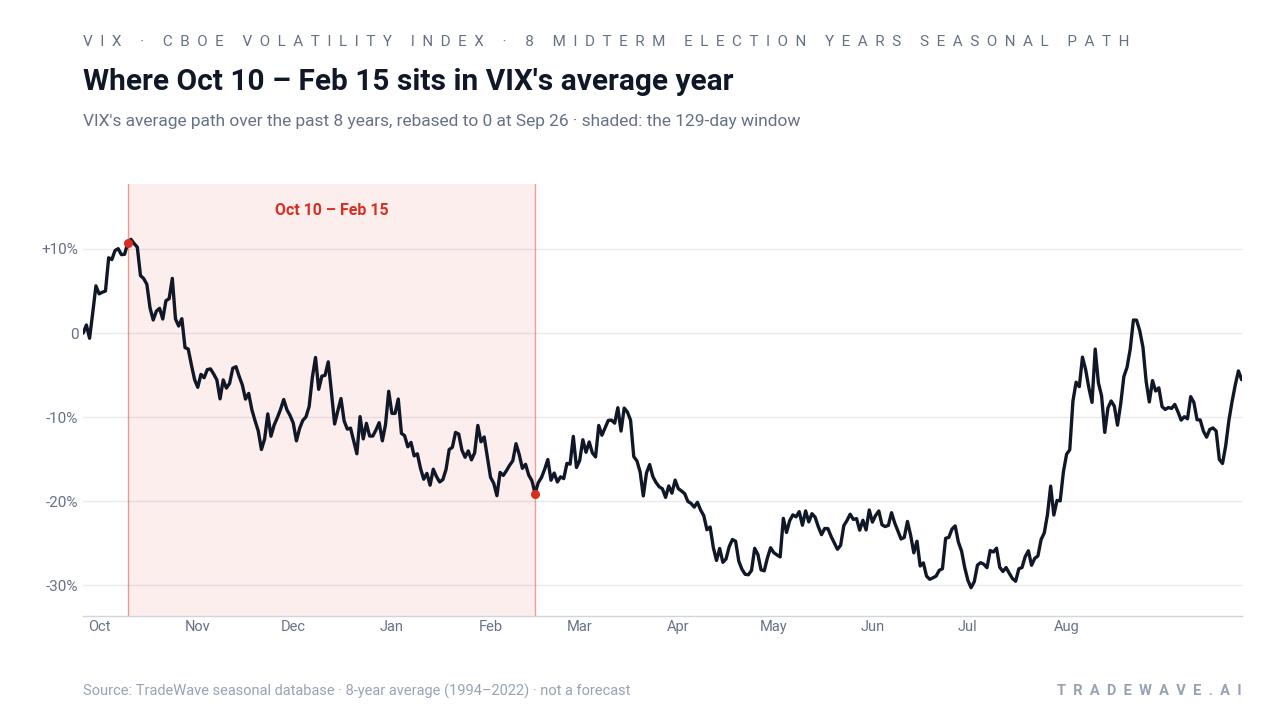
CBOE Volatility Index is back in the mid-teens as it heads toward an Oct 10–Feb 15 window that has historically seen implied volatility grind lower across midterm election years.
Price as of Sep 24, 2026: $15.67 (last close).

What is the seasonal pattern for CBOE Volatility Index (VIX)?
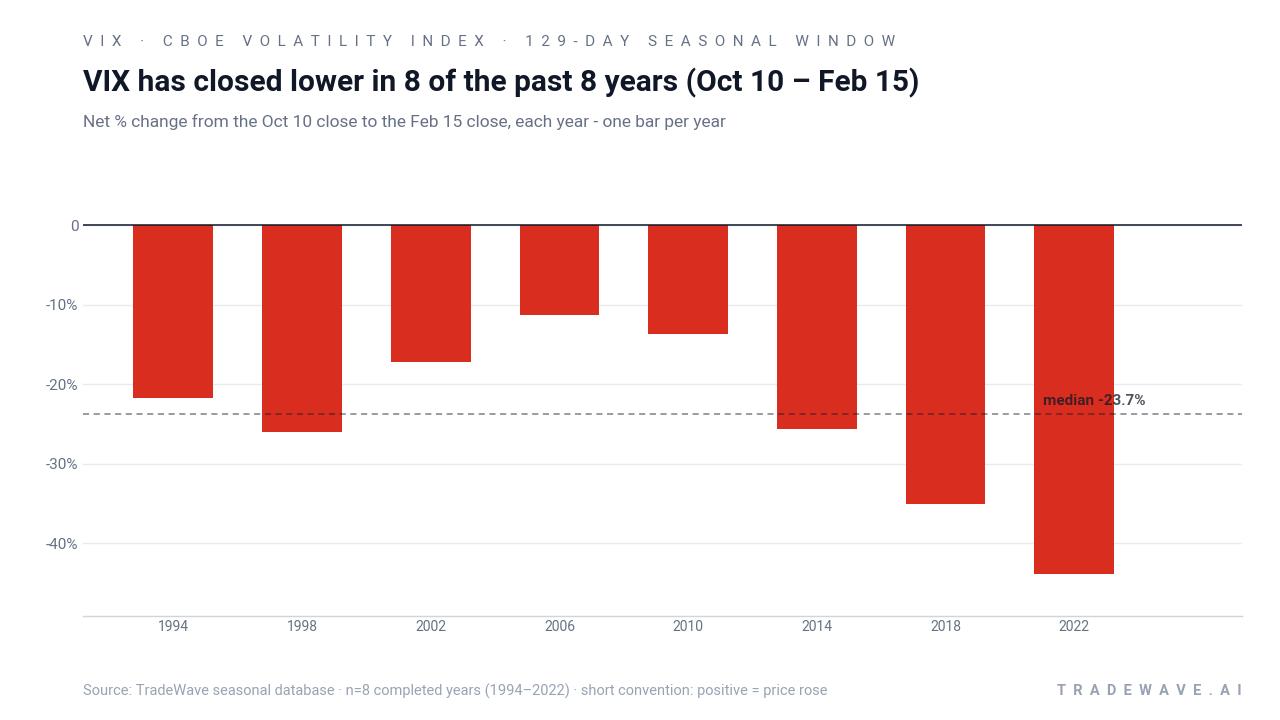
CBOE Volatility Index has fallen in 8 of 8 midterm election years during the Oct 10–Feb 15 window, with an average 24.29% gain for short positions in winning years.
- 8 for 8 in this window, with VIX finishing lower every midterm election year from 1994 to 2022 and short trades averaging 24.29% profit.
- The upcoming seasonal window runs from Oct 10 through Feb 15, spanning 129 calendar days in the late part of the midterm election year.
- Percent Profitable is 100.0%, with 8 winners and 0 losers for the short trade direction across the lookback sample.
- Average profit per winning year is 24.29%, with a median outcome of 23.67%, pointing to a consistently sizable volatility bleed in this stretch.
- The TradeWave Ratio (TWR) of 2.88 indicates VIX typically travels meaningfully in the short direction within the window, while the Sharpe ratio of 2.09 reflects strong risk‑adjusted returns for the pattern.
- Individual years still saw sharp intraperiod spikes in implied volatility before fading, so drawdowns against short positions have at times been large even in ultimately profitable windows.
According to historical data from TradeWave.ai, this midterm-year stretch has behaved very differently from an average winter for volatility, with a clear directional bias that many equity traders overlook.
How does CBOE Volatility Index (VIX) behave in the Oct 10–Feb 15 window?
CBOE Volatility Index has closed lower in every Oct 10–Feb 15 window across the last eight midterm election years, delivering a 24.29% average profit for short positions and compounding to 454.55% over the full sample. VIX ended the prior session at 15.67, up 3.2% on the day and sitting about 55.6% below its 52‑week high of 35.3 while still roughly 17.1% above its 52‑week low of 13.38. That combination of a statistically powerful seasonal drift lower and a starting point in the mid-teens gives equity traders a clean reference frame for how implied volatility has tended to behave as midterm years wrap up and pre‑election years begin.
The election-cycle framing matters here because this pattern is built only from midterm election years, a phase that often features heavy policy debate, shifting fiscal expectations and a handoff into the historically more risk‑on pre‑election year. In that context, the VIX seasonal trend suggests that once the typical autumn turbulence passes, implied volatility has tended to compress steadily through winter as investors gain more clarity on the policy path and earnings outlook.
Across the eight midterm-year samples from 1994 through 2022, the trade direction for this window is explicitly short: lower VIX levels by Feb 15 have been the favorable outcome. Percent Profitable sits at 100.0%, with 8 winners and 0 losers, and the median profit of 23.67% is close to the 24.29% average, which points to a tight cluster of outcomes rather than one outlier year doing all the work. Add it up and repeatedly shorting this 129‑day window would have compounded to a 454.55% cumulative gain across the sample.
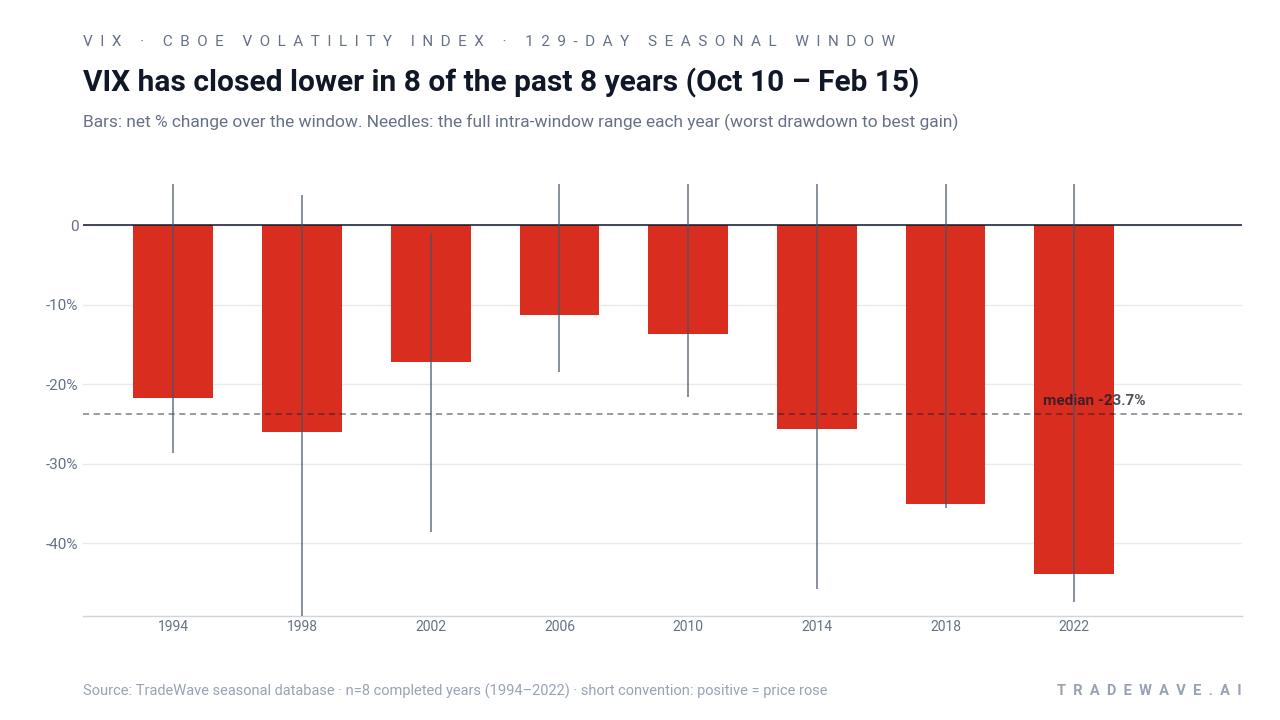
The per‑year table shows that even the “milder” years delivered double‑digit percentage declines in VIX from entry to exit. The smallest net move was a 11.28% drop in 2006, while the largest was a 43.82% slide in 2022 as volatility bled off from elevated levels. For a short VIX stance, those are all winning years, but the path was not smooth: in 2018, for example, the index’s best intraperiod rally reached 57.67% above the entry level before ultimately closing 35.06% lower, illustrating how sharp volatility spikes can still occur inside a seasonally bearish window.
The maximum favorable move, or best intraperiod excursion, has often been substantial even in years where the final net decline was moderate. That reflects the way VIX tends to overshoot during brief risk‑off episodes before mean‑reverting lower as equity markets stabilize. On the flip side, the maximum adverse move, or worst drawdown from entry, has at times been deep, with several years showing VIX trading 30% to nearly 50% below the starting point at some stage before rebounding, which would have pressured short positions that were not sized for that kind of swing.
A second view stacks each year’s net move with its full intraperiod range, highlighting how far VIX has swung before settling lower.
The TradeWave Ratio of 2.88 captures how far VIX has typically traveled in the short direction within the window, independent of the final close, and the Sharpe ratio of 2.09 indicates that those returns have come with relatively favorable risk‑adjusted characteristics. The cumulative chart for this pattern climbs steadily, with no major reversals, underscoring how consistently this midterm‑to‑pre‑election winter stretch has favored lower implied volatility. Nine for nine would be a cleaner headline, but eight for eight with this kind of magnitude is still a rare profile for any volatility index window.
History does not guarantee future results, and the intraperiod ranges show that adverse excursions can be large even in windows that ultimately finish as winners.
Why does CBOE Volatility Index (VIX) follow this seasonal pattern?
One likely driver is the way the U.S. policy and earnings calendar lines up in midterm election years. By October, most of the political uncertainty around congressional control is already priced, while companies are deep into budgeting and guidance for the coming pre‑election year, which has historically been supportive for equities. Analysts have also pointed to options positioning and year‑end portfolio rebalancing as forces that can dampen demand for downside protection into winter, encouraging implied volatility to drift lower even as occasional macro scares trigger short‑lived spikes.
What is driving CBOE Volatility Index (VIX) today?
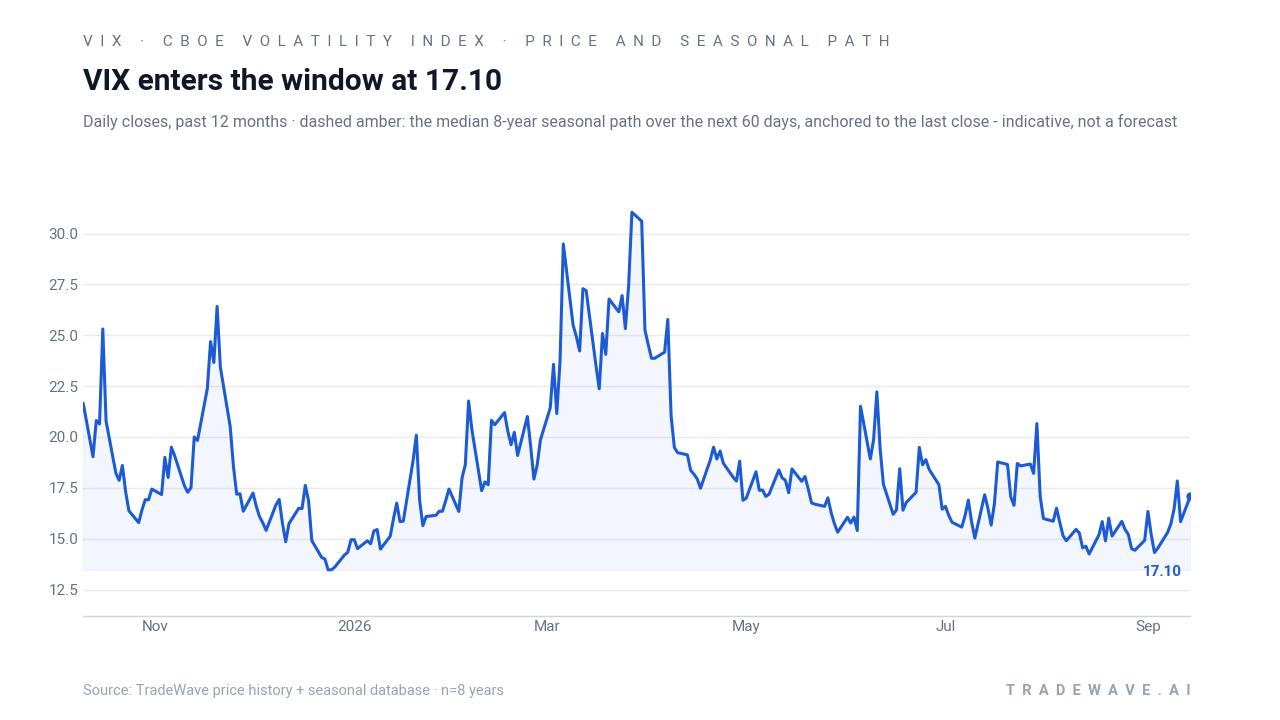
CBOE Volatility Index closed the prior session at 15.67, up 0.49 points or 3.2% on the day, after trading between 15.34 and 16.57. That leaves VIX well below its 52‑week high of 35.3 and still above the 13.38 low, consistent with a broader 2026 backdrop where index‑level volatility has often been subdued even as single‑stock swings remain elevated.[1] Cboe has highlighted a record disconnect between index and single‑stock volatility this year, with its VIXEQ index of S&P 500 constituents sitting near a one‑year high while the headline VIX stays calm, underscoring how dispersion trades and 0DTE options have changed how stress shows up in the surface.[1]
At the same time, VIX futures data show healthy activity across the curve, with listed volumes and settlements out through late‑2026 expiries, including contracts such as the Oct 21 VX/V6 and Nov 18 VX/X6.[1] That futures term structure provides a second lens on how traders are pricing forward volatility around the U.S. election cycle, Fed policy path and macro data, even when the spot index itself sits in the mid‑teens. In a year when VIX has already spiked to the low‑30s during stress episodes before sliding back toward 15, the index remains the primary reference point for sudden risk‑off moves despite ongoing debate about whether ultra‑short‑dated options have diluted its signaling power.[3]
The chart below places the latest move in the context of the past year and overlays the historical 60‑day seasonal path into the upcoming window.
What should traders watch as this VIX seasonal window approaches?
First, the calendar: the 129‑day window begins on Oct 10 and runs through Feb 15, covering the final weeks of the midterm election year and the opening stretch of the pre‑election year. That is when prior cycles have seen implied volatility grind lower, even as occasional macro or policy shocks triggered sharp but fleeting spikes. Traders will be watching whether VIX can stay anchored in the mid‑teens or lower into that start date, or whether another risk‑off episode pushes it back toward the high‑teens or low‑20s before the seasonal pattern historically kicks in.
Second, the policy and data calendar around that period will matter. Key catalysts include any shifts in Fed communication on rates and balance sheet policy, fiscal debates in Washington that could affect deficit trajectories, and the early stages of the 2027 earnings season, which will shape how much downside protection investors feel they need. If equities continue to climb on improving earnings breadth, the historical VIX seasonal trend toward lower implied volatility would be consistent with a calmer index‑level backdrop, even if single‑stock volatility remains elevated.
Third, the behavior of the VIX futures curve and listed volumes will be a live tell. The current term structure already shows active trading across expiries, and any sustained build‑up in volume or open interest around the winter contracts could signal that institutions are leaning into the seasonal pattern or hedging against a break from it.[1] A curve that stays in contango with modest risk premiums into year‑end would rhyme with prior midterm‑year patterns, while a persistent flattening or inversion would suggest the market is bracing for a different kind of winter.
Finally, the pattern itself will be tested in real time. If VIX spends much of the Oct 10–Feb 15 window grinding lower from the mid‑teens toward the low‑teens, with any spikes quickly faded, that would line up closely with the eight‑for‑eight historical record. A season where volatility spikes and stays elevated into February, by contrast, would mark a clear break from the midterm‑year script and could signal that the policy and macro mix in this cycle is overpowering the usual election‑cycle seasonality. For traders who care about timing their hedges, how VIX behaves inside this window will say a lot about whether the 100% historical hit rate still carries weight.
Sources
About this seasonal analysis
Seasonal pattern data is sourced from TradeWave.ai, which analyzes historical price behavior across annual calendar windows going back up to 30 years. Read the full data methodology or the book The 100-Year Pattern by Afshin Moshrefi (2026 edition). Past performance of seasonal patterns does not guarantee future results. This article is for informational purposes only and does not constitute investment advice.