After a 16% Monthly Slide, NVR, Inc. (NVR) Confronts a Historically Weak 207-Day Window
NVR, Inc. is rallying off recent lows even as a 207-day midterm-election-year stretch that has historically delivered consistent downside for the stock is already in play.

Key takeaways
- A 207-day midterm-election-year window that began Mar 18 has seen NVR, Inc. fall in all 9 prior cycles, aligning with a short trade direction.
- Across those midterm years, the pattern shows 100% Percent Profitable for shorts, with 9 winners and 0 losers and an average profit of 16.48%.
- The TradeWave Ratio of 1.56 signals that NVR has typically moved meaningfully in the trade direction within the window, not just at the close.
- Intraperiod swings have been large, with historical best and worst excursions showing that rallies and sharp drawdowns can both appear before the final outcome.
- NVR closed Monday at 6,528.02, up 2.5% on the day but still about 24.3% below its 52-week high, after a roughly 16% slide over the past month.
- Traders watching this window are balancing a strong historical midterm-year downside pattern against a stock that has already corrected hard from last year’s peak.
According to historical data from TradeWave.ai, this specific midterm-election-year stretch in NVR has behaved very differently from an average calendar period, and the current window is already underway.
Seasonal window
NVR, Inc. has declined in all 9 midterm-election-year windows since 1994 during this 207-day stretch, with shorts averaging a 16.48% gain. The latest iteration of that window began on Mar 18 and finds the stock at 6,528.02, up 2.5% Monday but still about 24.3% below its 52-week high after a steep one-month drop of 15.98%.
The pattern groups NVR’s behavior by the presidential election cycle, focusing on the midterm election year rather than consecutive calendar years. That matters for a homebuilder because policy, rates and fiscal priorities often shift in the middle of a presidential term, changing the backdrop for housing demand and construction margins in ways that repeat from cycle to cycle more than from year to year.
In this window, the trade direction is short, and every one of the last 9 midterm-election-year samples has been a winning outcome for that stance. Percent Profitable sits at 100%, with 9 winners and 0 losers, and the average profit across those shorts is 16.48%, with a median outcome of 16.2%. The cumulative return across all nine windows is 278%, and the annualized return for the pattern is 15.94%, paired with a Sharpe ratio of 1.2 that reflects solid risk-adjusted performance for the strategy over the sample.
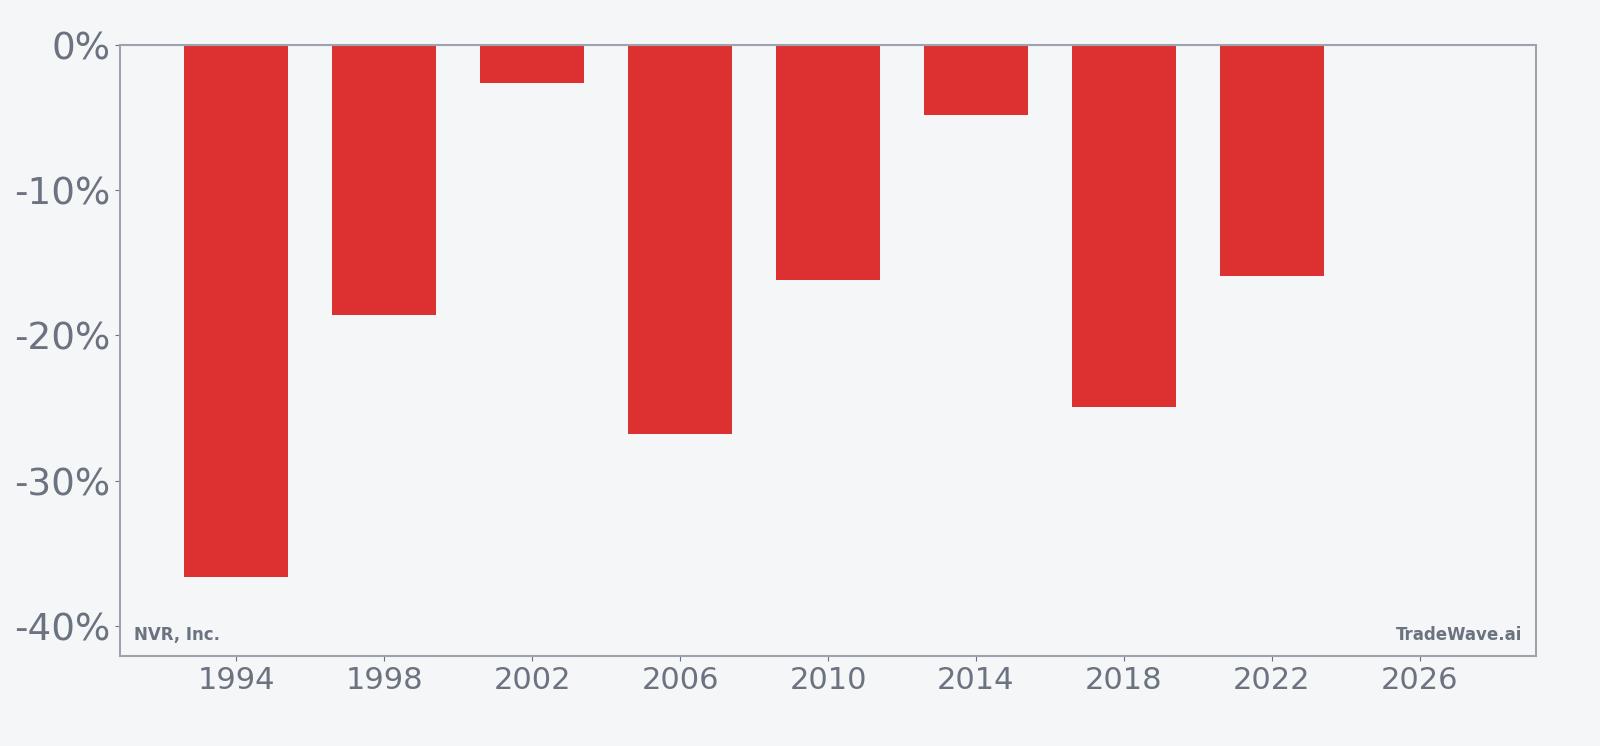
The per-year table shows how that downside has played out in practice. The strongest year for shorts was 1994, when NVR fell 36.62% from an entry around 8.88 to an exit near 5.63, while 2002 was the mildest outcome with a 2.63% decline from roughly 285 to 277.50. More recent midterm years such as 2018 and 2022 still lined up with the pattern, delivering net returns of -24.91% and -15.95% respectively for the short side over the same 207-day span.
Intraperiod swings have been anything but smooth. Maximum favorable excursion, the best point-to-peak move in the trade direction, has ranged from modest single-digit gains in years like 2010 and 2014 to a 45.99% move in 1998, showing that some windows offered shorts a deep cushion before any rebound. Maximum adverse excursion, the worst drawdown from entry, has also been large in several cycles, including a 49.47% squeeze against shorts in 2006 and a 42.25% adverse move in 1994, underscoring that rallies inside the window can be violent even when the final outcome favors the short.
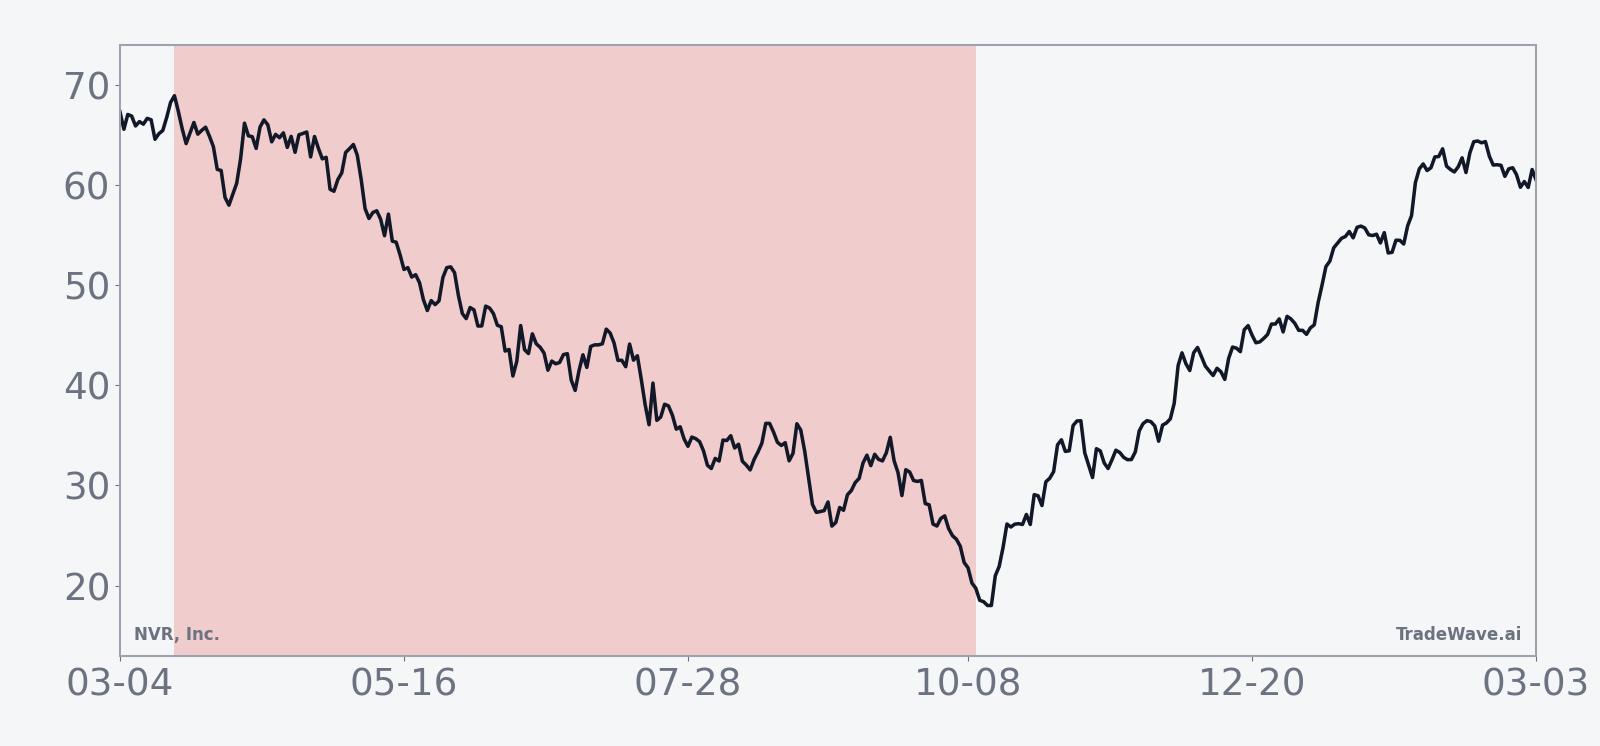
The historical seasonal trend line slopes lower for most of the window, with the bulk of the downside accruing gradually rather than in a single air pocket. The average path suggests that weakness has tended to build over months, with intermittent countertrend rallies that have not fully erased the broader drift lower by the end of the period.
A stacked view of net returns alongside best and worst intraperiod moves shows how much room there has been for both squeezes and follow-through.
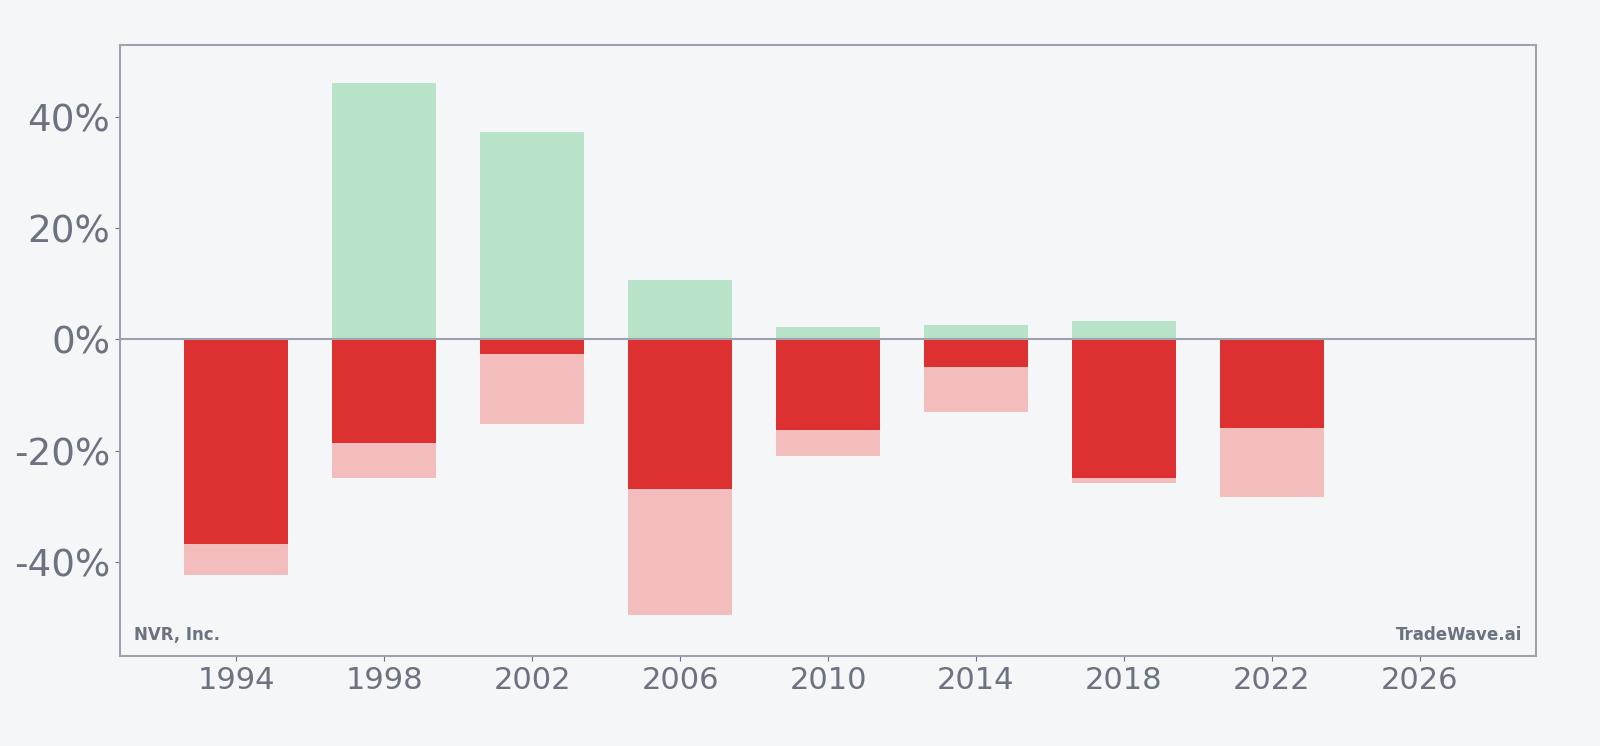
The bars with maximum favorable and adverse excursions make the volatility profile clear: even in years where shorts ultimately finished comfortably ahead, the stock often staged double-digit rallies against the position before rolling over. Add it up: 9 for 9 winning short windows, meaningful average downside and a TradeWave Ratio of 1.56 that points to sizable travel in the trade direction inside the window, but with enough intraperiod noise that timing and risk controls have historically mattered as much as direction.
History does not guarantee future results, and the worst intraperiod drawdowns in this window have been large even in years that ultimately finished as winners for the short side.
Price and near-term drivers
NVR closed Monday at 6,528.02, up 158.64 points or 2.49% on the day, after trading between 6,456.27 and 6,587.84 on volume of 17,168 shares. That bounce comes after a rough stretch: the stock is down 15.98% over the past month and sits well below its 50-day moving average of 7,398.98, and about 24.3% under its 52-week high of 8,618.28 while hovering only slightly above its 52-week low of 6,301.02.
The chart below situates the latest move in its recent multi-month context, alongside a 60-day seasonal projection.
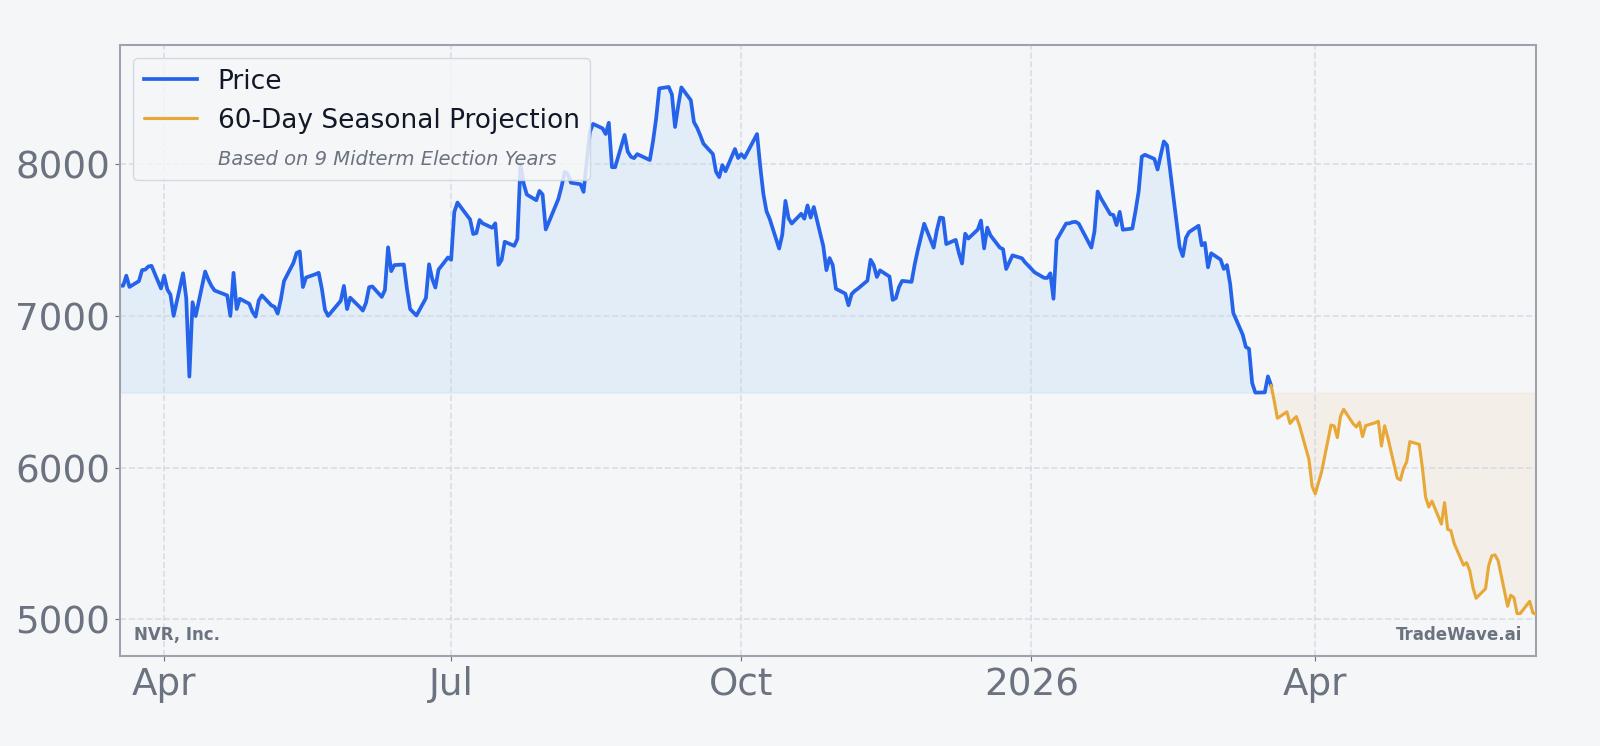
The recent slide has pulled NVR back toward levels last seen months ago, compressing valuation and resetting expectations after a strong prior run. With average 20-day volume around 23,714 shares, Monday’s turnover was slightly lighter than usual, suggesting the rebound was more about a pause in selling than a surge of new buyers. In that context, the fact that the stock is entering a midterm-year window that has historically favored shorts adds a layer of calendar-driven risk to a name already working through a sizable correction.
For traders and longer-term investors alike, the tension is straightforward. On one side is a stock that has already given back a chunk of its prior gains and could be approaching levels where fundamental buyers become more interested. On the other is a midterm-election-year pattern that has repeatedly seen NVR grind lower over this same 207-day stretch, often with sharp countertrend rallies along the way. How the stock behaves in the coming weeks relative to its 50-day moving average and the lower end of its 12-month range will help show whether this cycle tracks the historical script or breaks it.