Graphic Packaging (GPK) Has Rallied in 8 of 8 Midterm Windows Starting Apr. 8
Graphic Packaging is slumping toward its 52-week low just as a historically strong 13-day midterm-election seasonal window approaches in early April.

Key takeaways
- A 13-day seasonal window for Graphic Packaging tied to midterm election years begins on Apr. 8.
- Across the last 8 midterm-election cycles, this window has been profitable in 100% of cases, with 8 winners and 0 losers.
- Average gain in those winning years was 4.56%, with a 42% cumulative return and a Sharpe ratio of 1.4.
- The pattern is long-biased, with a Trade Direction of “long” and a TradeWave Ratio of 1.34, pointing to meaningful intraperiod moves.
- Maximum favorable moves have reached nearly 20% in the strongest year, while adverse excursions have at times approached 5% on the downside.
- GPK is trading about 65.1% below its 52-week high and just above its 52-week low, setting up a sharp contrast between current weakness and the historically strong window.
According to historical data from TradeWave.ai, this upcoming stretch has behaved very differently from an average month on the calendar for Graphic Packaging. The next section walks through what that election-cycle pattern has looked like in prior midterm years.
Seasonal window
Graphic Packaging has risen in all 8 midterm-election-year windows that start on Apr. 8 and run for 13 trading days, averaging 4.56% gains. Today the stock closed at 8.91, down 4.8% on the session and sitting about 65.1% below its 52-week high of 25.49 while hovering just above its 52-week low of 8.79.
This seasonal window begins on Apr. 8 and spans 13 days. The pattern groups the last 8 midterm election years, a phase when policy debates, spending priorities and regulatory noise often look very different from the presidential election year or the year after. For a packaging name tied to consumer and industrial volumes, that mid-cycle backdrop can matter for sentiment even over short stretches.
Historically, the trade direction for this setup has been long. All 8 years in the sample finished higher over the 13-day window, which translates to a Percent Profitable of 100% with 8 winners and 0 losers. Average profit across those winners was 4.56%, and the cumulative return across the sample was 42%, which is unusually strong for such a short holding period.
The Sharpe ratio for the window sits at 1.4, which is high for a two-and-a-half-week trade and signals that the average outcome has been favorable relative to the volatility of end-of-window returns. The TradeWave Ratio is 1.34, and by definition the TradeWave Ratio (TWR) reflects how far price typically travels in the trade direction within the window regardless of the final close. In plain English, GPK has tended to move meaningfully in the long direction during this slice of the calendar.
Looking at individual years, the strongest midterm window came in 2002, when GPK gained 10.88% over the 13 days, with a maximum favorable move of 19.74% from the entry price before settling back. The softest outcome was 2014, which still finished positive at 1.0% but saw a maximum adverse move of 4.81% at one point during the window, reminding traders that even “all green” samples can involve uncomfortable drawdowns.
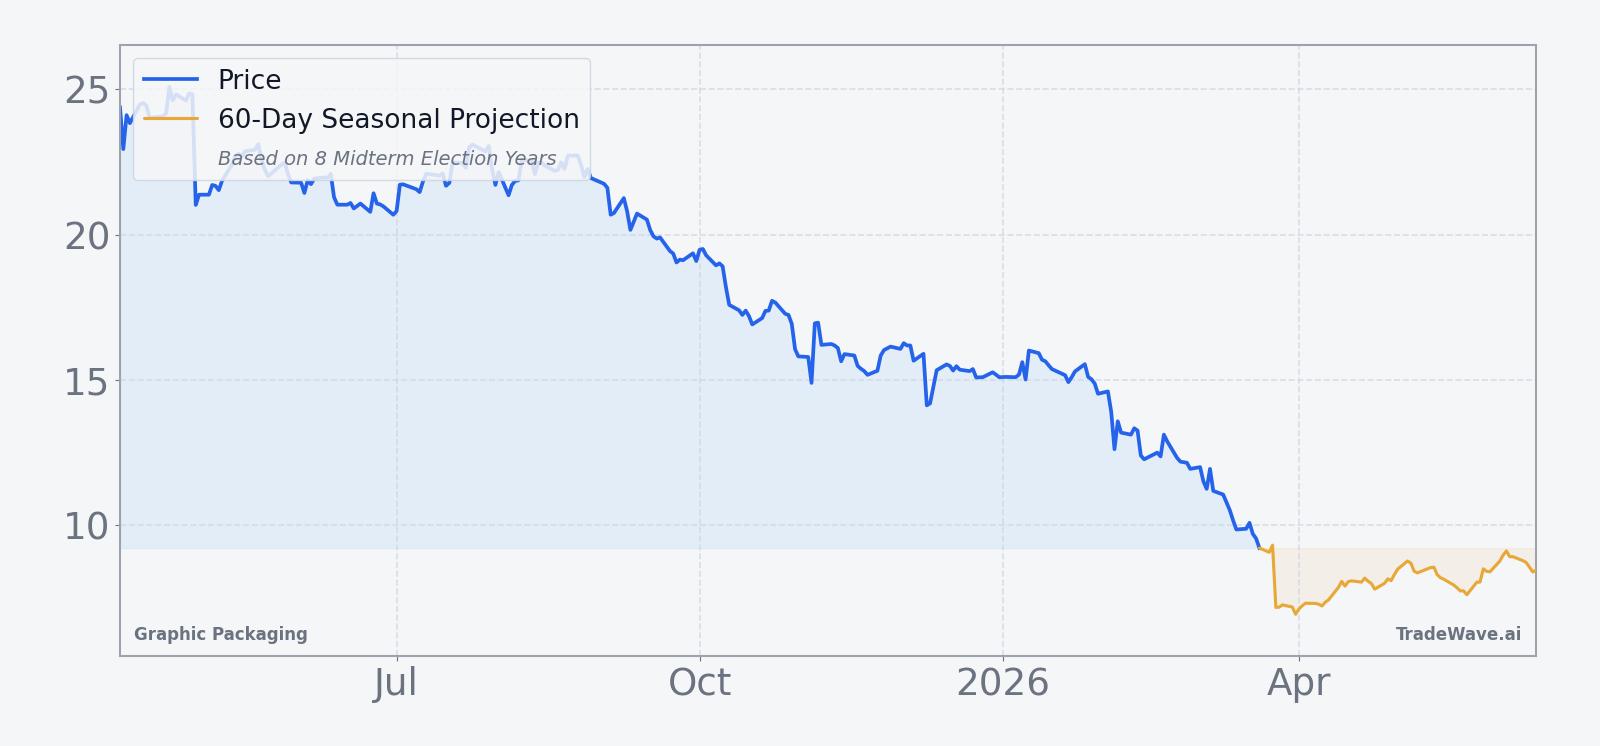
The historical seasonal trend chart for this window shows a fairly steady upward slope rather than a single spike. Gains have tended to build gradually across the 13 days, with only modest giveback late in the window in a few years. That profile suggests a bias toward persistent buying rather than one-off gap moves.
Year-by-year bars that combine net results with best and worst intraperiod moves show how upside and downside have coexisted inside this otherwise consistent pattern.
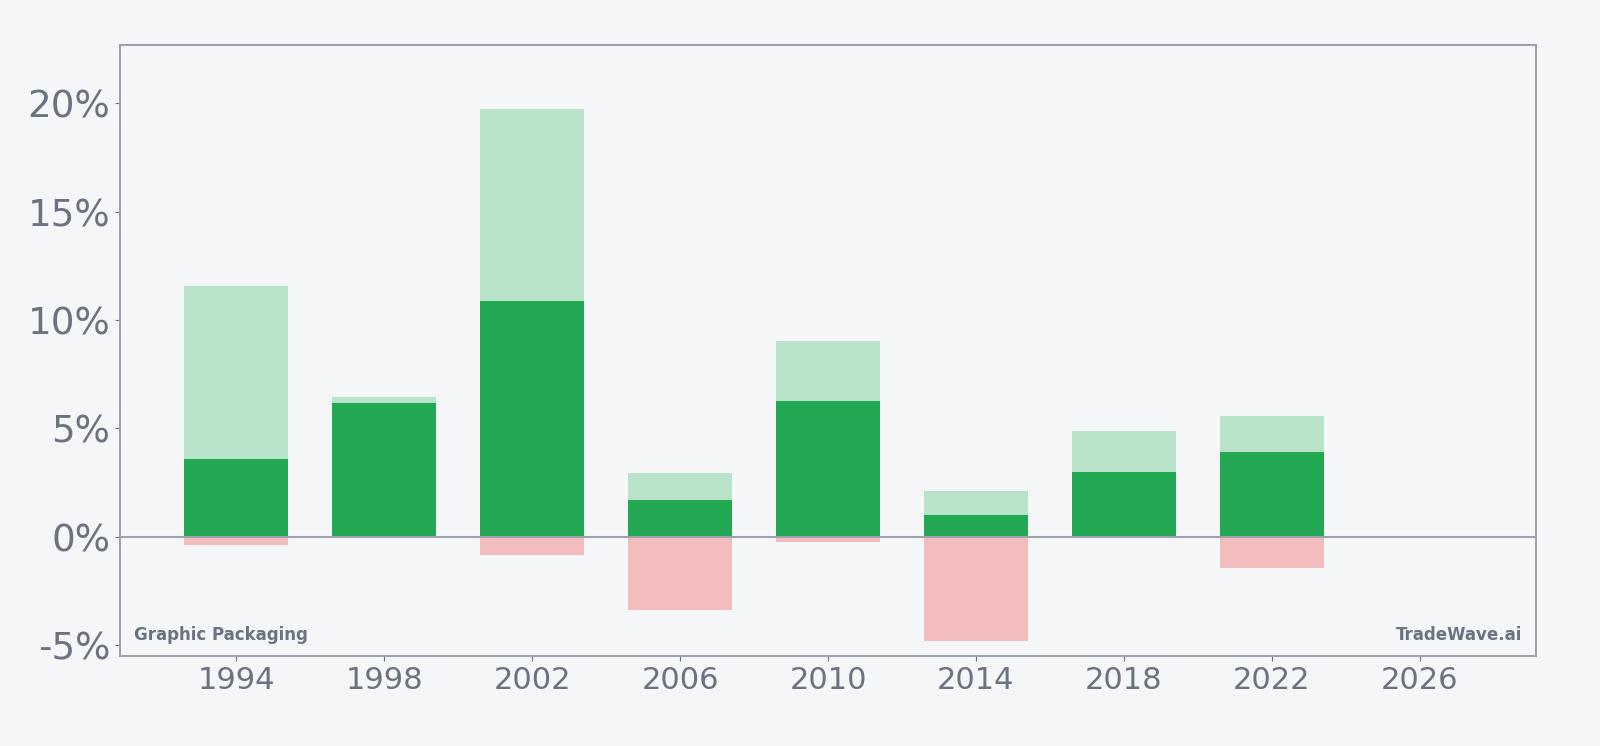
History does not guarantee future results, and even in winning years the worst intraperiod drawdown (MAE) has at times been sizable.
Add it up: 8 for 8 winning midterm windows, mid-single-digit average gains and some double-digit intraperiod rallies make this one of the more striking short seasonal patterns on GPK’s calendar.
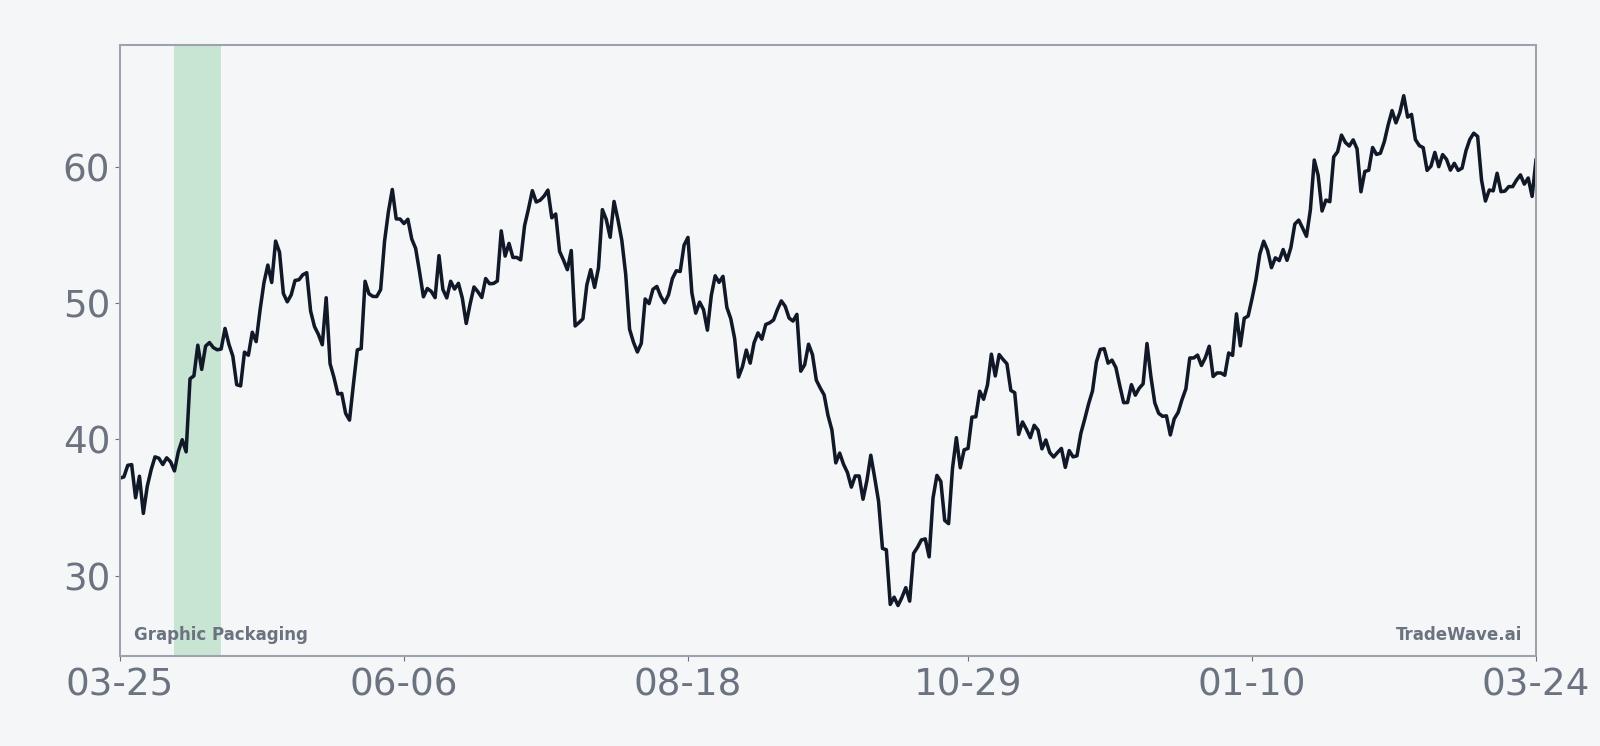
Price and near-term drivers
Graphic Packaging shares closed at 8.91 on Monday, down 0.45 on the day for a 4.8% slide that leaves the stock just above its 52-week low of 8.79 and far below the 52-week high of 25.49. The one-month return sits at a steep negative 28.83%, and price is trading well under the 50-day moving average of 12.84 on heavy volume of about 26.4 million shares versus a 20-day average near 8.0 million, underscoring how sharp the recent breakdown has been.
That weakness comes after a stretch of fundamentally solid but not flawless execution. In Nov. 2025, Graphic Packaging reported Q3 2025 results that beat on revenue and EPS but came with trimmed guidance, including full-year net sales expectations of $8.4 billion to $8.6 billion and adjusted EBITDA of $1.38 billion to $1.43 billion.[1] Management also projected adjusted EPS of $1.75 to $1.95 and pointed to a 2026 free cash flow target of $700 million to $800 million, signaling confidence in the medium-term cash story even as near-term margins felt pressure.[1]
On Dec. 8, 2025, the company followed up with a cost and production optimization plan aimed at shoring up those margins and supporting the 2026 free cash flow goal.[1] The initiatives focus on efficiency and capacity alignment, a familiar playbook across packaging and broader industrial names when input costs and pricing power wobble. For equity traders, the question is how much of that margin work is already reflected in a stock that has been more than cut in half from its 52-week high.
The chart below situates the latest move in its recent multi-month context and overlays the next 60 days of seasonal projection.
Macro and election-cycle backdrop
The seasonal pattern for GPK in this analysis is tied specifically to midterm election years, which sit in the middle of the four-year presidential cycle. That phase often brings a mix of policy uncertainty, budget wrangling and regulatory noise that can weigh on cyclicals early in the year before giving way to more constructive risk appetite as the policy path clarifies. For a packaging supplier exposed to consumer goods, food and industrial end markets, those shifts in macro tone can influence order visibility and investor positioning even over short windows.
In the current calendar, markets are in the midterm election year itself, with the Apr. 8 window landing in the early part of that year. Historically, early- to mid-year midterm stretches have been choppier for many cyclicals, while later midterm and pre-election periods have skewed more supportive for risk assets. The fact that GPK’s strongest short seasonal window in this phase clusters in early April is a reminder that not all midterm-year volatility is negative; some pockets have repeatedly favored long exposure in specific names.
What to watch as the window opens
With GPK trading near its 52-week low and the 13-day midterm window set to begin on Apr. 8, the first thing to watch is whether price can stabilize above the recent low around 8.79 or whether sellers push through that level before the window even starts. A firming base or a quick reclaim of the 10 level during the window would rhyme with the historical pattern of steady gains, while continued heavy-volume selling would mark a clear break from prior cycles.
Second, monitor how intraday swings line up with the historical maximum favorable and adverse excursions. In prior midterm years, the best runs have seen double-digit peak gains inside the window, but the worst drawdowns have still approached 5% in some cases. If this year’s window features sharp upside spikes with relatively contained pullbacks, it would look similar to the stronger historical episodes. If instead the stock whipsaws with deep intraday or multi-day drawdowns, that would signal a higher-risk interpretation of the same seasonal backdrop.
Third, keep an eye on how the company’s cost and production optimization narrative is received as the policy calendar heats up into the heart of the midterm year.[1] Any updates on progress toward the 2026 free cash flow target, or signs that margin pressures are easing or worsening, could either reinforce or overwhelm the historical seasonal tendency. A constructive read-through on costs during the window would align with the long-biased pattern, while fresh concerns on pricing or volumes could blunt it.
Finally, watch sector peers in packaging and broader industrials for confirmation. If the seasonal window opens with a broader bid into cyclicals, GPK’s historical 8-for-8 record in this slice of the calendar will look less like an isolated quirk and more like a name-specific amplification of a midterm-year risk-on pocket. If peers stay weak while GPK alone tries to bounce, traders may treat any strength as more tactical and less anchored in a durable shift in macro tone.