Geopolitical Tensions and Higher Crude Push Devon Energy (DVN) Into a Strong Spring Run
Devon Energy is stepping into a historically strong 42-day midterm-year stretch just as shares trade near a 52-week high and investors digest its Coterra merger and a powerful recent run.

Key takeaways
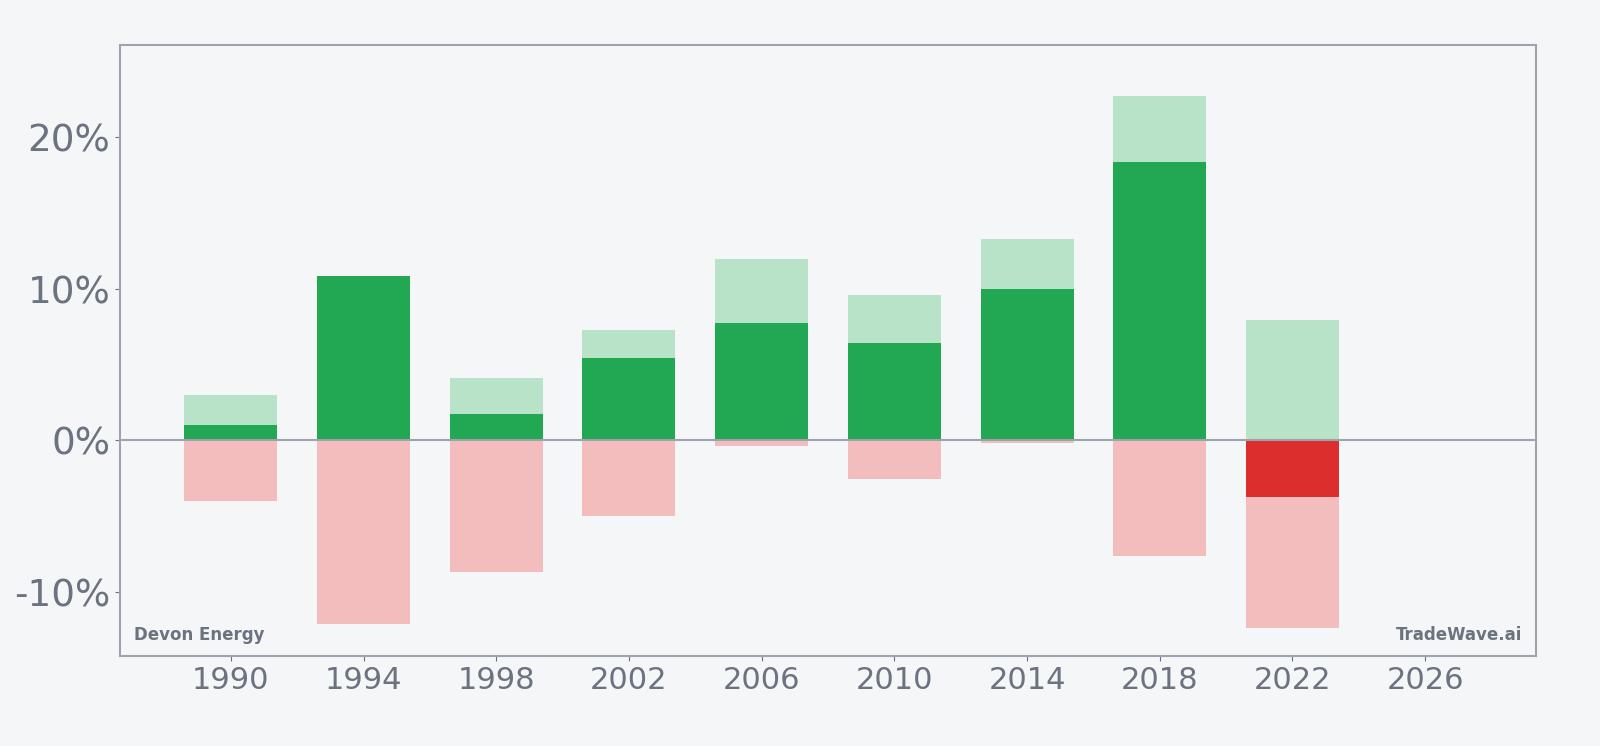
- Devon Energy has risen in 8 of the last 9 midterm-year spring windows starting Mar 22, a historically bullish seasonal pattern for long exposure.
- The 42-day window runs from Mar 22 through early May and has delivered an average gain of 7.7% in winning years, with a 6% average when all years are included.
- Percent Profitable stands at 89%, with 8 winners and 1 loser across the last nine midterm election years in this slice of the calendar.
- Intraperiod swings have been meaningful, with some years showing double-digit peak run-ups and others seeing adverse moves larger than the final loss.
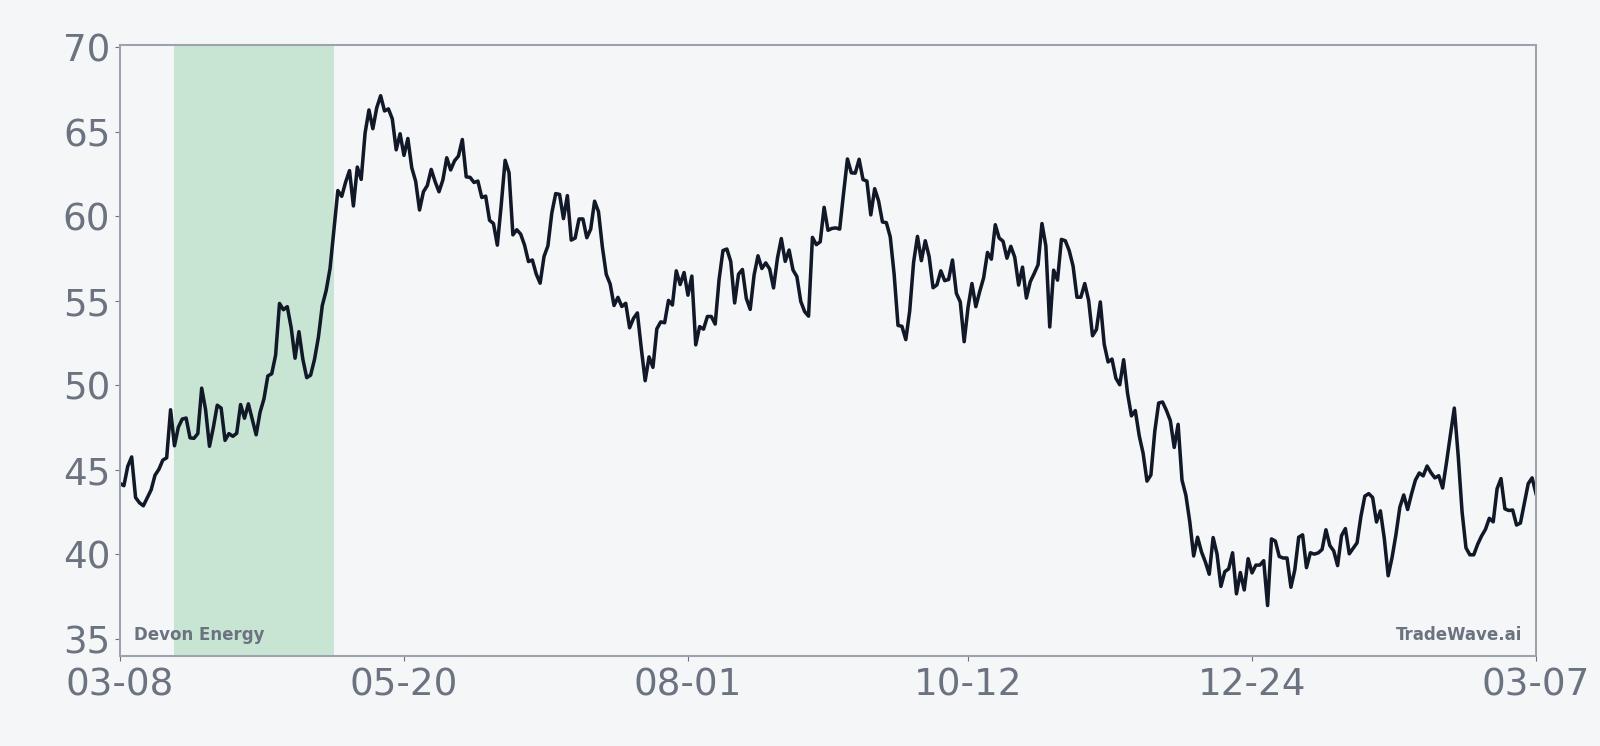
- DVN closed at 48.66 on Friday, about 2.4% above its 52-week high and nearly double its 52-week low, after a 5-day, 8.5% winning streak tied to stronger crude prices.[2]
- The Coterra merger and a buy rating from JP Morgan frame a constructive fundamental backdrop as this historically strong seasonal window opens.[1][3][4][12][14]
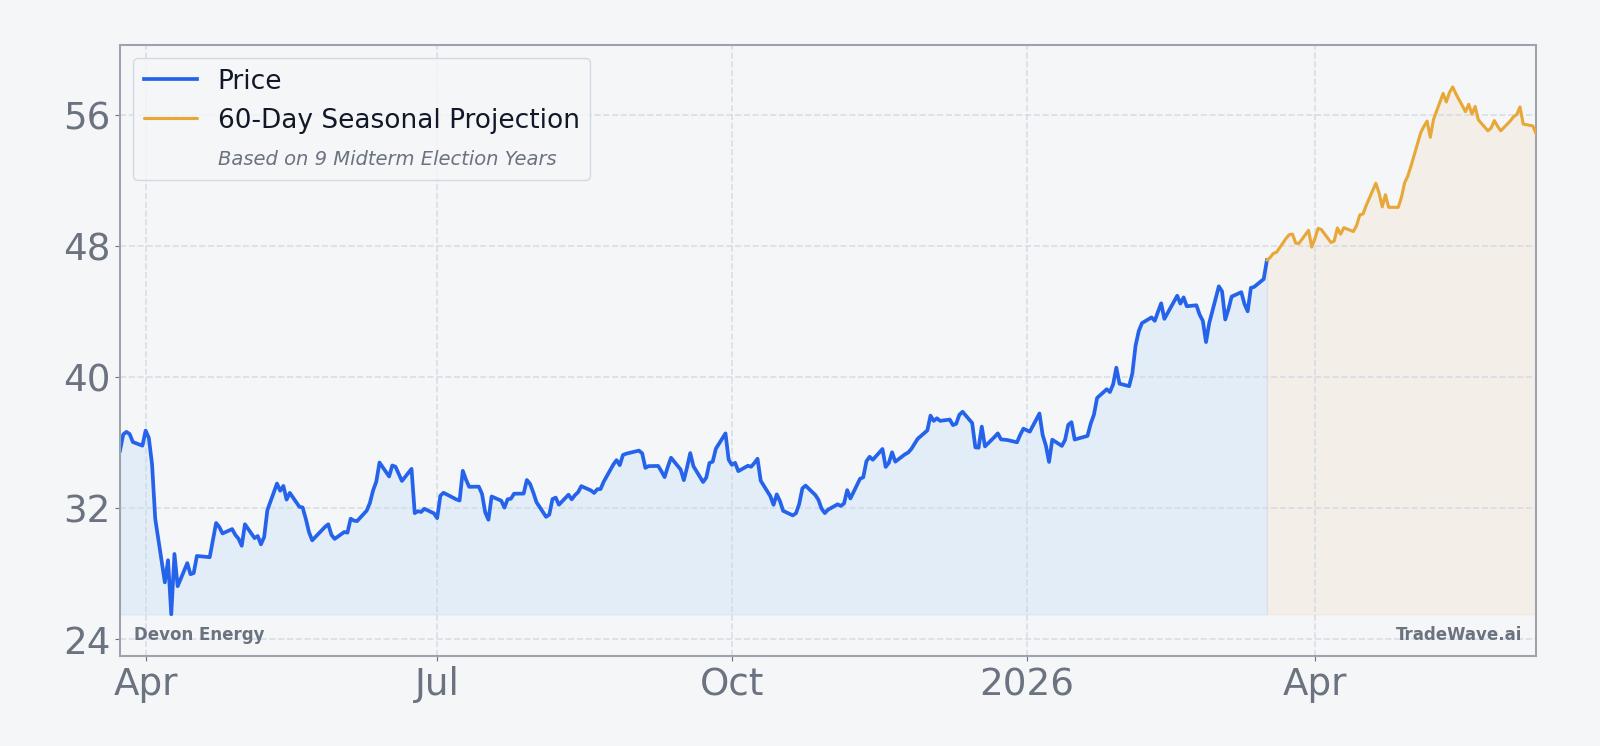
According to historical data from TradeWave.ai, this part of the calendar has behaved very differently for Devon Energy in past midterm election years, and the next 42 days carry a distinct seasonal profile that most traders never see on a standard chart.
Seasonal window
Devon Energy has posted gains in 8 of the last 9 midterm election years during the 42 trading days starting Mar 22, averaging 7.7% in those winning windows. The stock heads into this stretch at 48.66, about 2.4% above its 52-week high of 47.50 and far above its 52-week low near 24.86, after a strong one-month run of 7.67%.
Grouping the data by the presidential election cycle matters here because energy policy, regulation and federal drilling decisions often move in multi-year waves that line up with Washington’s calendar. This pattern looks only at the last nine midterm election years, which means it is comparing Devon’s behavior in similar policy phases rather than across random calendar years.
This seasonal window begins on Mar 22 and spans 42 trading days. Historically, during this period in midterm election years, Devon Energy has shown a strong upside tendency for long positions rather than a mixed or choppy profile.
The trade direction for this pattern is long, and the historical record has favored that stance. Percent Profitable is 89%, with 8 winners and just 1 loser across the nine midterm-year samples, so most iterations have rewarded staying on the long side of the tape.
Average winner gains of 7.7% contrast with the 6% Avg Profit - All, which folds in the single losing year and shows that down windows have been meaningful but not enough to erase the broader upside bias. Avg Loss in the lone negative year was -3.76%, so the downside outcome in that case was modest compared with the best years.
The per-year history shows how wide the range can be. The strongest midterm-year run in this window came in 2018, when DVN gained 18.4% from entry to exit, with a maximum favorable move of 22.7% before giving back some ground. The weakest outcome was 2022, which finished down 3.76% even though the stock at one point was up 7.95% before a maximum adverse move of -12.39% from the entry level.
Those intraperiod swings are captured by what seasonal analysts call maximum favorable excursion and maximum adverse excursion, the best run-up and worst drawdown from the entry price during the window. In several years, Devon’s maximum favorable move has pushed into double digits while the worst drawdown stayed relatively contained, but 1994 and 2022 show that adverse moves larger than -12% have also appeared inside otherwise constructive environments.
The historical seasonal trend chart for this window slopes higher through most of the 42 days, with gains tending to build gradually rather than in a single spike. The typical pattern shows a firmer tone in the middle of the window, with some years front-loading strength and others seeing more of the move closer to the end.
The cumulative return profile across all nine midterm-year samples adds up to a 72% total gain for this specific window, which lines up with an annualized return of 6.25% and a Sharpe ratio of 0.93 based on end-of-window outcomes. That Sharpe ratio reflects a favorable risk-adjusted profile for this slice of the calendar compared with many short-term trading windows.
TradeWave Ratio (TWR) for this pattern is 1.65, which means price has typically traveled a meaningful distance in the trade direction within the window, independent of where it finished. For traders, that speaks to opportunity but also to the need for risk management when intraperiod swings can be larger than the final net result.
The next chart stacks each year’s net result alongside its best run-up and worst drawdown to show how those swings have played out.
History does not guarantee future results; adverse excursions can be large even in winning windows, so position sizing and risk controls remain critical.
Price and near-term drivers
Devon Energy closed Friday at 48.66, down 0.27% on the day, after trading between 48.42 and 49.67 on volume of about 55.7 million shares. That leaves the stock about 2.4% above its 52-week high of 47.50 and roughly 95.7% above its 52-week low near 24.86, with a one-month gain of 7.67% and the 50-day moving average back at 41.55, underscoring how sharp the recent move has been.
Part of that strength has come from a 5-day winning streak that lifted DVN by 8.5% and pushed its market value to roughly $30 billion as crude prices climbed and investors rotated back into U.S. shale names.[2] Energy bulls have been drawn to Devon’s leverage to higher oil and gas prices and its capital-return framework, which has combined a fixed base dividend with buybacks and variable payouts in stronger commodity tapes.[2]
The macro backdrop has also shifted in Devon’s favor. Rising geopolitical tensions and firmer crude benchmarks have revived interest in U.S. shale producers, with Devon often cited as a liquid way to express that view.[2] In this environment, the stock’s move to fresh highs stands out against a broader market that has been more selective about rewarding cyclical exposure.
On the corporate side, Devon’s all-stock merger with Coterra Energy, announced Feb 2, 2026, will create one of the largest U.S. shale producers with a dominant position in the Permian Basin and added scale in other key basins.[3][4][11][12][14] The combined company is expected to benefit from cost synergies, a deeper drilling inventory and more stable free cash flow, which could support continued shareholder returns once integration is underway.[3][4][12][14]
Earlier, Devon had already been working through a $1 billion business optimization plan, achieving about 60% of that goal in under a year and pointing to further efficiency gains and free cash flow improvements.[1] JP Morgan upgraded the stock to buy in December, citing valuation support and the potential for that optimization work to translate into stronger cash generation over time.[1]
In Q3 2025, Devon returned $401 million to shareholders through a mix of share repurchases and a fixed quarterly dividend of $0.24 per share, reinforcing its capital-return story even before the Coterra deal was announced.[1] For investors watching the seasonal window, that combination of structural consolidation, cost work and shareholder payouts provides a fundamental backdrop that lines up with the historically constructive midterm-year pattern.
The chart below situates the latest breakout against the past year’s trading range and overlays the 60-day seasonal projection.
Macro, policy and the election cycle
The current calendar phase is the midterm election year, which often brings a different policy tone for energy than the presidential election year or the year after. Regulatory focus can shift toward consumer prices and gasoline costs, while Congress debates spending and infrastructure priorities that affect drilling, pipelines and export capacity.
For a producer like Devon, that means the midterm year can blend commodity-driven tailwinds with headline risk around regulation and permitting. The historical pattern for this 42-day window suggests that, in prior midterm years, the market has tended to look through some of that noise and reward Devon’s operational leverage to stronger crude prices.
At the same time, the broader presidential cycle context matters because this midterm-year window sits ahead of the pre-election year, which has often been friendlier to risk assets as policy uncertainty clears. If that playbook repeats, the current seasonal window could act as an early test of how investors want to position in energy heading into the next phase of the cycle.
What to watch in this window
For traders tracking this 42-day stretch, the first thing to watch is whether DVN can hold above the 47 to 48 zone that roughly corresponds to its prior 52-week high and recent breakout area. Sustained trading above that band would be consistent with the historical pattern of gains building through the middle of the window, while a quick break back below would look more like the choppier 2022 template.
Second, crude prices and geopolitical headlines remain central. The recent 5-day, 8.5% surge in DVN came alongside firmer oil, and a reversal in the commodity tape could quickly test how much of the seasonal edge is already priced in.[2] If crude continues to grind higher or even just stays firm, it would support the idea that this midterm-year window can again skew positive for Devon.
Third, integration updates and commentary around the Coterra merger will matter for how investors handicap Devon’s free cash flow and capital-return capacity.[3][4][11][12][14] Any signs that cost synergies are tracking ahead of plan or that the combined drilling inventory is deeper than expected could reinforce the bullish seasonal backdrop, while delays or integration hiccups would cut the other way.
Finally, watch how DVN trades on down days for the broader market. In prior strong years for this window, the stock has often shown relative resilience during pullbacks, with intraperiod drawdowns that were smaller than the eventual peak run-ups. If that pattern repeats, it would be a sign that seasonal tailwinds and the new shale scale story are still in play even when risk appetite wobbles.
Sources
- [1] Forbes, "Why Energy Bulls Are Flocking To Devon," Mar 18, 2026.
- [2] Forbes, "Why Energy Bulls Are Flocking To Devon," Mar 18, 2026.
- [3] The Wall Street Journal, "Devon Energy to Buy Coterra for $21.5 Billion to Create Shale Giant," Feb 2, 2026.
- [4] Reuters, "US shale producers Devon and Coterra to merge in a $58 billion deal," Feb 2, 2026.
- [11] The Wall Street Journal, "Devon Energy to Buy Coterra for $21.5 Billion to Create Shale Giant," Feb 2, 2026.
- [12] Bloomberg, "Devon Agrees to Buy US Shale Rival Coterra for $21.4 Billion," Feb 2, 2026.
- [14] The Wall Street Journal, "Devon, Coterra to Merge in $58 Billion Deal," Feb 2, 2026.