Oneok (OKE) Has Rallied in 7 of 7 Midterm Spring Windows as a 24-Day Run Nears
Oneok is approaching a historically strong 24-day midterm-election-year window just as shares trade near their 52-week high and energy demand stays firm.

Key takeaways
- Oneok is set to enter a 24-day midterm-election-year spring window on Mar 27 that has been positive in all seven prior cycles.
- The pattern is long-biased, with 100% Percent Profitable, 7 winners and 0 losers, and an average gain of 3.66% across those windows.
- Average winner gains of 3.66% have come with a TradeWave Ratio of 2.91, showing that price has typically traveled meaningfully in the trade direction inside the window.
- Intraperiod swings have been real: the worst year still saw a drawdown of about 3.18% from entry before finishing higher.
- Shares last closed at 89.21, about 4.1% below their 52-week high, after a 0.9% daily gain and a 2.15% one-month advance.
- Fundamentals remain supported by strong recent revenue growth and steady margins, while midstream energy demand is underpinned by rising U.S. natural gas needs.[1]
According to historical data from TradeWave.ai, this late-March window for Oneok has behaved very differently from an average month on the calendar, and the next iteration is about to open.
Seasonal window
Oneok has risen in all 7 of the last 7 midterm-election-year spring windows starting around Mar 27, averaging 3.66% gains over 24 trading days. The next window begins on Mar 27, with the stock last closing at 89.21, about 4.1% below its 52-week high of 92.99 after a 0.9% gain on the day and a 2.15% advance over the past month.
The pattern groups only the last seven midterm election years, which matters because policy and liquidity often look very different in the middle of a presidential cycle than in the election year itself or the year after. For a regulated, capital-intensive midstream operator like Oneok, that mid-cycle backdrop tends to line up with clearer infrastructure spending plans and more stable rate expectations, conditions that have historically supported steady, toll-like cash flows rather than boom-and-bust swings.[1]
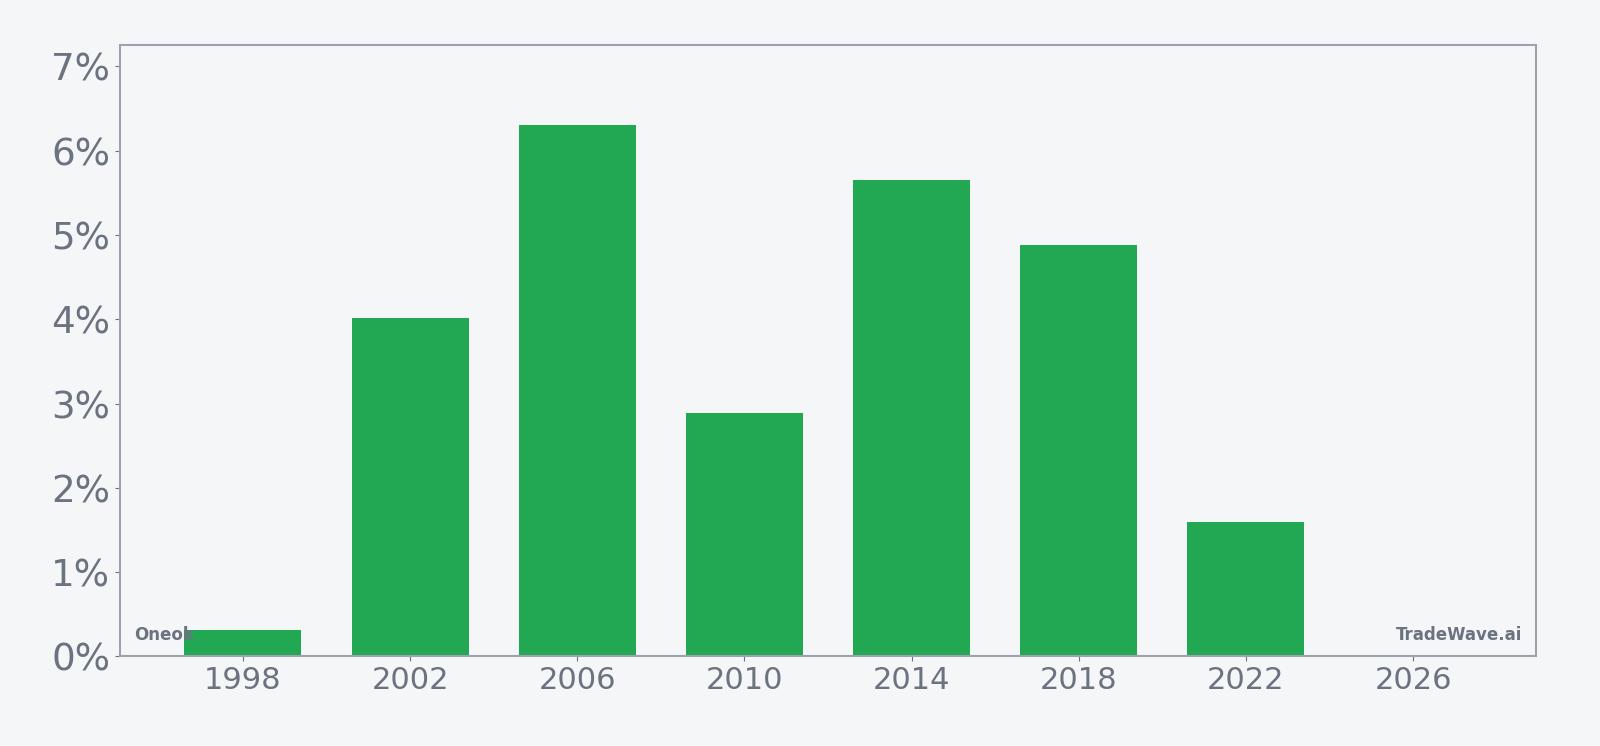
Within this specific 24-day stretch, the trade direction is long. Across the seven historical midterm-year samples, Percent Profitable is 100%, with 7 winners and 0 losers. Average profit across all years is 3.66%, and the median outcome is slightly higher at 4.02%, which points to a fairly tight cluster of positive returns rather than one outlier year doing all the work.
The TradeWave Ratio (TWR) for this pattern is 2.91. TradeWave Ratio (TWR) reflects how far price typically travels in the trade direction within the window regardless of the final close. In plain English, Oneok has usually moved a meaningful distance higher at some point during this 24-day span, even in the milder years.
Looking at individual cycles, the strongest midterm-year run came in 2006, when Oneok gained 6.31% from entry to exit, with a best intraperiod rally of 8.14% before a modest pullback.[1] The softest outcome was 1998, which still finished up 0.31% but saw a maximum adverse move of about 3.08% from the starting level before recovering. That mix captures the core message of this window: historically positive, but not a straight line.
Intraperiod volatility shows up clearly in the best and worst excursions. In 2018, for example, the stock’s maximum favorable move inside the window reached 6.43%, while the worst drawdown from entry was 3.18%.[1] Across the sample, maximum favorable excursions (MFE) have tended to sit in the mid-single digits, while maximum adverse excursions (MAE) have usually been contained to the low single digits, which is supportive for a long bias but still leaves room for uncomfortable dips.
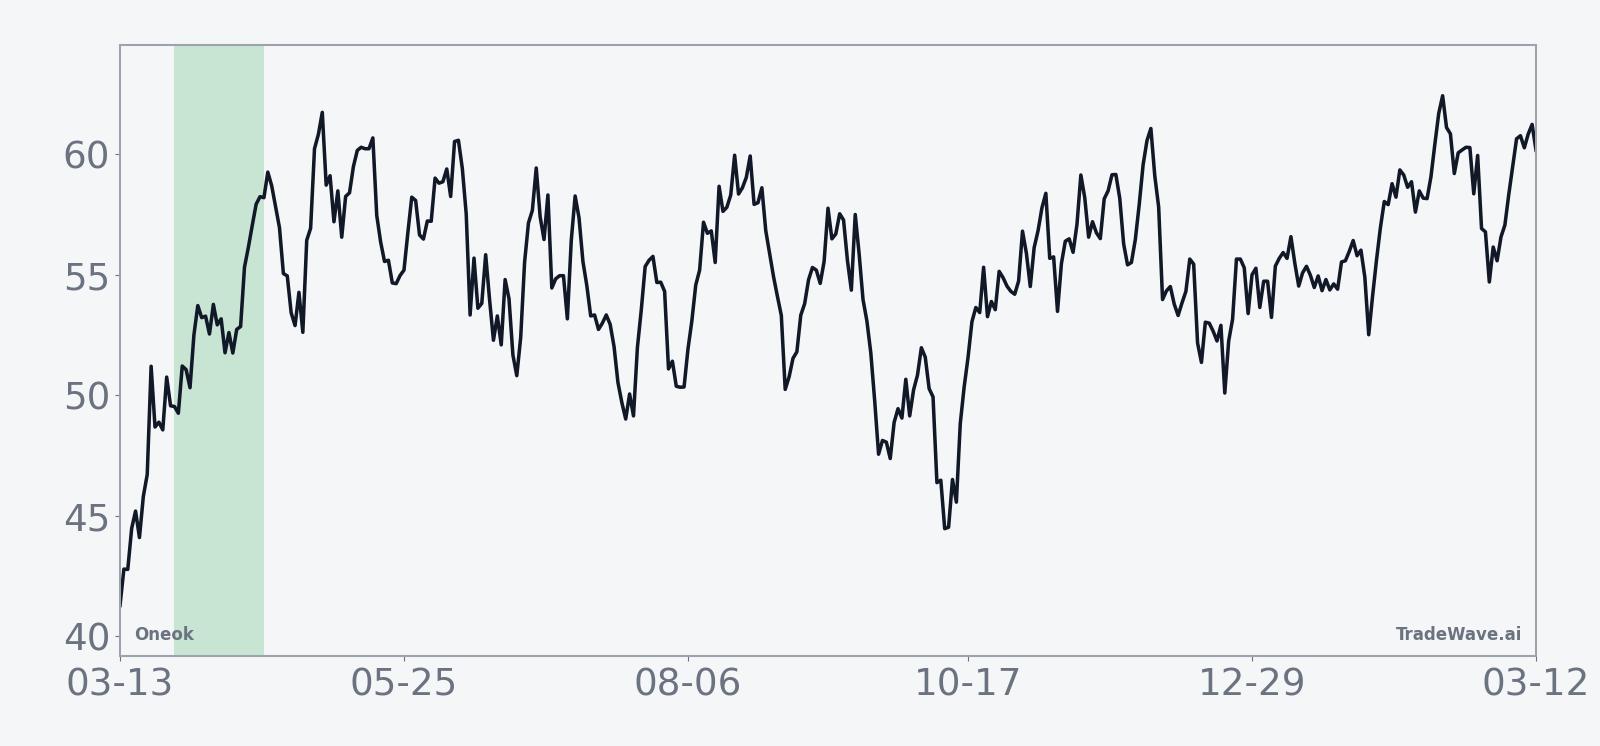
The historical seasonal trend curve for this window slopes upward in a relatively steady fashion rather than spiking at the start or end. That suggests gains have typically accrued gradually across the 24 days, with no single “all-or-nothing” session dominating the pattern. For traders, that kind of profile often lines up with a grind higher alongside supportive macro or sector news rather than a one-off catalyst.
The cumulative return chart across all seven midterm-year samples shows a 28% total gain for this window, which annualizes to about 3.64% when scaled to a full year. Add it up: seven cycles, seven wins, and a cumulative climb that reflects consistent, if unspectacular, spring strength for Oneok in this part of the election cycle.
Year-by-year bars with maximum favorable and adverse moves show how upside and drawdowns have coexisted inside this window.
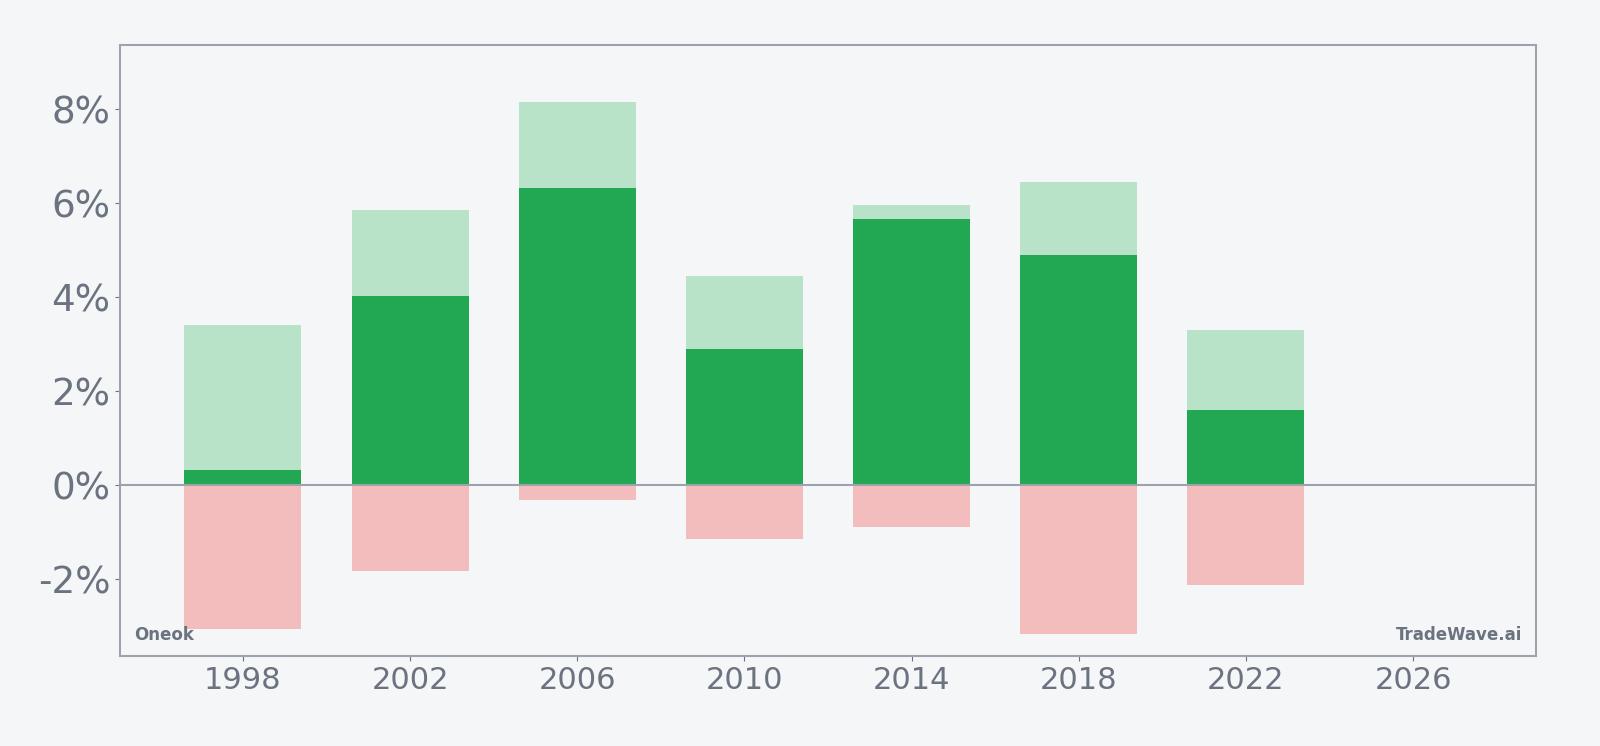
History does not guarantee future results; adverse excursions (MAE) can be large even in winning windows.
Price and near-term drivers
Oneok closed at 89.21 on Mar 23, up 0.82 on the day for a 0.9% gain, after trading between 89.10 and 92.14 on heavy volume of about 19.4 million shares. The stock is up 2.15% over the past month and sits about 4.1% below its 52-week high of 92.99, with the 50-day moving average down at 81.13 and 20-day average volume near 5.67 million shares, which underscores how elevated Friday’s turnover was.
Fundamentally, Oneok has been leaning on a mix of strong recent growth and classic midstream stability. Revenue grew 58.4% over the last twelve months, with an average 16.4% growth rate over the past three years and an operating margin of 21.2%, and there has been no major margin shock in the past year.[1] That combination has helped frame the stock as a value-tilted income play rather than a pure growth story, especially as management has paired M&A-driven expansion with a focus on cost synergies and dividend support.[1]
On the macro side, the backdrop remains friendly for pipeline and processing names. Rising U.S. natural gas demand tied to AI data centers and infrastructure needs has supported volumes across the system, while relatively stable oil prices have kept capital budgets from swinging wildly.[1] For a company that earns much of its money by collecting tolls on molecules moving through its network, that kind of steady demand picture can matter more than short-term commodity price spikes.
Sector positioning also helps explain why Oneok is trading near its highs as the seasonal window approaches. Midstream energy has been regaining momentum as investors look for cash-generative businesses that can still grow through acquisitions and organic projects.[1] Oneok’s footprint in gathering, processing and NGL pipelines gives it leverage to that theme, and recent commentary has pointed to solid 2025 guidance with reaffirmed operational strength rather than a reset.[1]
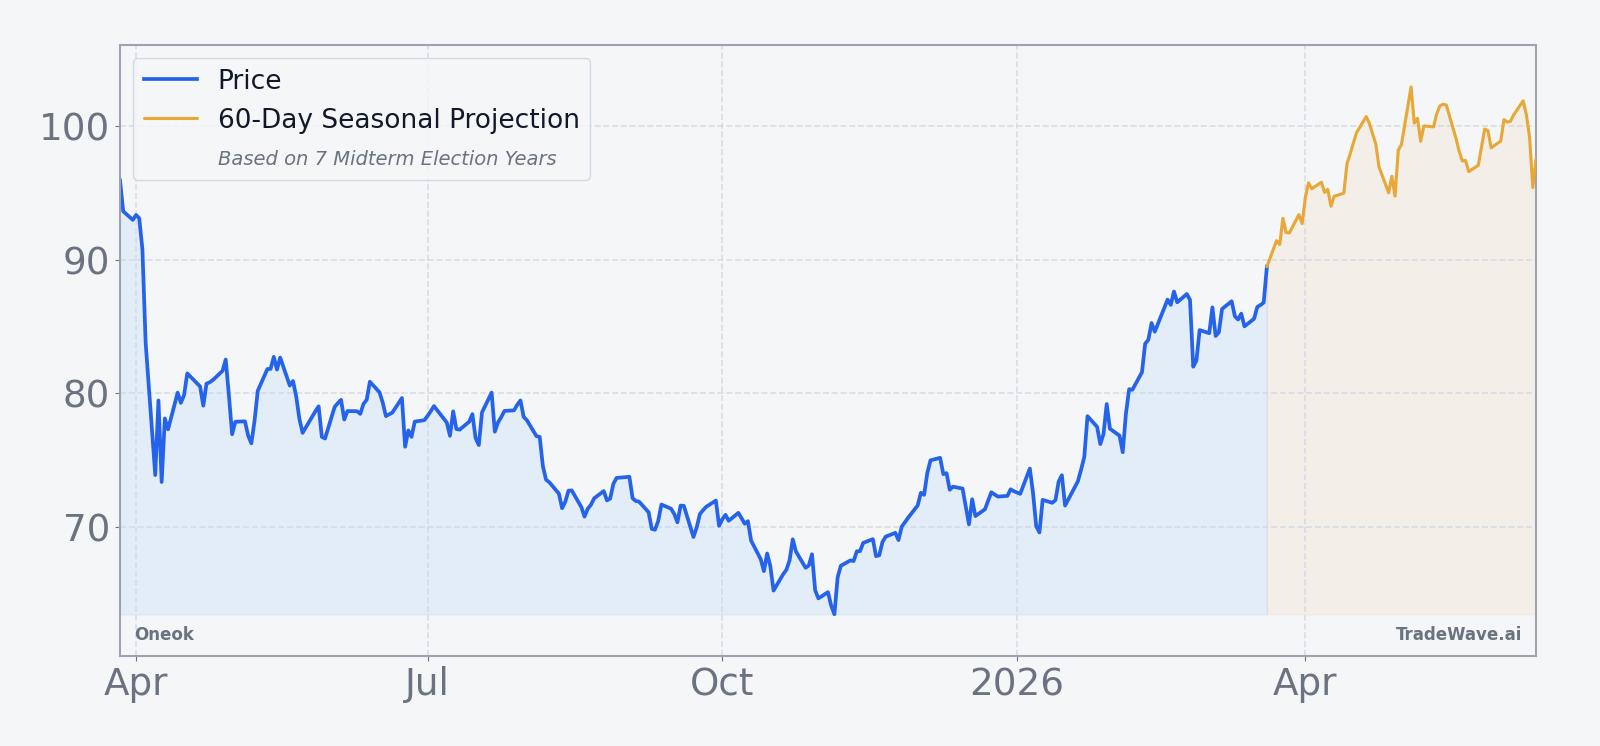
The chart below situates the latest move in its recent multi-month context, alongside a 60-day seasonal projection for the upcoming window.
What to watch as the window opens
The key near-term test is whether Oneok can hold above its 50-day moving average and make another run at the 92 to 93 area as the 24-day window kicks in. Historically, the pattern has favored a steady grind higher rather than a single breakout day, so traders will be watching for a sequence of higher closes and contained intraday pullbacks that rhyme with prior midterm-year behavior.
Macro and policy calendars will matter too. Any shifts in rate expectations that affect infrastructure financing costs, or new signals on U.S. natural gas demand from AI buildouts and export policy, could either reinforce or blunt the usual mid-cycle tailwind.[1] If the stock respects typical intraperiod drawdown ranges while tracking the historical upward path, that would be a sign the seasonal script is still in play. A sharp break below recent support with unusually deep adverse excursions would be an early sign that this cycle is diverging from the last seven.