Gen Digital (GEN) Near 52-Week Low as Heavy Volume Bounce Faces Midterm Weakness
Gen Digital is trading just above its 52-week low as it approaches a 53-day midterm-election seasonal window that has historically favored short-side setups.

Key takeaways
- Gen Digital is heading into a 53-day window starting Apr 20 that aligns with the last 8 midterm election years.
- In that midterm-year slice, the stock has moved in favor of short trades in 7 winners versus 1 loser, or 88% of cycles.
- Average gain in winning years is 15.63% for shorts, while the all-years average including the lone loss is still 13%.
- Historical best intraperiod moves show sizable favorable swings for shorts, but adverse excursions have also reached double digits in some years.
- Today’s close at 20.97 leaves Gen Digital about 33.8% below its 52-week high and only 4.1% above its 52-week low, a tight spot heading into a historically weak stretch.
According to historical data from TradeWave.ai, this upcoming midterm-year stretch for Gen Digital behaves very differently from an average spring, with a clear directional bias that traders often overlook.
Seasonal window
Gen Digital has delivered profitable short-side results in 7 of the last 8 midterm-election windows for this 53-day stretch, with winning years averaging 15.63% gains for bears. Today the stock closed at 20.97, about 33.8% below its 52-week high of 31.66 and roughly 4.1% above its 52-week low of 20.15, so it is heading into this pattern from a depressed base rather than a rally.
Grouping the data by presidential election cycle matters here because this window only looks at midterm election years, which often feature shifting regulatory priorities and tighter scrutiny on large tech and cybersecurity names. That policy backdrop can change how single-name risk trades compared with the same calendar dates in other phases of the cycle.
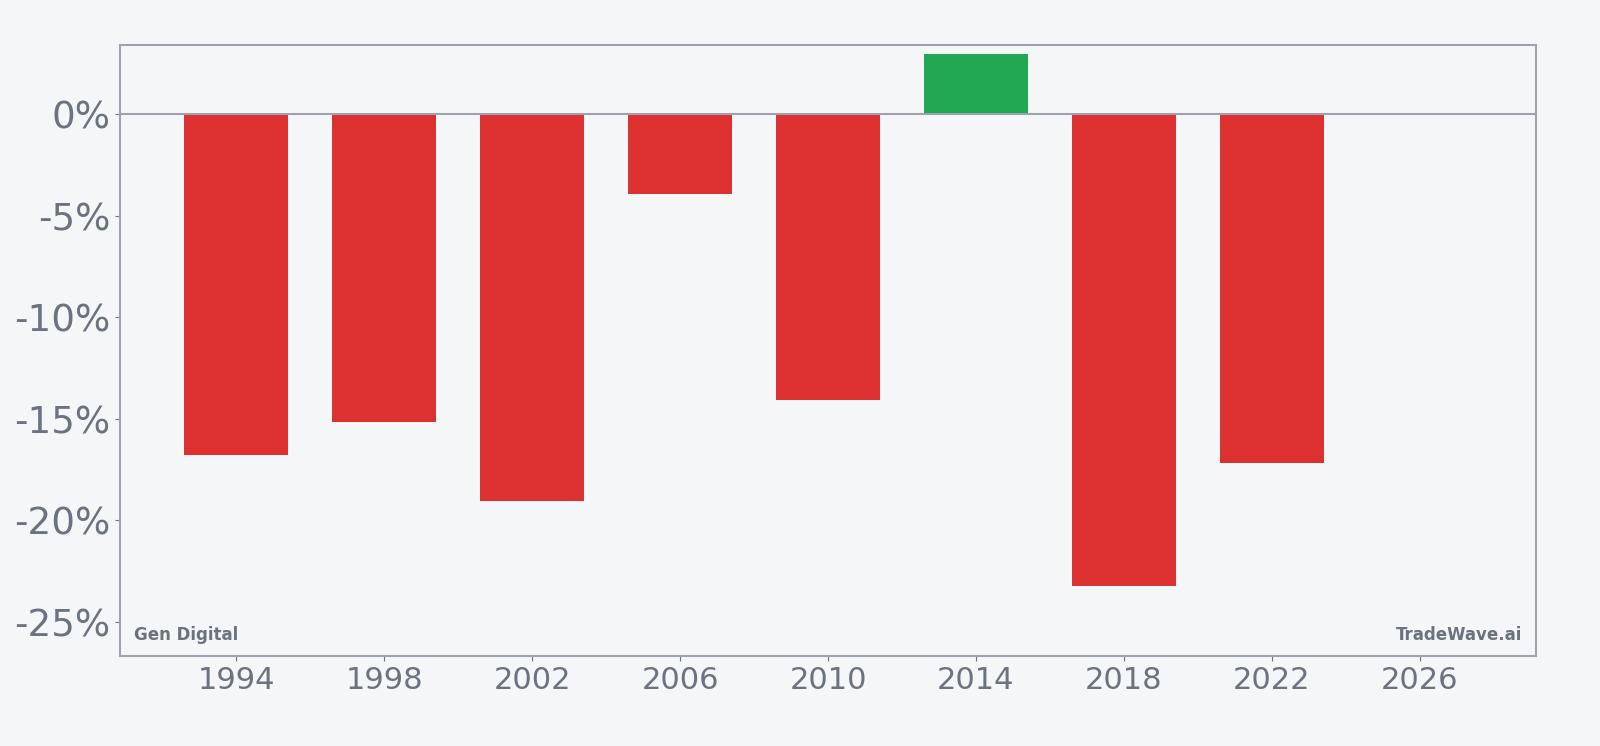
This seasonal window begins on Apr 20 and spans 53 trading days. Historically, during this period in midterm election years, Gen Digital has tended to drift lower in a way that has favored short positions rather than longs. The trade direction is explicitly short, and the 88% profitable rate means only one of the eight midterm-year samples produced a net loss for bears by the end of the window.
Average profit of 15.63% in winning years shows that when the short pattern works, it has not been a marginal move. Including the single losing year, the all-years average still comes in at 13%, which is unusually strong for a short-focused seasonal setup. Median profit of 15.98% sits close to the average, suggesting the distribution of outcomes has not been dominated by just one outlier year.
The per-year table shows 2018 as the strongest short year, with a net return of -23.23% for the stock and a maximum adverse move of -31.97% from the short entry, meaning the price fell sharply in favor of the trade during the window. On the other side, 2014 stands out as the lone losing year for shorts, with a 2.98% net gain for the stock and a relatively modest worst drawdown of -3.94% against the short, underscoring that even the outlier did not feature a violent squeeze.
Looking across all years, the maximum favorable excursion, or best intraperiod move from the short entry, has often reached high single digits to low double digits, while the maximum adverse excursion, or worst drawdown against the short, has also occasionally pushed into the teens. That combination points to a window where price can travel meaningfully in both directions before the final outcome settles, which aligns with the TradeWave Ratio of 1.99 that signals substantial travel in the trade direction within the window.
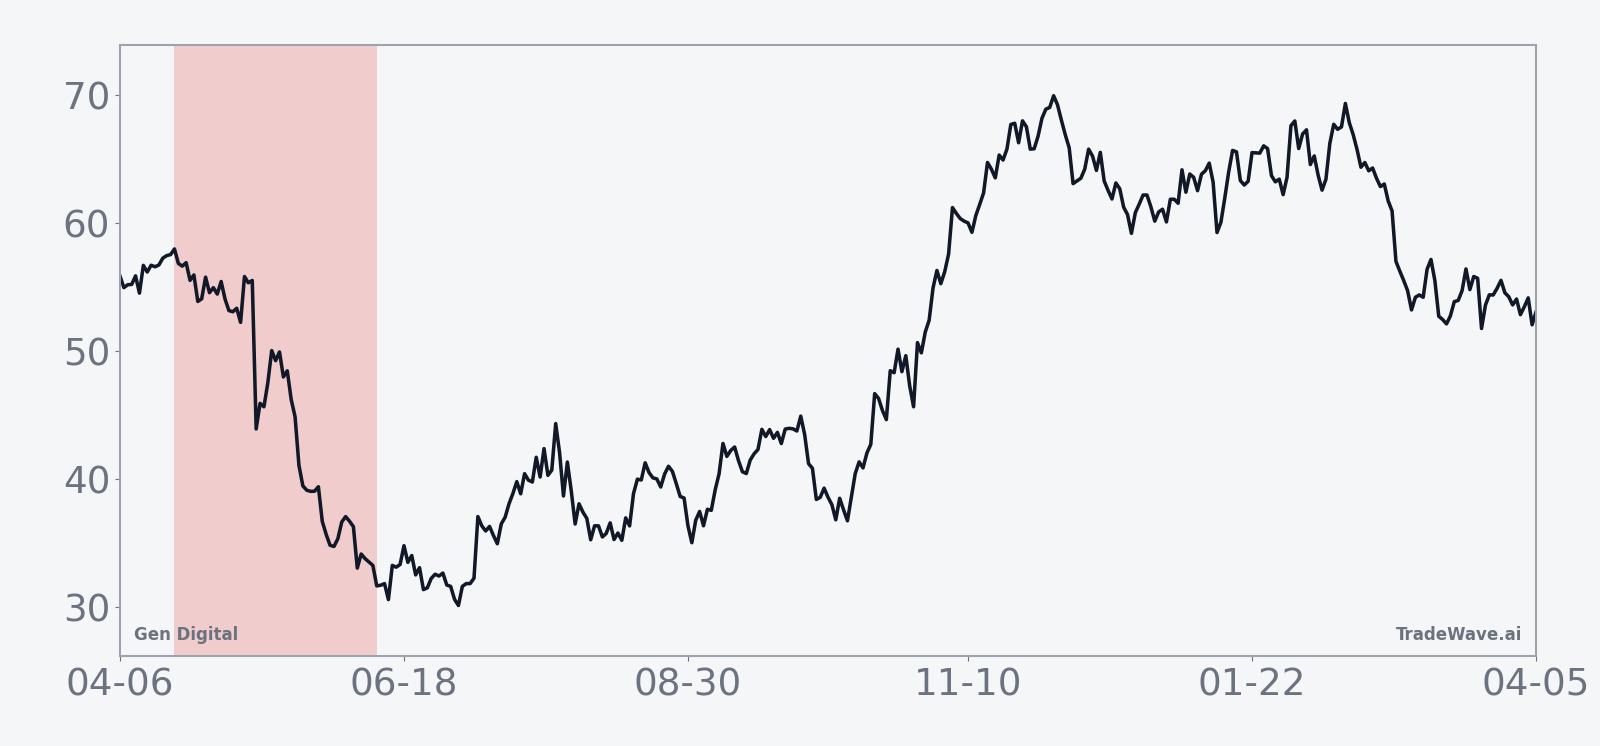
The historical seasonal average trend line slopes steadily lower through much of the 53-day span, with the bulk of the short-side gains accruing in the middle of the window rather than at the very start or end. That pattern suggests prior midterm years have often seen weakness build after the first couple of weeks, then stabilize toward the close of the window.
Year-by-year bars that combine net results with best and worst intraperiod swings show how often shorts have seen both meaningful gains and sizable countertrend moves.
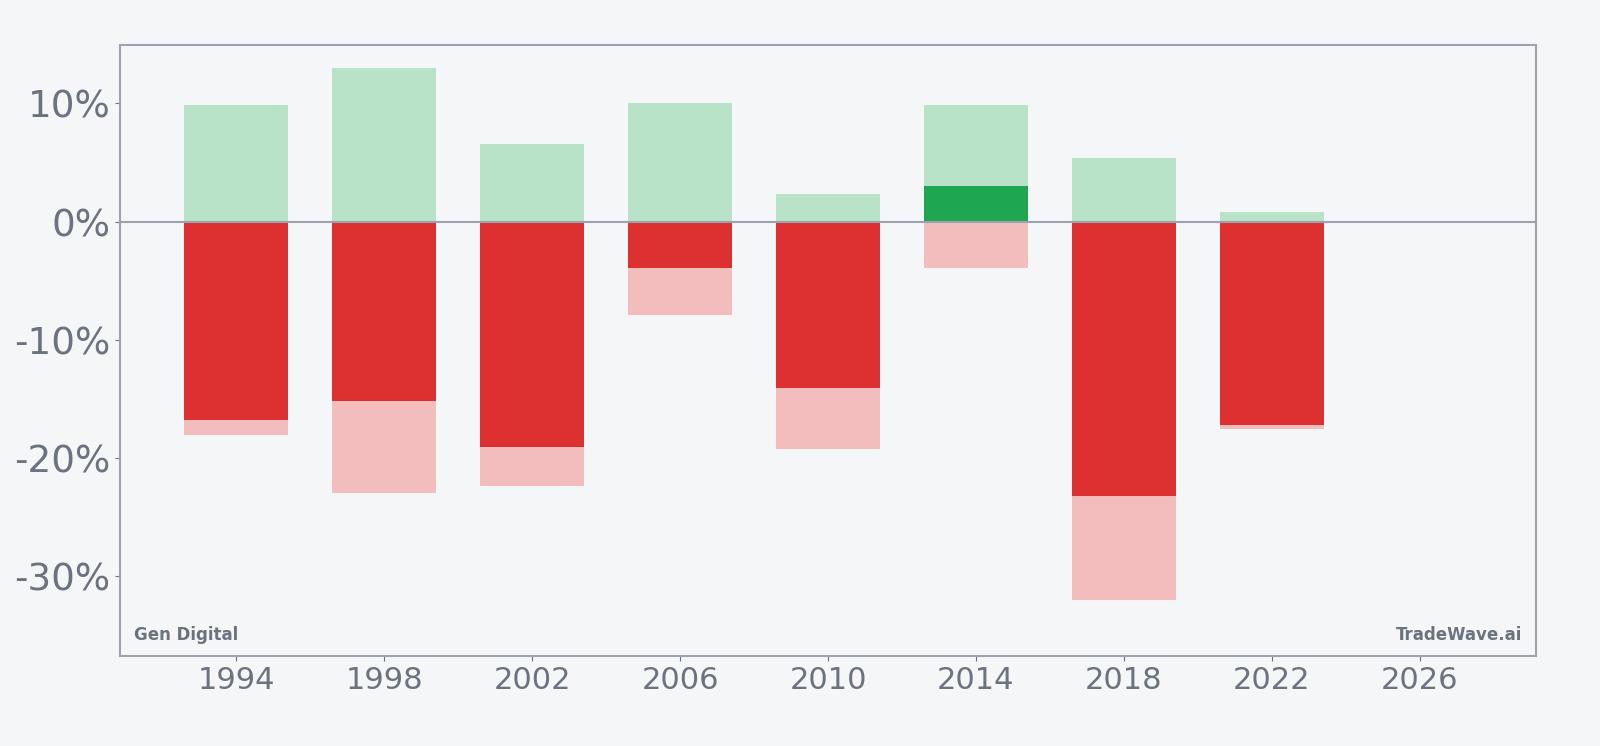
The combined net, maximum favorable, and maximum adverse bars make clear that while most midterm-year windows have rewarded shorts, several also featured double-digit rallies against the position before rolling over. History does not guarantee future results; adverse excursions can be large even in winning windows.
Price and near-term drivers
Gen Digital finished the latest session at 20.97, up 2.0% on the day, with roughly 36.1 million shares changing hands against a 20-day average volume of about 7.3 million. That bounce still leaves the stock well below its 50-day moving average of 23.45 and more than one-third under its 52-week high, while sitting only a few dimes above the 52-week low, a setup that can make any additional seasonal weakness feel more painful for existing holders.
The chart below situates the latest move in its recent multi-month context alongside a 60-day seasonal projection.
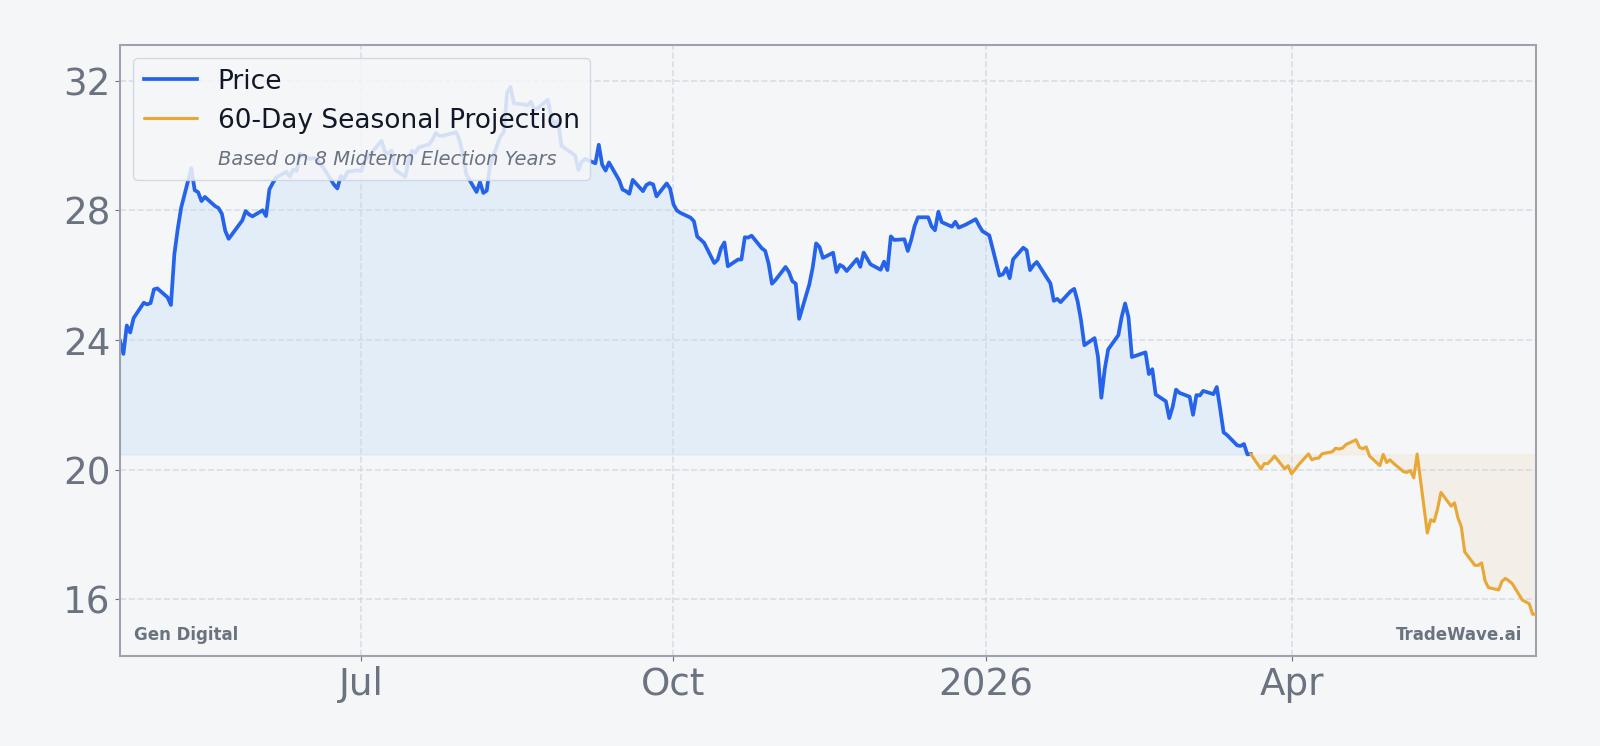
Over the past month, Gen Digital shares have fallen 6.17%, underperforming many large-cap tech peers and leaving the chart in a grinding downtrend rather than a sharp collapse. The 50-day moving average sits meaningfully above spot, which often acts as a reference line for whether rallies are being sold or sustained. With no near-term earnings date or major company-specific catalyst on the calendar, the stock’s path into late April may be driven more by sector flows and macro risk appetite than by fresh fundamental headlines.
From a positioning standpoint, the combination of heavy one-day volume and a price still pinned near the lows suggests some investors are using strength to adjust exposure rather than chase upside. That behavior can matter as the seasonal window opens, because prior midterm years in this pattern have often seen selling pressure intensify once the stock fails to reclaim key moving averages early in the stretch.
What to watch as the window opens
The first marker to watch is how Gen Digital trades as Apr 20 approaches, especially around the 50-day moving average near 23.45. A sustained push back above that level before the window starts would contrast with the typical midterm-year pattern, which has historically seen the stock weaken rather than repair technical damage during this stretch.
Second, intraday swings will matter as much as closing prices. Past midterm windows have featured sizable maximum favorable and adverse excursions for shorts, so traders may focus on whether early rallies are being faded or whether sharp squeezes persist for several sessions. If the stock repeatedly spikes higher intraday but closes weak, that would rhyme with prior years where shorts ultimately prevailed despite uncomfortable countertrend moves along the way.
Finally, sector and macro tone around cybersecurity and broader tech will shape how much of this pattern shows up in the tape. A benign macro backdrop with stable rates and steady risk appetite could blunt some of the downside that has historically appeared in this window, while any renewed risk-off move in growth stocks could amplify it. The key tell will be whether Gen Digital continues to hug the lower end of its 12-month range as the window progresses or instead breaks convincingly higher, which would mark a rare repeat of the 2014-style losing year for shorts.