General Mills (GIS) Near 52-Week Lows Just as an 11-of-12 Late-March Rally Window Opens
General Mills is heading into a historically strong late-March stretch just as the stock trades near a 52-week low after a steep slide.

Key takeaways
- A seven-day seasonal window for General Mills starting Mar 22 has been positive in 11 of the past 12 years, a 92% hit rate for long setups.
- Winning years in this window have averaged gains of 3.74%, while including the lone losing year still leaves a 3% average profit across all samples.
- The pattern is long-biased, with a Trade Direction of “long” and a TradeWave Ratio of 1.18, pointing to meaningful intraperiod travel in the trade direction.
- Maximum favorable moves have reached double digits in strong years, but adverse excursions have also been sizable at times, underscoring real drawdown risk.
- Shares closed at $38.98 on Mar 16, about 31.4% below their 52-week high and just above the 52-week low, after a roughly 19% one-month slide.
- Macro pressure on consumer staples and prior earnings showing softer demand frame this window as a potential test of whether late-March strength can offset fundamental headwinds.[1][2]
According to historical data from TradeWave.ai, this upcoming late-March stretch has behaved very differently from an average week for General Mills in prior years, and the next iteration is about to open.
Seasonal window
General Mills has risen in 11 of the past 12 years during this late-March seven-day window, averaging 3.74% gains for the winners. The next window begins on Mar 22, with the stock last closing at $38.98, about 31.4% below its 52-week high of $56.78 and sitting just above its 52-week low of $38.59.
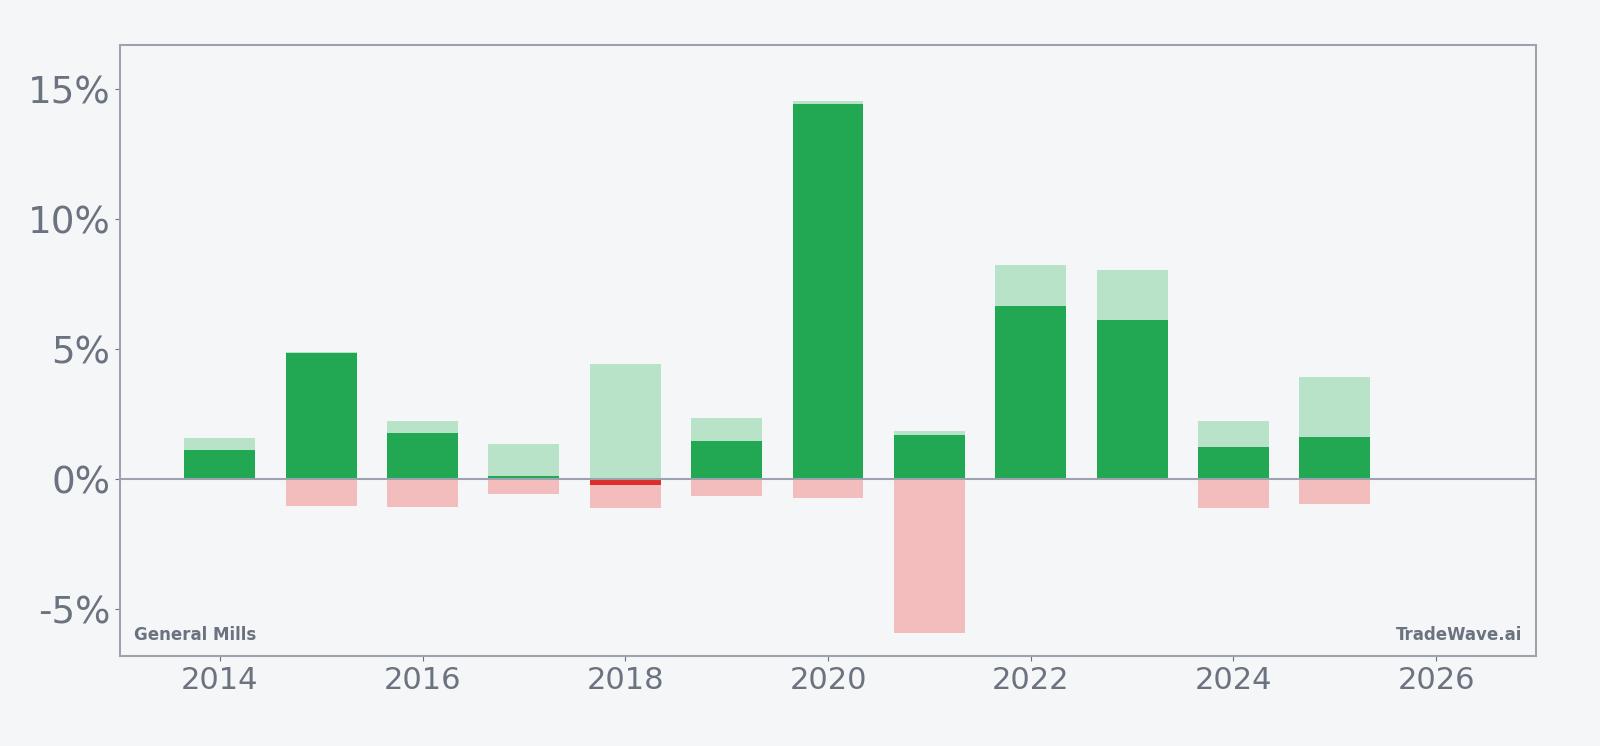
A combined view of net returns with peak run-ups and worst drawdowns shows how far GIS has typically swung inside this window.
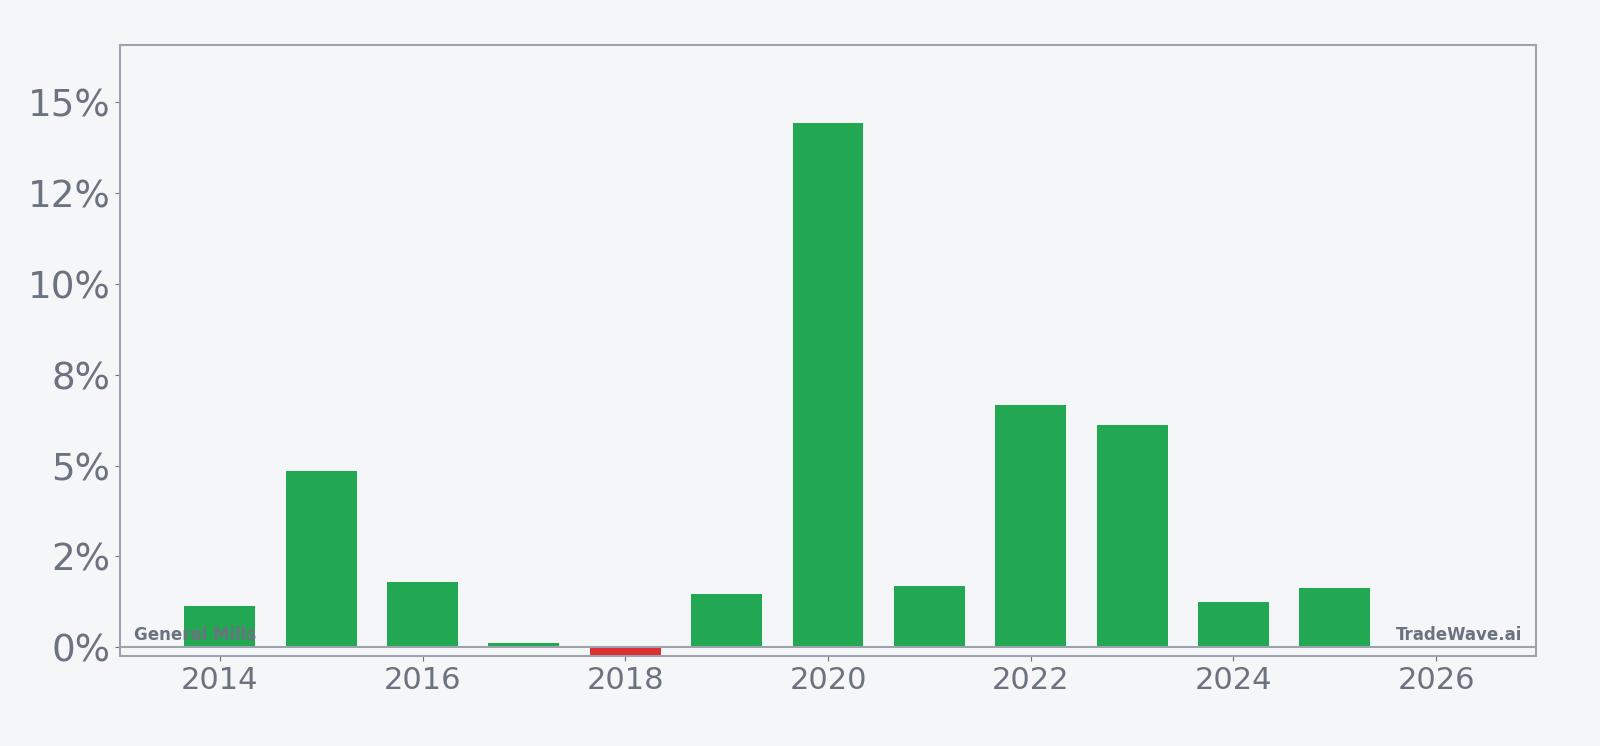
Historically this has been a long-friendly setup. With a Trade Direction of long and 92% of years finishing higher, the pattern has favored upside follow-through more often than not. The 3.74% average gain in winning years compares with a modest -0.22% average loss in the lone down year, which keeps the all-years average at 3% despite that miss.
The per-year breakdown shows how skewed the distribution has been. The standout year was 2020, when General Mills rallied 14.42% in the window, with a maximum favorable move of 14.53% and only a -0.7% worst drawdown from entry. At the other end of the spectrum, 2018 delivered the only negative finish, down 0.22%, even though the stock still saw a 4.45% peak run-up before slipping back.
The maximum favorable excursion and maximum adverse excursion profile underlines that this is not a quiet stretch. In several years, including 2022 and 2023, the stock logged maximum favorable moves above 8%, while the worst intraperiod drawdowns ranged from roughly -1% to nearly -6% in 2021. That mix of strong rallies and occasional sharp dips means traders have historically had both opportunity and real downside risk inside the same seven days.
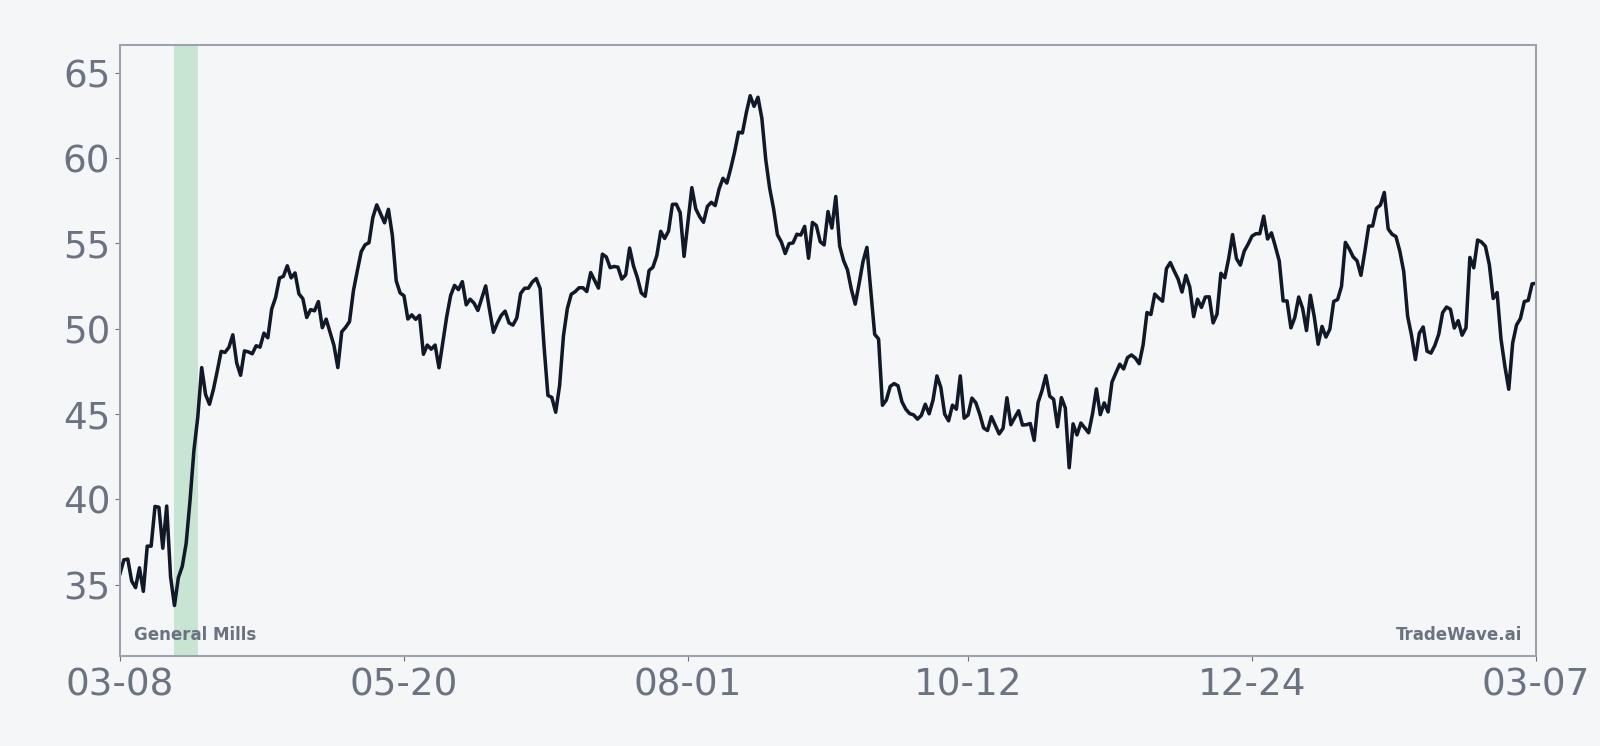
The seasonal trend chart suggests gains have often built steadily across the window rather than arriving in a single spike. The average path slopes higher from day one through day seven, with only shallow mid-window givebacks. The cumulative return line across the 12-year sample climbs to a 48% total gain, which is a sizable haul for a pattern that only runs a week each year.
Add it up: 11 winners, one loser, and a history of meaningful intraperiod swings make this one of the more consistent short windows on the General Mills calendar. History does not guarantee a repeat, but the track record heading into Mar 22 is hard to ignore.
History does not guarantee future results; adverse excursions (MAE) can be large even in winning windows.
Price and near-term drivers
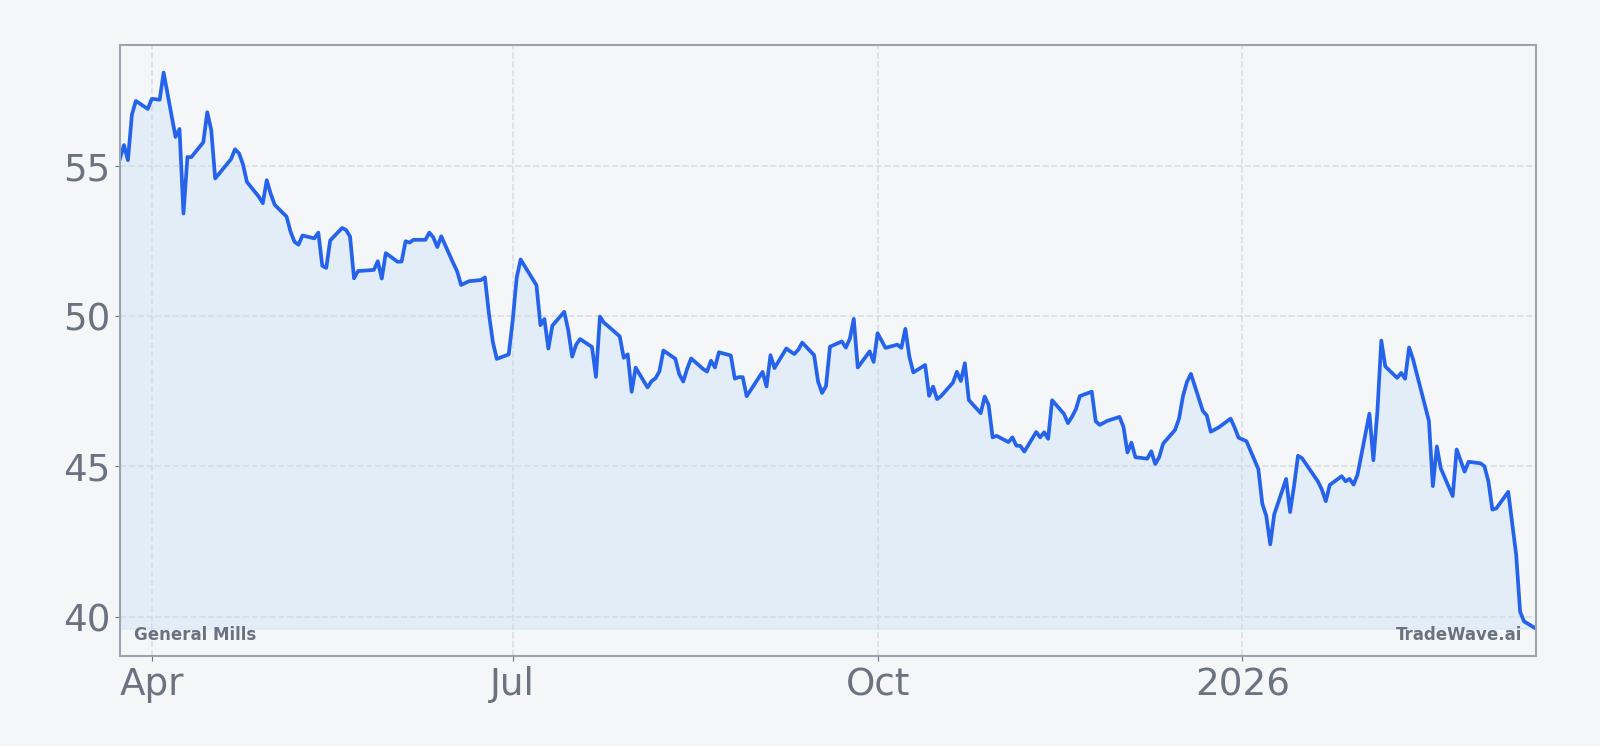
General Mills closed at $38.98 on Mar 16, down 1% on the day and roughly 19.36% lower over the past month, leaving the stock about 31.4% below its 52-week high and only cents above its 52-week low. That slide has come as investors reassess defensive consumer names and rotate away from staples that had been seen as safe havens.
The chart below situates the latest move in its recent multi-month context.
Fundamentally, the company is still digesting a reset in demand and pricing. In Dec 2025, General Mills reported that quarterly net sales fell 7% to $4.9 billion, with net income dropping to $413 million from $795.7 million a year earlier as management leaned on price cuts to support volumes.[1] In Sep 2025, the company kept its full-year outlook even as first-quarter sales slipped 6.8% to $4.52 billion, signaling confidence that cost controls and mix could offset softer North America demand.[2]
Guidance reflects that balancing act. Management has projected full-year net sales to land in a tight band between down 1% and up 1%, with adjusted earnings per share expected to fall 10% to 15% in constant currency.[1][2] That is a meaningful reset from the pandemic-era boom in at-home food consumption and helps explain why investors have been reluctant to pay up for the stock even with a defensive profile.
Macro conditions have not been kind to packaged food companies either. Rising consumer prices and a cooling U.S. labor market have pressured household budgets, pushing shoppers toward cheaper alternatives and private-label offerings, which has weighed on General Mills’ sales in its core North America segment.[2] At the same time, the company has benefited from volume gains in international markets and pet food, which have provided some offset to domestic softness.[2]
Strategically, General Mills has been cutting prices on products such as Pillsbury dough and Progresso soup to defend shelf space and win back price-sensitive shoppers. Those moves have helped lift volumes, but they have also compressed margins and contributed to the earnings decline reported in late 2025.[1][3] The trade-off between volume growth and profitability remains a central theme for the stock.
On the brand and ESG front, the company has tried to reinforce its long-term story. In Sep 2025, General Mills was named to TIME’s World’s Best Companies 2025 list, ranking highly in the U.S. Food & Beverage category for sustainability transparency.[4] That recognition does not move the stock day to day, but it supports the case for the company as a durable, if currently out-of-favor, staple name.
What to watch as the window opens
The late-March seasonal window for General Mills starts on Mar 22 and runs for seven trading days. Historically it has been a strong stretch for long positions, with 11 winners out of 12 and a 3.74% average gain in the up years. The stock is entering that period from a position of weakness, trading near its 52-week low after a sharp one-month drop, which sets up a clean test of whether the pattern can reassert itself against a bearish tape.
Traders will be watching a few key markers. First, price behavior around the $38.59 52-week low is critical. A firm hold and quick bounce inside the window would rhyme with prior years where gains built steadily across the week. A decisive break lower that fails to recover by the end of the window would be a clear departure from the historical script.
Second, any updates on consumer spending, food inflation, or retailer commentary could influence how much room the stock has to follow its usual seasonal path. The company’s own guidance already bakes in flat to slightly negative sales and a double-digit earnings decline, so incremental macro data that hints at stabilization in household budgets could give bulls more confidence to lean into the pattern.[1][2]
Third, volume and intraday swings inside the window will matter as much as the final close. Past years have seen sizable maximum favorable moves alongside meaningful drawdowns, so a rally that comes with contained intraday downside would look more like the strongest historical iterations. Conversely, a choppy tape with deep intraday selloffs, even if the week finishes green, would signal that risk remains elevated beneath the surface.
Finally, keep an eye on how General Mills trades relative to the broader food and beverage group. If the stock starts to outperform peers during the window, it would suggest that the seasonal tailwind is lining up with company-specific positioning rather than just a sector bounce. If it lags even as the group firms, that would be a sign that investors are still focused on its earnings reset and pricing strategy, and that this year’s late-March pattern may prove to be the exception rather than the rule.
Sources
- [1] The Wall Street Journal, "General Mills Quarterly Profit Falls Amid Price Cuts" (Dec 17, 2025)
- [2] Reuters, "General Mills keeps annual outlook as North America demand softens" (Sep 17, 2025)
- [3] The Wall Street Journal, "General Mills Is Cutting Prices on Food, and It’s Paying Off" (Dec 17, 2025)
- [4] General Mills, "General Mills Recognized on TIME’s World’s Best Companies 2025 List" (Sep 10, 2025)