Fidelity National Information Services (FIS) Has Rallied 10 Straight Years in This 58-Day Spring Window
Fidelity National Information Services is entering a 58-day spring stretch that has delivered gains every year for a decade, even as the stock trades well below its 52-week high and legal scrutiny lingers in the background.

Key takeaways
- Fidelity National Information Services has posted gains in this 58-day spring window in 10 of 10 years, a 100% hit rate for long setups.
- The window begins Mar 24 and runs for 58 trading days, with average gains of 9.64% across all years in the sample.
- Intraperiod swings have been meaningful, with some years seeing adverse moves of more than 10% before finishing higher.
- The pattern’s TradeWave Ratio of 2.44 and Sharpe ratio of 1.85 point to historically strong, risk-adjusted upside during this slice of the calendar.
- Today’s price near $49.77 leaves FIS well below its 52-week high around $80.79, so any seasonal tailwind would be working from a depressed base.
According to historical data from TradeWave.ai, this specific spring stretch has behaved very differently from an average two-month span for FIS. The next section walks through how that pattern has played out over the past decade and what it means for the new window that starts today.
Seasonal window
Fidelity National Information Services has risen in 10 of 10 years during this 58-day spring window, averaging 9.64% gains for long positions. The latest iteration begins today with the stock at $49.77, roughly 38.4% below its 52-week high near $80.79 and about 7.8% above its 52-week low around $46.16. That combination of a clean historical win streak and a beaten-down starting point makes this year’s window one of the more intriguing tests of the pattern so far.
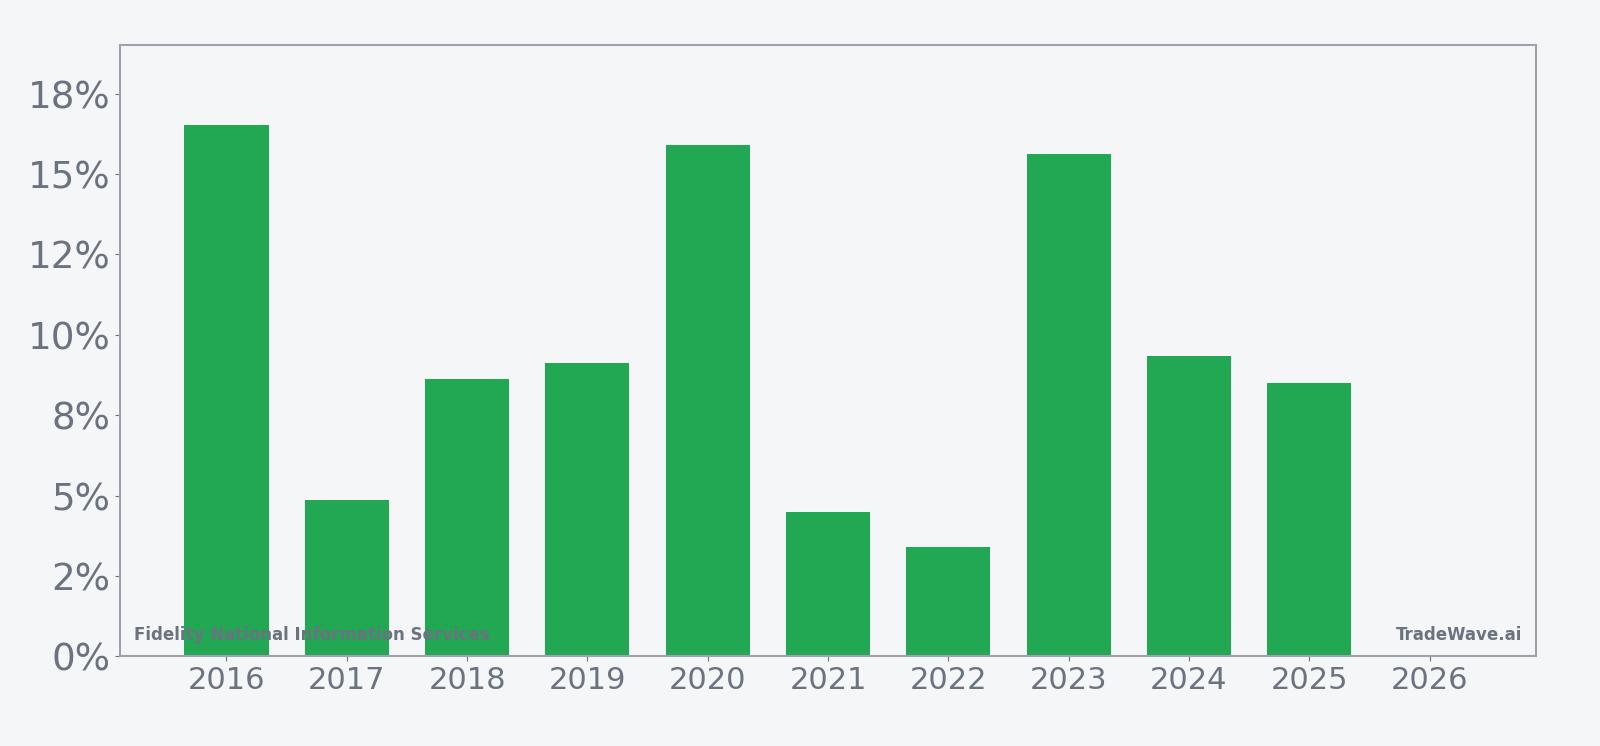
Yearly net and peak moves highlight how upside has often come with meaningful swings along the way.
The long bias in this pattern is clear. Across the past decade, every single iteration of the window finished positive, with the weakest year still up 3.39% and the strongest year gaining 16.54%. Average winners returned 9.64%, and because there were no losing years, that figure also represents the all-years average outcome.
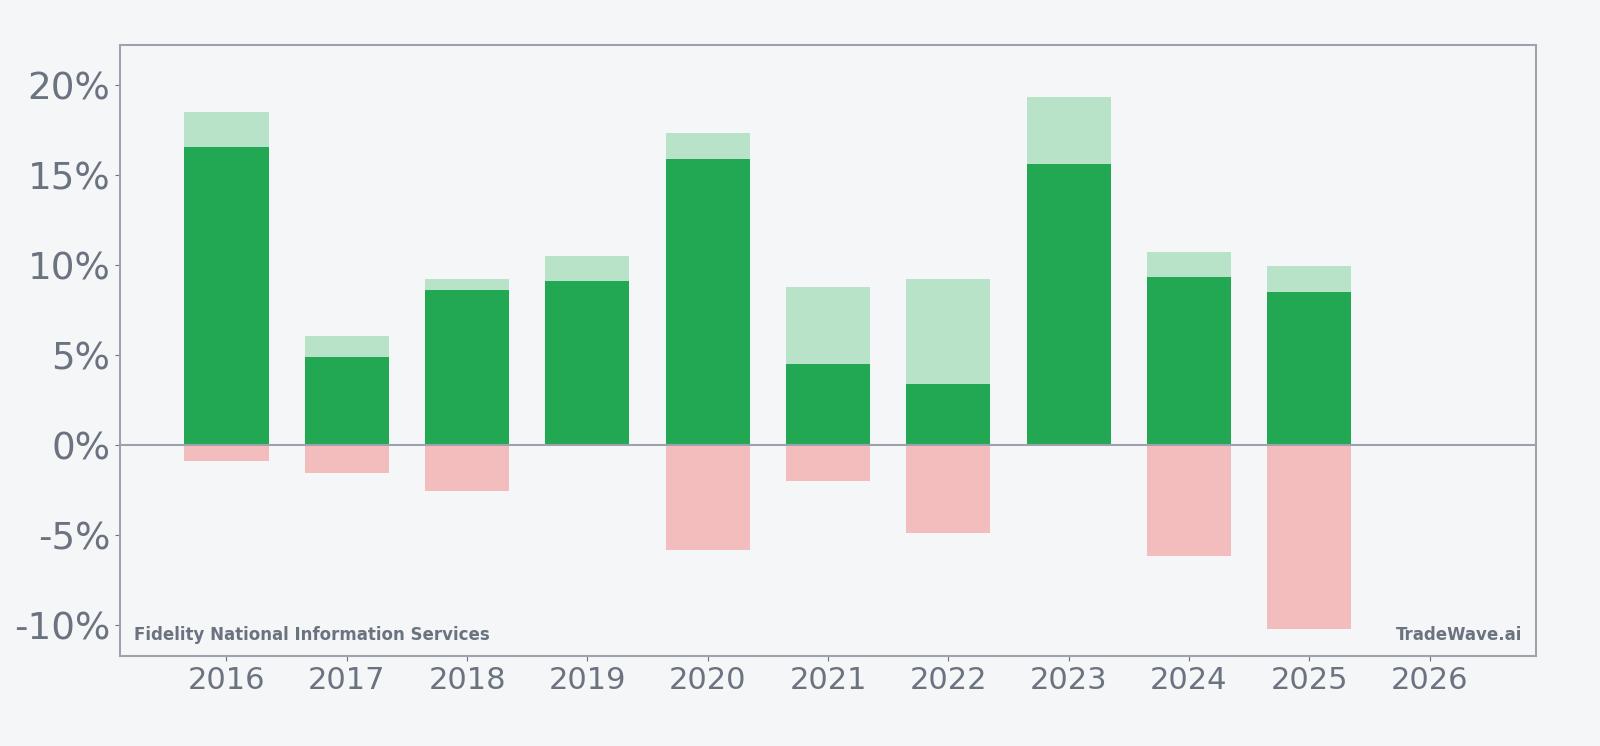
The intraperiod profile is more nuanced. In strong years such as 2016 and 2023, the stock not only finished up double digits but also saw maximum favorable moves above 18%, showing how far rallies have stretched inside the window before cooling off. On the downside, several years carried meaningful drawdowns before recovering, including 2025, when the worst intraperiod drop reached about 10.22% even though the trade still closed up 8.49%.
That mix of large positive swings and occasional deep dips is captured in the TradeWave Ratio of 2.44, which measures how far price typically travels in the trade direction within the window, and in the 1.85 Sharpe ratio based on end-of-window results. The historical pattern has tended to reward patience for long holders, but it has not been a straight line.
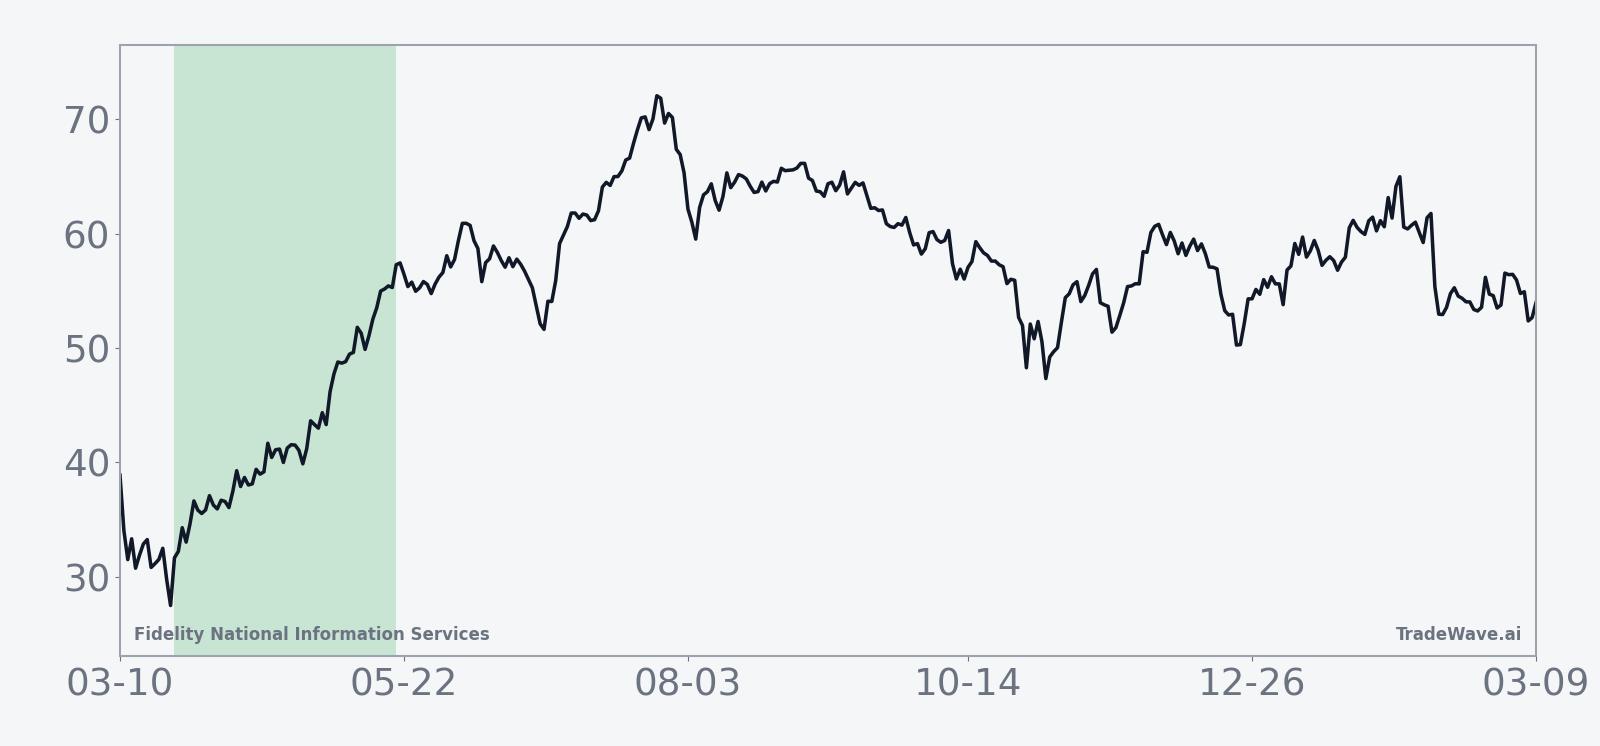
Looking at the average seasonal trend, gains have often built gradually rather than in a single burst. The typical path shows a modest early lift, some mid-window chop, and then a stronger push into the back half of the 58 days. That rhythm matters for traders who care about timing entries and exits inside the window rather than simply holding from start to finish.
The combined net, maximum favorable move and maximum adverse move bars reinforce that story. In most years, the best point-to-peak rally inside the window has been meaningfully larger than the final net gain, which suggests that active traders had chances to capture more than the simple hold-to-expiry return. At the same time, the worst drawdowns have occasionally been sharp, especially in 2020, 2022 and 2025, where adverse moves of roughly 4% to 10% appeared before the stock recovered.
History does not guarantee future results; even in a perfect win streak like this, adverse excursions can be large and uncomfortable before the window closes.
Price and near-term drivers
Fidelity National Information Services shares closed Monday at $49.77, down 0.04% on the day, after trading between $49.14 and $50.68 on volume of about 4.36 million shares. That leaves the stock roughly 38.4% below its 52-week high near $80.79 and about 7.8% above its 52-week low around $46.16, with a 1-month gain of 4.87% suggesting a tentative attempt to stabilize after a difficult year.
Liquidity remains solid, with average 20-day volume near 5.79 million shares and the 50-day moving average sitting around $53.24, several dollars above the current quote. The gap between spot and the 50-day line underlines how much ground the stock has lost in recent months and how any seasonal tailwind would be working against a still-soft intermediate trend.
In Nov 2025, law firm Halper Sadeh said it was investigating whether officers and directors of Fidelity National Information Services breached their fiduciary duties, urging shareholders to contact the firm.[1] That headline did not immediately translate into a clear pricing shock, but it added another layer of governance and strategic uncertainty around a company that has already been through portfolio reshaping and management turnover in recent years.
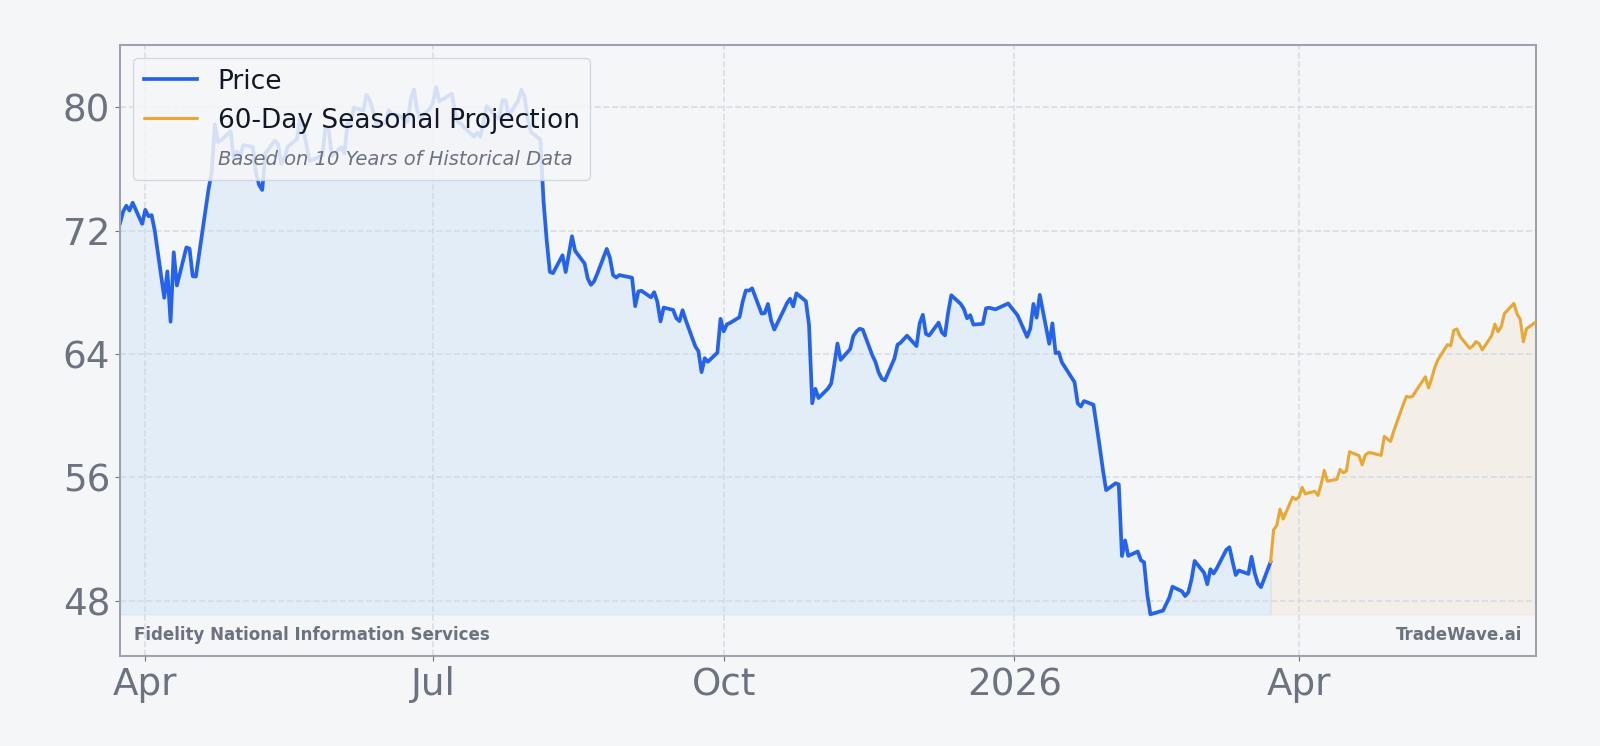
The chart below situates the latest move in its recent multi-month context and overlays the next 60 days of seasonal projection.
What to watch in this window
The first test is whether FIS can reclaim its 50-day moving average near $53.24 early in the window. Historically, stronger years in this pattern have seen the stock push through nearby resistance and hold those gains into the back half of the 58 days, while weaker but still positive years have struggled to clear obvious technical ceilings.
Second, watch how the stock behaves on pullbacks. Prior cycles show that intraperiod drawdowns of 4% to 6% have been common, and in 2025 the worst drop exceeded 10% before the trade finished higher. If this year’s window sees similar dips that are quickly bought, it would rhyme with the historical script. A deeper slide that fails to recover by the end of the window would mark a clear break from the decade-long pattern.
Third, governance and legal headlines remain a wild card. Any follow-up to the Halper Sadeh investigation or new shareholder actions could inject volatility into a period that has otherwise been friendly to long holders in the past.[1] How the stock trades around such news, if it appears, will help show whether the seasonal tendency can overpower idiosyncratic risk this time around.
Finally, keep an eye on volume and participation. The best historical years in this window have often coincided with strong upside follow-through after early gains, while choppier years have seen rallies fade quickly. If FIS starts to climb and volume expands rather than dries up, it would be one more sign that this 10-for-10 spring pattern still has life.