Walmart (WMT) Has Gone 10-for-10 in This 220-Day Window, Averaging 17.24% Gains
Walmart is trading just under its 52-week high as it enters a long seasonal stretch that has delivered gains in every one of the past 10 years.

Seasonal window
Walmart has posted gains in this 220-day calendar stretch in 10 of 10 years, averaging a 17.24% profit for long positions. The latest iteration of that window begins today with the stock at $120.72, about 10.4% below its 52-week high of $134.69 and coming off a modest 4.05% pullback over the past month. That combination of a flawless seasonal record and a stock that has cooled slightly from recent highs gives traders a clean test of whether this pattern still has teeth.
A combined view of net returns with peak run-ups and worst drawdowns shows how far Walmart has tended to travel inside this window.
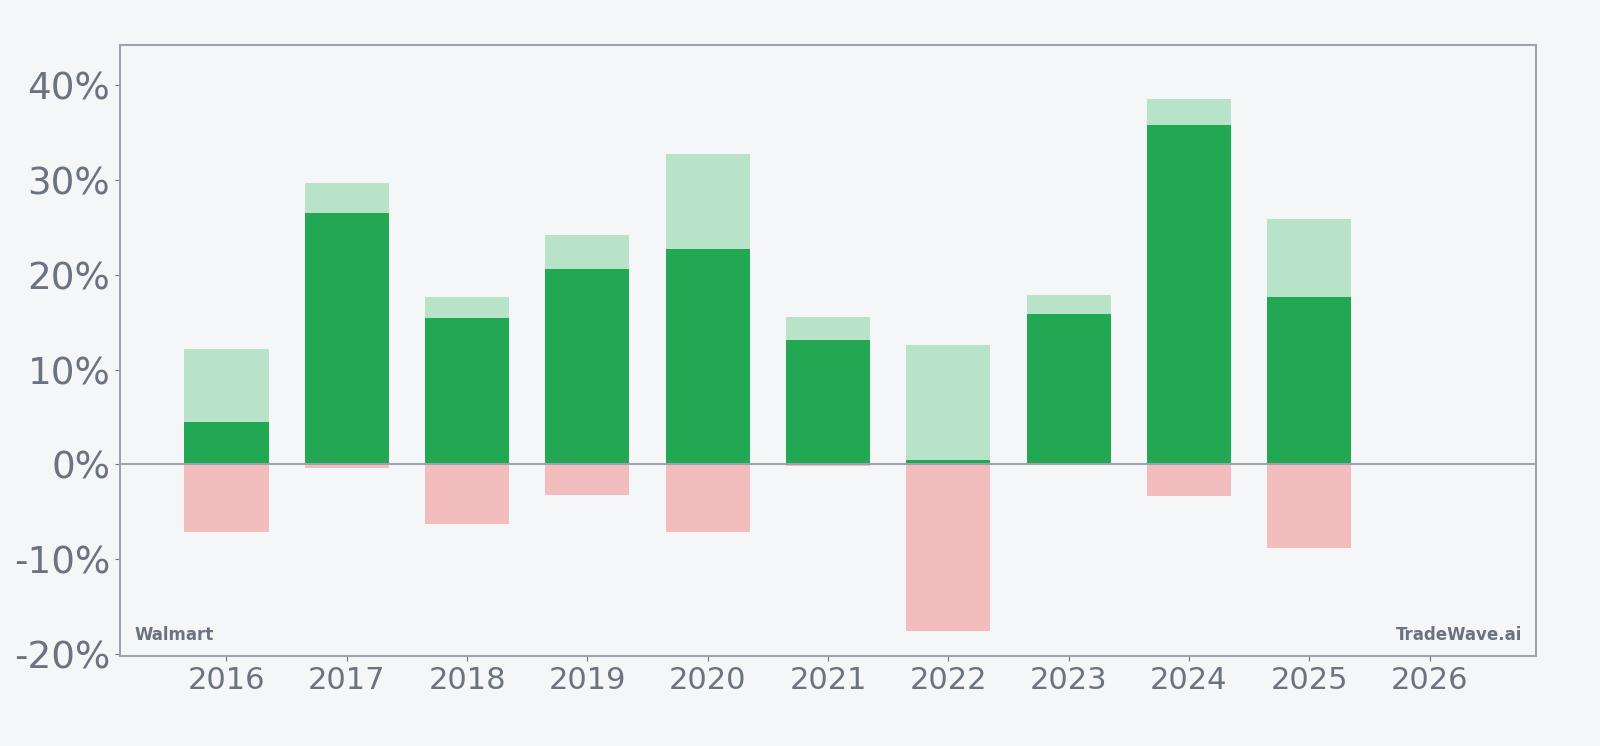
Across the decade, the trade direction for this pattern is firmly long, with every single year finishing positive and the median profit at 16.74%. Average gains of 17.24% in winning years line up closely with the 17% average when all years are included, which is what you expect when there are no losers in the sample. The Sharpe ratio of 1.45 points to a strong risk-adjusted profile based on end-of-window outcomes rather than just raw volatility.
The intraperiod swings are where the story gets more nuanced. In the strongest year, 2024, Walmart logged a 35.74% net gain with a maximum favorable move of 38.46% from entry, while the worst drawdown inside that window was limited to 3.32%. By contrast, 2022 finished barely positive at 0.45% but saw a maximum adverse move of 17.6% from the starting point, showing that even a winning year in this pattern can involve a deep dip before recovering.
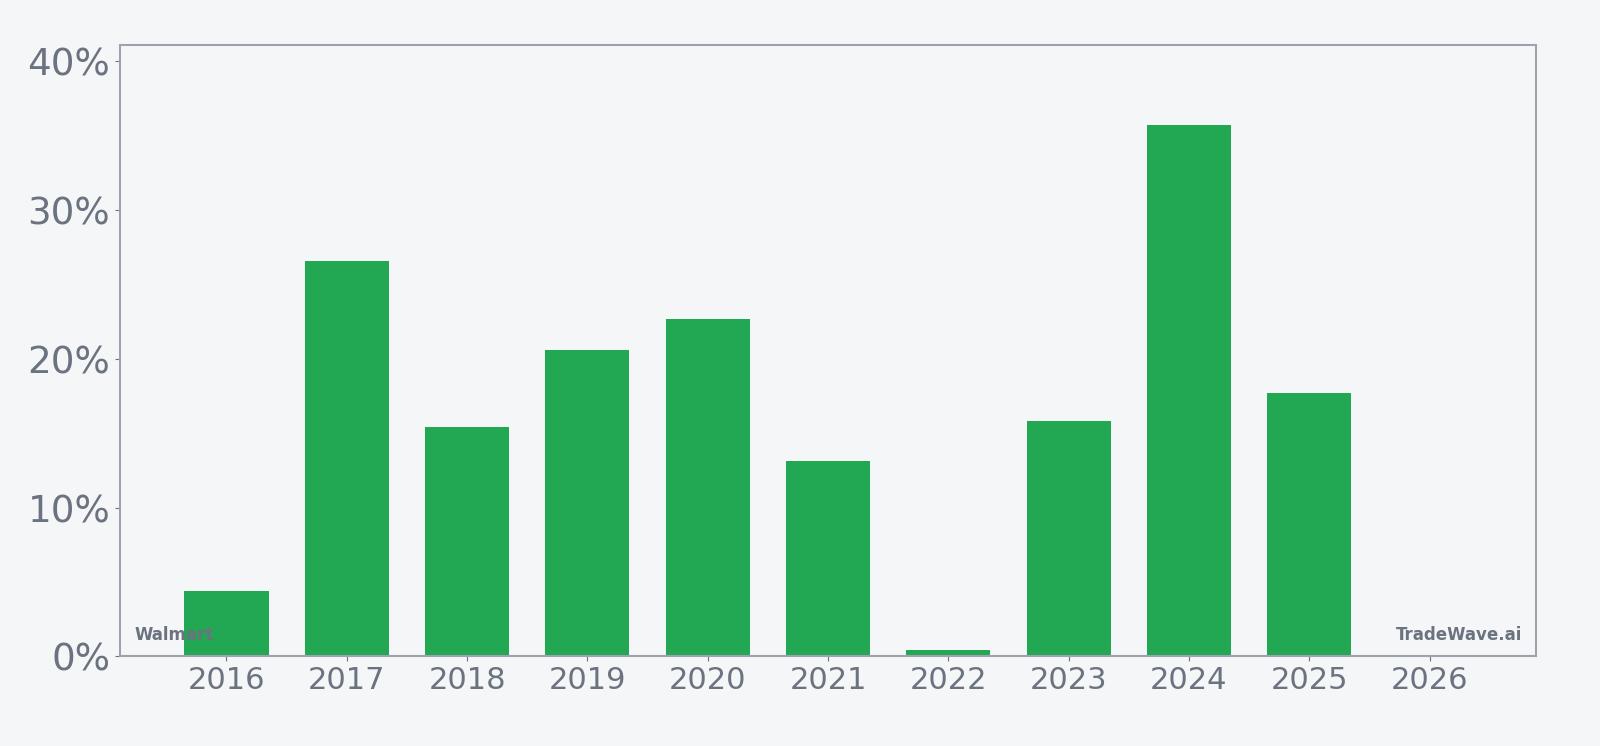
Looking at the per-year profile, the weakest outcome by net return was that 0.45% gain in 2022, while the standout year was 2024 with a 35.74% rise from entry to exit. Several other years, including 2019 and 2020, delivered net gains above 20% with maximum favorable moves north of 24%, which lines up with the TradeWave Ratio of 2.26 that captures how far price typically travels in the trade direction within the window. The mix of large maximum favorable moves and sometimes chunky maximum adverse moves points to a window that has historically rewarded patience but not without volatility along the way.
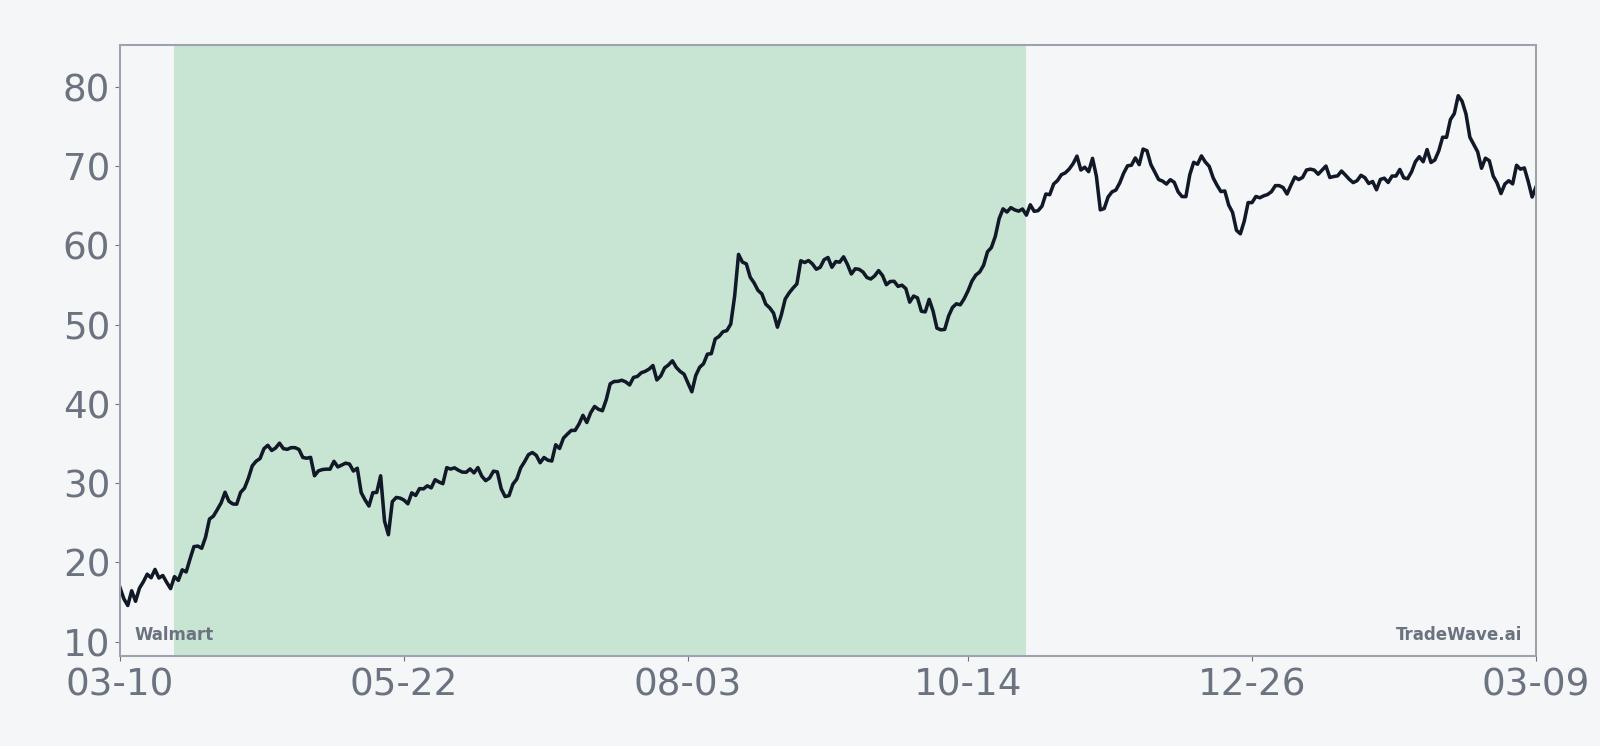
The ten-year average seasonal trend slopes higher for most of the 220 days, with only modest flat spots rather than long choppy stretches. The cumulative pattern suggests that gains have tended to build over time instead of arriving in a single burst, which matters for investors who care about the path as much as the destination. Add it up: 374% cumulative return across ten iterations is a rare record for a mega-cap retailer in any defined slice of the calendar.
History does not guarantee future results, and even in a window with no losing years, maximum adverse moves have at times been large before the stock recovered.
Price and near-term drivers
Walmart shares closed Tuesday at $120.72, up 1.4% on the day, with roughly 22.1 million shares changing hands against a 20-day average volume of about 21.3 million. That leaves the stock about 10.4% below its 52-week high of $134.69 and well above its 52-week low near $78.73, a range that reflects how far the name has run since late 2024.
The chart below situates the latest move against the past year of trading and a short-term seasonal projection.
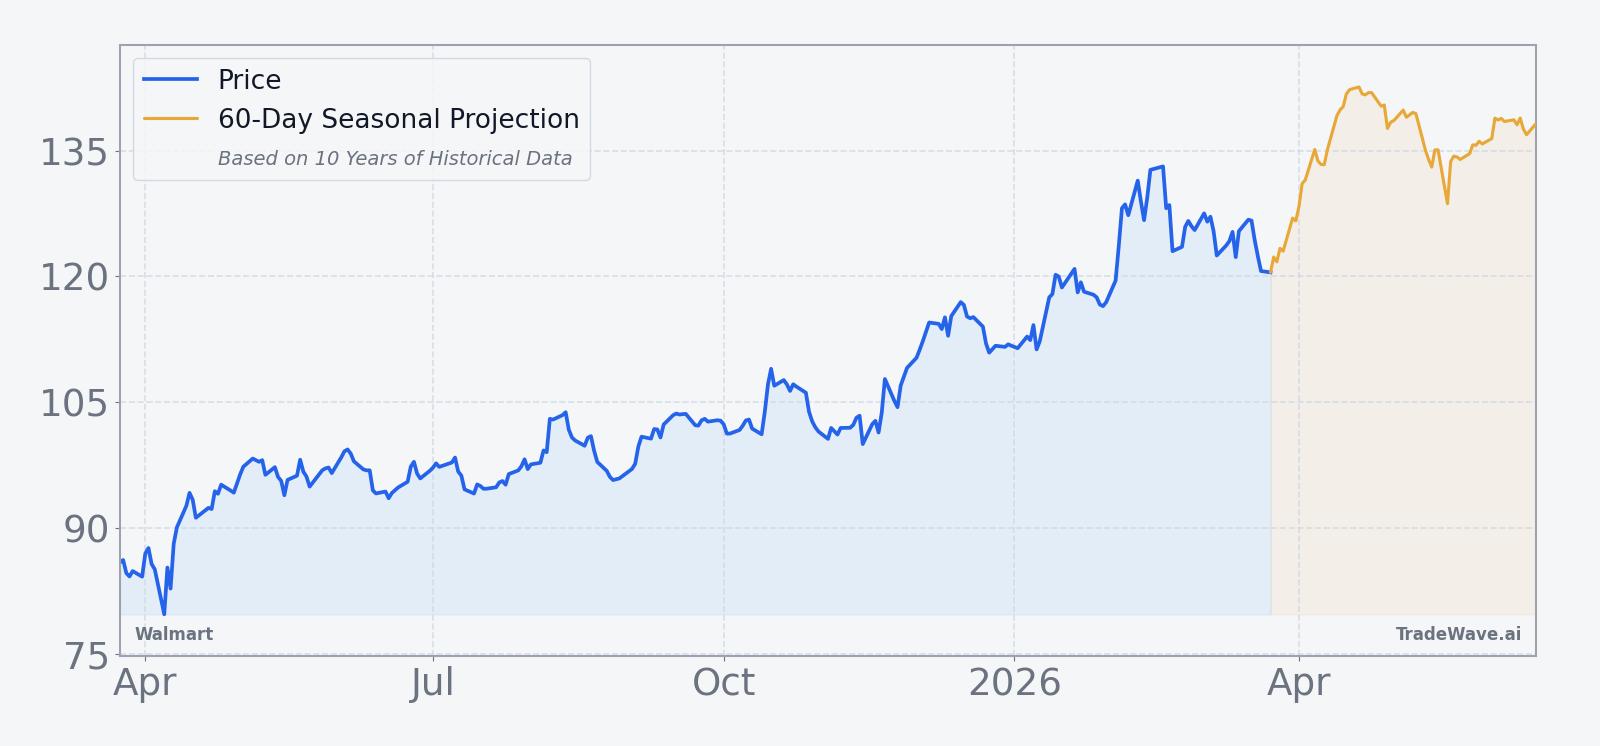
The stock’s latest leg higher follows a stretch in February when Walmart reported its holiday-quarter results and updated guidance. The company delivered a solid quarter but paired it with a profit outlook that some investors saw as conservative, which briefly knocked the shares off their highs before buyers stepped back in.[1][5] Even with that wobble, the stock has held onto most of its multi-month advance.
In early February, analysts highlighted three main drivers behind Walmart’s climb to all-time highs: resilient grocery demand, continued e-commerce growth and the company’s push into higher-margin businesses such as advertising and membership services.[7] Those themes remain central to the bull case as the retailer leans on its scale to navigate a shifting consumer backdrop.
Earnings and guidance backdrop
Walmart’s most recent earnings update centered on the fiscal fourth quarter, with Wall Street looking for earnings per share of $0.74 and revenue of $176.16 billion, up 11% and 4% year over year respectively.[1][5] The company framed that performance against a backdrop of steady U.S. retail sales, which helped reassure investors that consumers were still spending despite a cooler labor market.[1]
Management guided for full-year net sales growth of 4.8% to 5.1% and adjusted EPS between $2.58 and $2.63, a range that implies continued expansion but not a breakneck acceleration.[1][5] For a stock that has already re-rated higher, that kind of guidance tends to keep the focus on execution and margin mix rather than pure top-line surprise. The seasonal window that just opened will capture the next four quarters of reporting, so how Walmart threads that needle on each call will matter for how closely the stock tracks its historical pattern.
Macro and sector context
On the macro side, Walmart still sits at the center of the U.S. consumer story. Analysts have pointed out that the retailer benefits when shoppers trade down in response to inflation or a softer job market, since its scale and grocery footprint make it a default destination for value-focused households.[2] That dynamic has helped the company hold share even as the broader retail landscape has become more competitive.
Within big-box retail, Walmart continues to face pressure from Target and Amazon, particularly online, but it has leaned on grocery, curbside pickup and marketplace initiatives to defend its position.[4] In January, one analysis framed the stock as facing “risk ahead” after a strong run, arguing that expectations had crept higher even as competition remained intense.[6] That tension between structural strength and valuation risk is the backdrop against which this unusually strong seasonal window is unfolding.
Valuation and positioning
Valuation views on Walmart are split. A Forbes analysis using Trefis data pegged consensus at a “Sell” rating with a price target around $83, a level that sits far below the current $120 handle and reflects an earlier price regime rather than today’s trading range.[4][6] That disconnect underscores how quickly the stock has moved relative to some published models.
At the same time, commentary around the stock’s climb to all-time highs in February focused less on traditional multiples and more on the durability of its new growth engines, from digital advertising to marketplace fees.[7] For investors who see Walmart as a defensive compounder rather than a classic value play, the seasonal pattern offers another lens on how the stock has historically behaved once it reaches elevated levels.
According to historical data from TradeWave.ai, this particular 220-day stretch has behaved very differently from an average year for Walmart, and the new window that starts today gives traders a fresh chance to see whether that pattern holds.
What to watch as this window unfolds
For the next 220 trading days, the key question is whether Walmart can extend a streak that has produced gains in every one of the past 10 cycles. The historical record shows a clear long bias with sizeable average profits, but also years like 2022 where the stock sank more than 17% from entry before clawing back to a small gain. How the stock behaves on pullbacks from here will tell you whether this iteration is tracking closer to the smoother years or the more volatile ones.
On the fundamental side, the next few earnings reports will be crucial. Watch whether net sales growth stays in the 4.8% to 5.1% corridor and whether adjusted EPS lands inside the $2.58 to $2.63 range that management has laid out.[1][5] Upside surprises on margins or high-margin businesses could help the stock lean into its historical seasonal strength, while any sign of consumer fatigue or competitive pressure could test that pattern.
From a levels perspective, the 52-week high near $134.69 is the obvious line in the sand on the upside, while the 50-day moving average around $123.71 and the recent one-month low zone just under $119 are the first areas to watch on any dip. A break above the prior high early in the window would echo some of the stronger historical years, whereas a deeper slide that resembles the 2022 drawdown would not automatically break the pattern but would raise the stakes for a later recovery.
Finally, keep an eye on how Walmart trades around macro data on consumer spending and labor, since those releases have often shaped sentiment into and out of earnings.[2] If the stock can absorb softer data and still grind higher across this long seasonal stretch, it would reinforce the idea that the 10-for-10 record is capturing something structural about how investors treat the name. If instead rallies keep stalling well below the old highs, it may be a sign that the seasonal tailwind is running into a valuation ceiling.
Key takeaways
- Walmart has finished this 220-day seasonal window higher in 10 of 10 years, with an average profit of 17.24% for long positions.
- The 2026 window starts today with WMT at $120.72, about 10.4% below its 52-week high and coming off a 4.05% one-month pullback.
- All years in the sample were winners, but intraperiod drawdowns have been meaningful at times, including a 17.6% adverse move in 2022 before a small gain.
- The strongest year, 2024, delivered a 35.74% net gain with a maximum favorable move of 38.46%, highlighting the upside potential when the pattern clicks.
- A Sharpe ratio of 1.45 and a TradeWave Ratio of 2.26 point to a historically strong, trend-friendly window for long exposure, albeit with volatility along the way.
- Upcoming earnings and consumer-spending data will be key tests of whether this cycle can keep the 10-for-10 streak intact.
Sources
- Seeking Alpha: Walmart turns lower after profit outlook overshadows solid holiday quarter (Feb 19, 2026)
- Reuters: Walmart's earnings report will test investor confidence in US market (Aug 19, 2025)
- CNBC: Check out Walmart's stock price (WMT) in real time (Dec 30, 2025)
- Forbes: Buy Or Sell Walmart Stock? (Jan 21, 2026)
- CNBC: Walmart will report earnings before the bell. Here's what to expect (Feb 19, 2026)
- Forbes: Walmart Stock Forecast: Why Analysts See Risk Ahead (Dec 22, 2025)
- Forbes: Walmart Stock At All-Time Highs: 3 Drivers To Watch (Feb 9, 2026)
- CNBC: Walmart charts show four bullish patterns forming in the retail giant (Oct 15, 2025)