Newmont (NEM) Has Rallied in 10 Straight 21-Day Spring Windows Starting Mar. 25
Newmont just stepped into a 21-day stretch that has delivered gains every year for a decade, as the gold miner trades near $99 with a bullish Street backdrop and firm gold prices.

Key takeaways
- Newmont has finished higher in this 21-day window in 10 of 10 years, with no losing seasons and an average gain of 8.9% for the long setup.
- The current window runs from Mar. 25 through late April, overlapping a period when the stock’s best years have posted double-digit advances.
- Percent Profitable sits at 100%, with 10 winners and 0 losers, and a TradeWave Ratio of 1.43 that points to meaningful intraperiod travel in the trade direction.
- Average winners have seen sizable peak run-ups, but some years still showed adverse swings of roughly mid-single digits before finishing positive.
- Newmont trades around $99 after a near 1% daily gain, with a Street consensus Buy rating and a $125 price target that reflects optimism on 2026 production and cash flow.
- Higher gold prices and a strong balance sheet give this seasonal window a supportive macro and fundamental backdrop, but drawdowns inside the window have historically been sharp at times.
According to historical data from TradeWave.ai, this late-March window has behaved very differently from an average month for Newmont. The next section looks at how that pattern has played out over the past decade and what it means for the current stretch.
Seasonal window
Newmont has risen in 10 of 10 years during this 21-day window starting Mar. 25, averaging 8.9% gains for the long trade. The stock opened this year’s iteration around $97 and finished Wednesday at $99.02, up 0.9% on the day as it trades well above last year’s lows but still far from its 52-week high of about $134.34.[1]
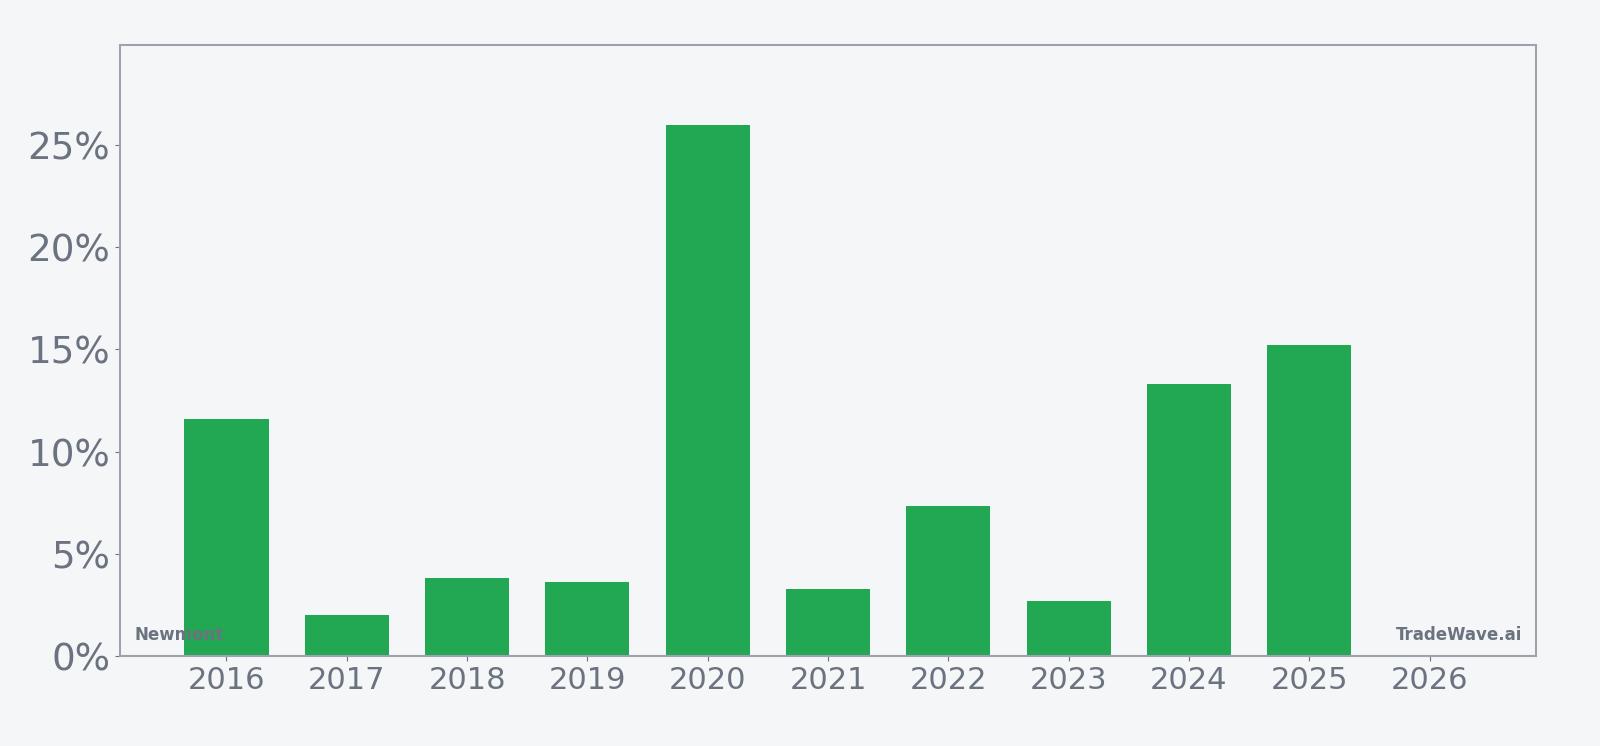
Across the 10-year sample, the strongest season came in 2020, when Newmont gained 25.98% in the window, while the softest year was 2017 with a still-positive 2.01% net return. Average profit of 8.9% reflects that even the quieter years have tended to finish green, while the bigger upswings have pulled the overall average higher.
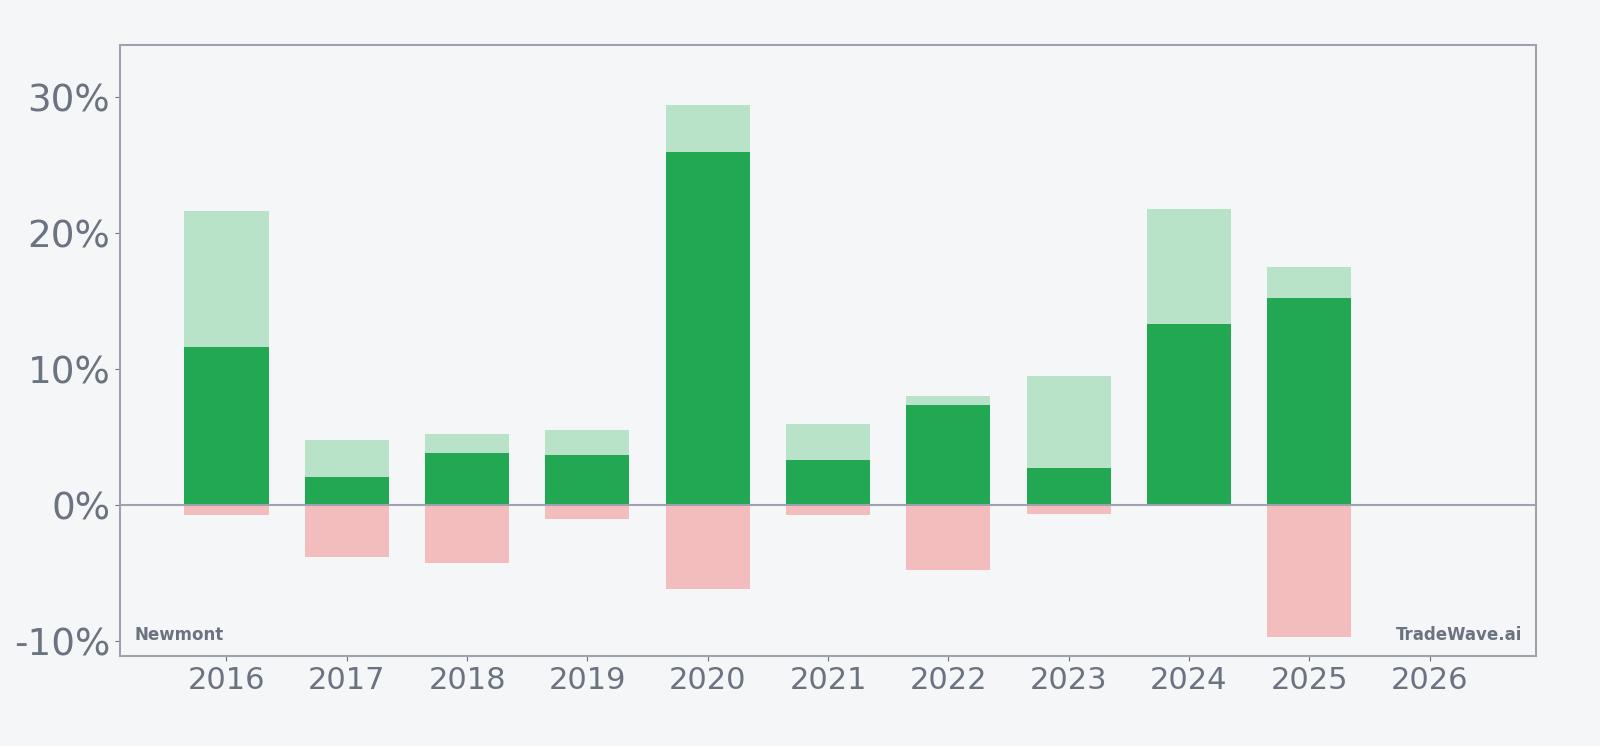
The intraperiod path has not been a straight line. In 2025, for example, the stock finished the window up 15.23% but endured a worst drawdown of 9.71% from the entry before recovering, illustrating how the maximum adverse move can be sizable even in a winning season. On the flip side, several years, including 2016 and 2024, saw maximum favorable moves above 20%, showing how far price has sometimes run in the trade direction before the window closed.
A stacked view of net returns alongside peak run-ups and worst drawdowns shows how upside and downside have coexisted inside this window.
The TradeWave Ratio of 1.43 signals that, on average, Newmont has traveled meaningfully in the long direction during the window relative to its typical volatility. Combined with a Sharpe ratio of 1.13 based on end-of-window outcomes, the pattern has historically rewarded long exposure more often than not, even though some years featured mid-window shakeouts before the final push higher.
History does not guarantee future results; adverse excursions can be large even in winning windows, and traders still face the risk that this year breaks the pattern.
Price and near-term drivers
Newmont shares closed Wednesday at $99.02, up 0.88 on the day for a 0.9% gain, after trading between $95.42 and $99.44 on volume of about 14.1 million shares.[1] The stock sits well above its 52-week low near $41.83 but remains about 26.3% below its 52-week high around $134.34, with the 50-day moving average up at roughly $117.26 and 20-day average volume near 12.4 million shares, underscoring how far the stock has to climb before retesting last year’s peak.[1]
Fresh fundamental momentum has helped set up this year’s seasonal window. In late February, analysts at RBC Capital Markets upgraded Newmont and highlighted a consensus Buy rating with a $125 price target, a level that implies meaningful upside from current prices and reflects confidence in the company’s ability to convert higher gold prices into earnings and cash flow.[1] That call followed a strong finish to 2025, when Newmont delivered robust fourth-quarter earnings, including adjusted earnings of $2.52 per share on $6.8 billion in revenue and strong free cash flow, helped by higher bullion prices and tighter cost control.[4]
Newmont’s balance sheet and operations also look sturdier heading into 2026. The company reported that third-quarter 2025 earnings per share beat estimates by 32.56%, with record free cash flow of $1.6 billion and near-zero net debt, giving management more flexibility to invest in projects and return capital to shareholders.[1] Guidance points to production stabilization and improvement in 2026 as development projects, including the Ahafo North Mine, ramp up and efficiency gains filter through the cost base.[1]
Macro conditions have been a tailwind. Higher gold prices, supported by Federal Reserve rate cuts and ongoing geopolitical tensions, have boosted Newmont’s profitability and reinforced the bull case for large-cap gold miners.[1] Sector commentary has emphasized that Newmont is benefiting from both robust financial health and operational improvements across the metals and mining space, positioning it as a key way to play the current gold cycle.[3]
There are still cross-currents. In December 2025, director Bruce Brook sold shares of Newmont, a move that drew attention to insider activity even as the broader thesis around gold and the company’s project pipeline remained constructive.[7] Earlier in 2025, Newmont also sold its entire stake in Orosur Mining for $5.55 million, a portfolio move that streamlined its asset base and sharpened focus on core operations.[3]
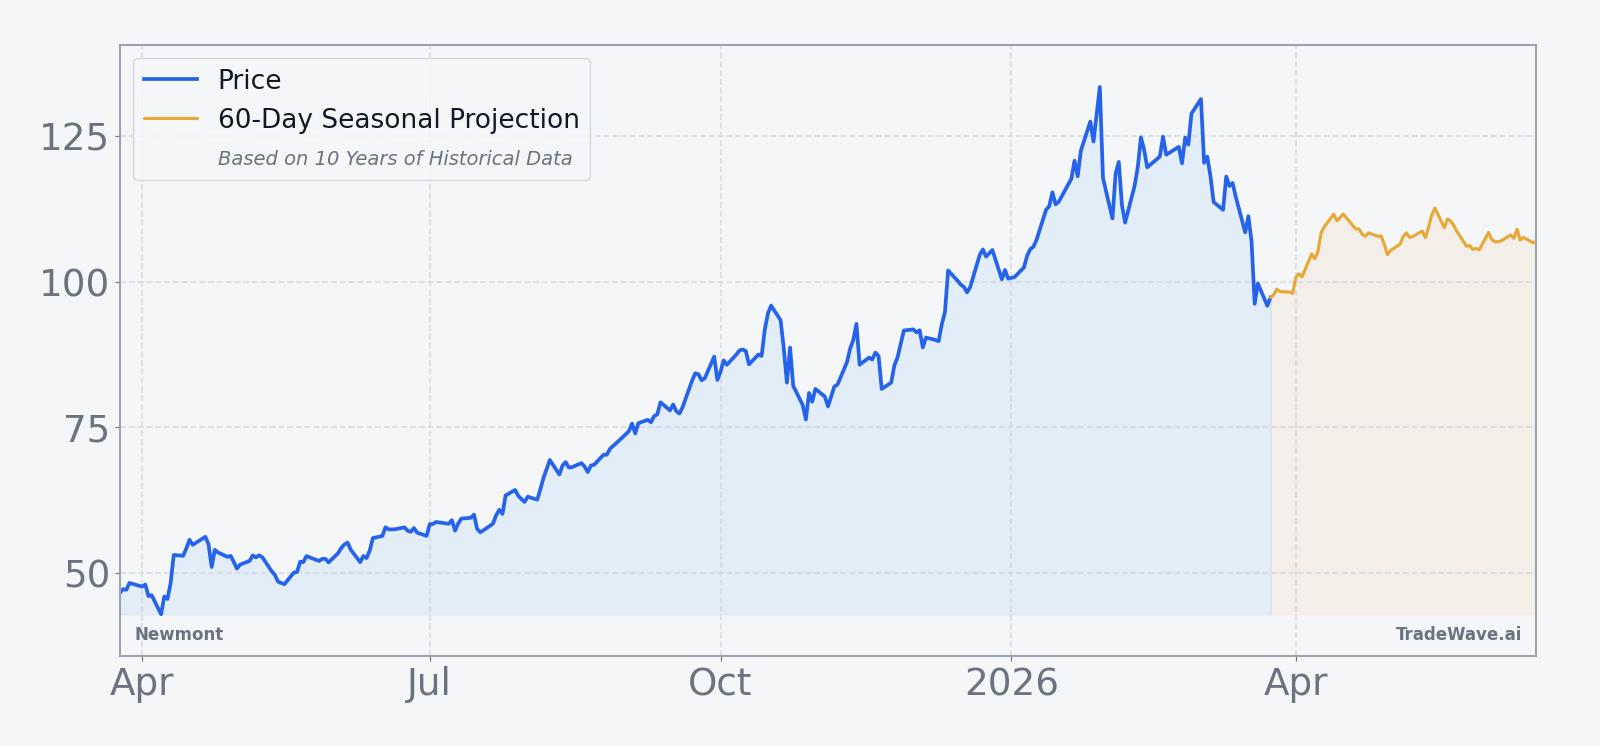
The chart below situates the latest move in its recent multi-month context and overlays the next 60 days of seasonal tendencies.
What to watch in this window
The next three weeks will test whether Newmont can extend its 10-for-10 record in this late-March window. The key reference points are the recent low near $95 and the 50-day moving average around $117; how the stock behaves between those levels will show whether this season’s path tracks the historical pattern or diverges.
Earnings timing is another focus. While the next formal earnings date has not yet been set, investors will be watching for any updates on 2026 production guidance, especially around Ahafo North and other development projects that management has flagged as drivers of stabilization and improvement.[1] Any revision to capital spending plans or cost assumptions could either reinforce or undercut the bullish seasonal backdrop.
On the macro side, gold prices and Fed expectations remain the main swing factors. If bullion holds its recent gains or pushes higher on further signs of easing policy or geopolitical stress, Newmont’s leverage to the metal could help the stock behave more like the stronger historical years in this window.[1] A sharp pullback in gold, by contrast, would make it harder for the stock to repeat the double-digit advances seen in 2016, 2020, 2024 and 2025.
Finally, traders will be monitoring insider and capital allocation signals after last year’s director sale and portfolio reshuffling.[3][7] A steady or rising dividend, continued debt discipline and limited insider selling would align with the bullish seasonal tendency, while aggressive equity issuance or a pickup in insider selling could be an early sign that this year’s window may not follow the script.
Sources
- [1] Finviz – Newmont Corporation (NEM): A Bull Case Theory (Feb. 28, 2026).
- [2] GuruFocus – Newmont (NEM) Surpasses Q2 Profit Expectations on Bullion Gains (Jul. 27, 2025).
- [3] GuruFocus – Newmont (NEM) Sells Entire Stake in Orosur Mining for $5.55M (Aug. 1, 2025).
- [4] Forbes – Newmont Ends 2025 Strong — 2026 In Focus (Feb. 26, 2026).
- [7] GuruFocus – Insider Sell: Bruce Brook Sells Shares of Newmont Corp (NEM) (Dec. 4, 2025).