APA Corporation (APA) Near 52-Week High as 42% Monthly Surge Meets Bullish Midterm Window
APA Corporation is approaching an early-April midterm-year window that has usually delivered quick gains, just as the stock trades within a whisker of its 52-week high.

Key takeaways
- APA Corporation’s early-April midterm-year window has been positive in 7 of the last 8 cycles, a historically strong bullish stretch.
- The 8-day window starting Apr 12 has delivered an average gain of 6.45% in winning years and 5% across all years combined.
- The pattern is long-only, with 88% Percent Profitable, 7 winners and just 1 loser in the sample.
- Intraperiod swings have been meaningful, with some years showing double-digit peak run-ups and others seeing a few percent drawdown before recovering.
- APA closed at 40.80 on Mar 24, about 1.6% below its 52-week high of 41.45, after a 42.56% surge over the past month.
- History suggests a fast-moving window where upside has tended to dominate, but adverse moves inside the pattern can still be sharp.
According to historical data from TradeWave.ai, this specific early-April stretch in midterm election years has behaved very differently from a typical month for APA Corporation, and the next iteration is now on the calendar.
Seasonal window
APA Corporation has risen in 7 of the last 8 midterm election years during the 8-day window that begins on Apr 12, averaging 6.45% gains in those winning runs. The stock heads toward that window trading at 40.80, about 1.6% below its 52-week high of 41.45 after a 42.56% jump over the past month. That combination of a strong election-cycle pattern and a stock already pressing new highs is the kind of setup short-term traders tend to watch closely.
The presidential election cycle matters here because APA’s pattern is not built from consecutive calendar years, but from the last eight times the United States was in a midterm election year. That lines up the analysis with a recurring policy backdrop of divided attention in Washington, shifting energy regulation debates and often choppy risk appetite across the broader market.
This seasonal window begins on Apr 12 and spans 8 trading days. Historically, during this period, APA Corporation has shown a strong bullish tendency when the country is in a midterm election year. The trade direction for the pattern is long, and the record is 7 winners against just 1 loser, for 88% Percent Profitable across the sample.
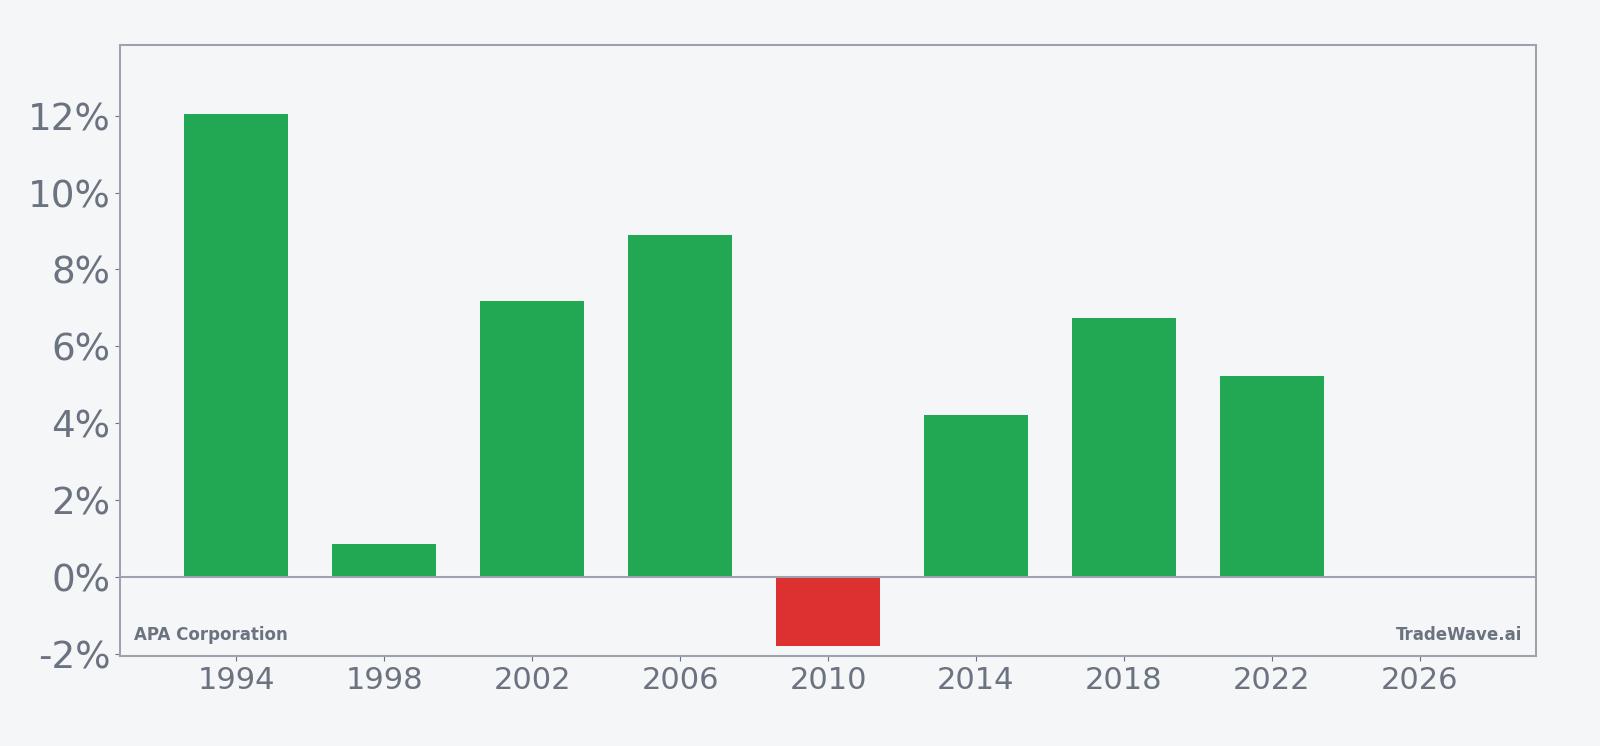
Average gains of 6.45% in winning years compare with a 5% average when the lone losing year is included, which means the single down outcome did not fully erase the strength of the winners. The weakest year in the sample, 2010, saw a net loss of 1.8%, while the strongest, 1994, delivered a 12.04% gain over the same 8-day stretch. That spread shows why traders treat this as a high-conviction but still volatile window rather than a slow grind higher.
The historical seasonal average trend for this window tilts higher almost from day one, with gains tending to build steadily rather than arriving in a single spike. In several years, including 1994 and 2018, the maximum favorable move came as the stock pushed higher early in the window and then consolidated into the close, a pattern that fits short, momentum-driven bursts.
The combined net, peak run-up and worst drawdown by year show how much APA has typically moved inside this window before the final result.
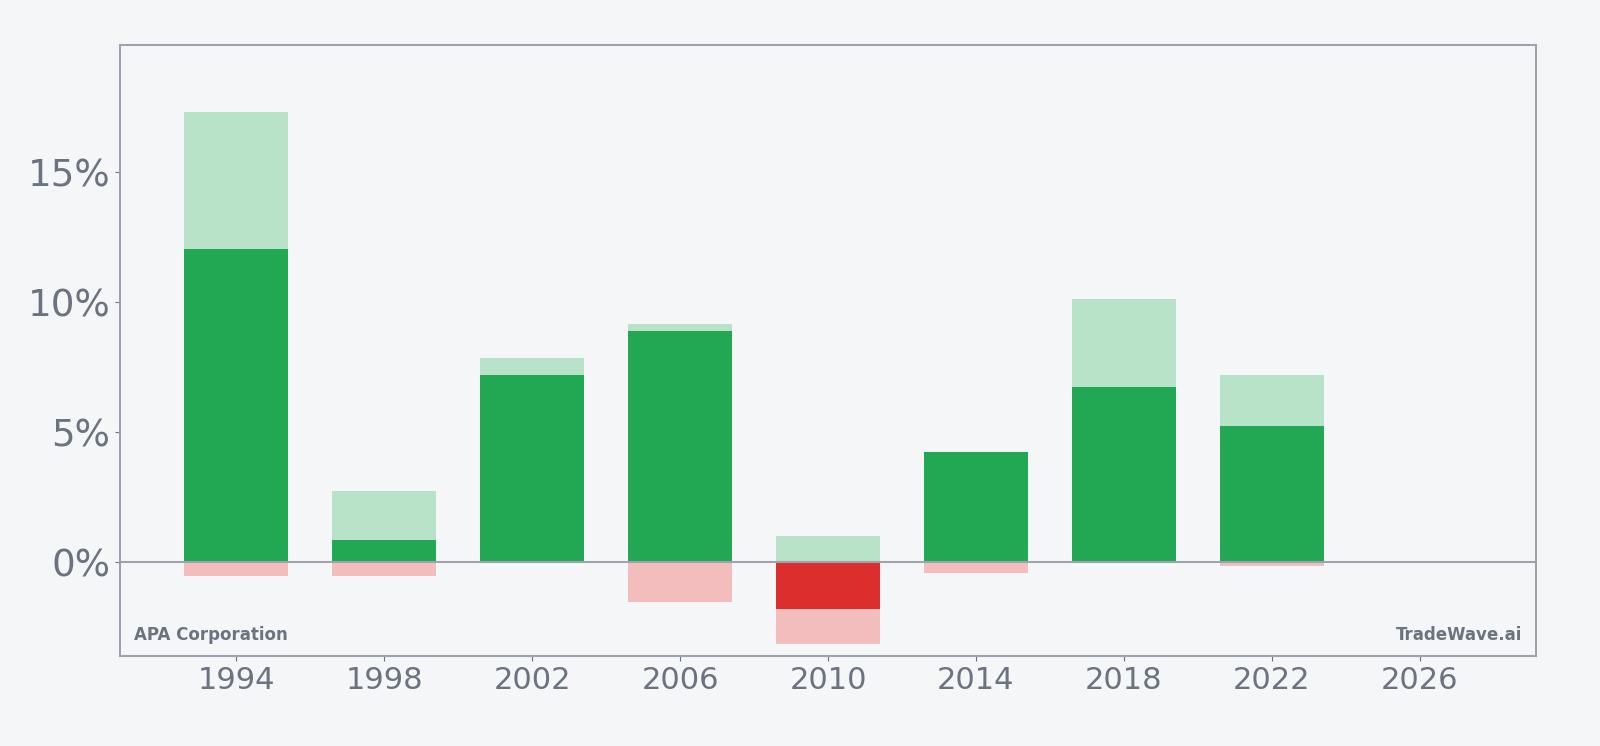
The per-year bars with maximum favorable and adverse excursions underline how active this window has been. In 1994, APA’s best intraperiod run-up reached 17.28% before settling back to a 12.04% gain, while in 2018 the peak move topped 10% with a final gain of 6.73%. On the downside, the worst drawdown in the sample was about 3.14% in 2010, and even some winning years saw temporary dips of around 1% to 2% before recovering, which fits the profile of a fast, directional trade that can still test conviction along the way.
History does not guarantee future results; adverse excursions can be large even in winning windows, and traders can experience meaningful drawdowns before any end-of-window gains materialize.
Price and near-term drivers
APA closed at 40.80 on Mar 24, up 4.54% on the day, extending a powerful 42.56% one-month rally that has carried the stock to within about 1.6% of its 52-week high of 41.45. Volume over the last 20 sessions has averaged just over 10.3 million shares, and Monday’s turnover of roughly 10.9 million shares sat slightly above that pace, suggesting the latest leg higher is not happening in a liquidity vacuum.
That surge has unfolded without a fresh fundamental catalyst in the public record, which leaves positioning and sentiment as likely drivers. APA is trading well above its 50-day moving average of roughly 29.57, a gap that signals a stretched but strong uptrend rather than a quiet base-building phase. For short-term traders, the question is whether that momentum can carry through the early-April window that has historically favored the long side, or whether the stock needs a breather first.
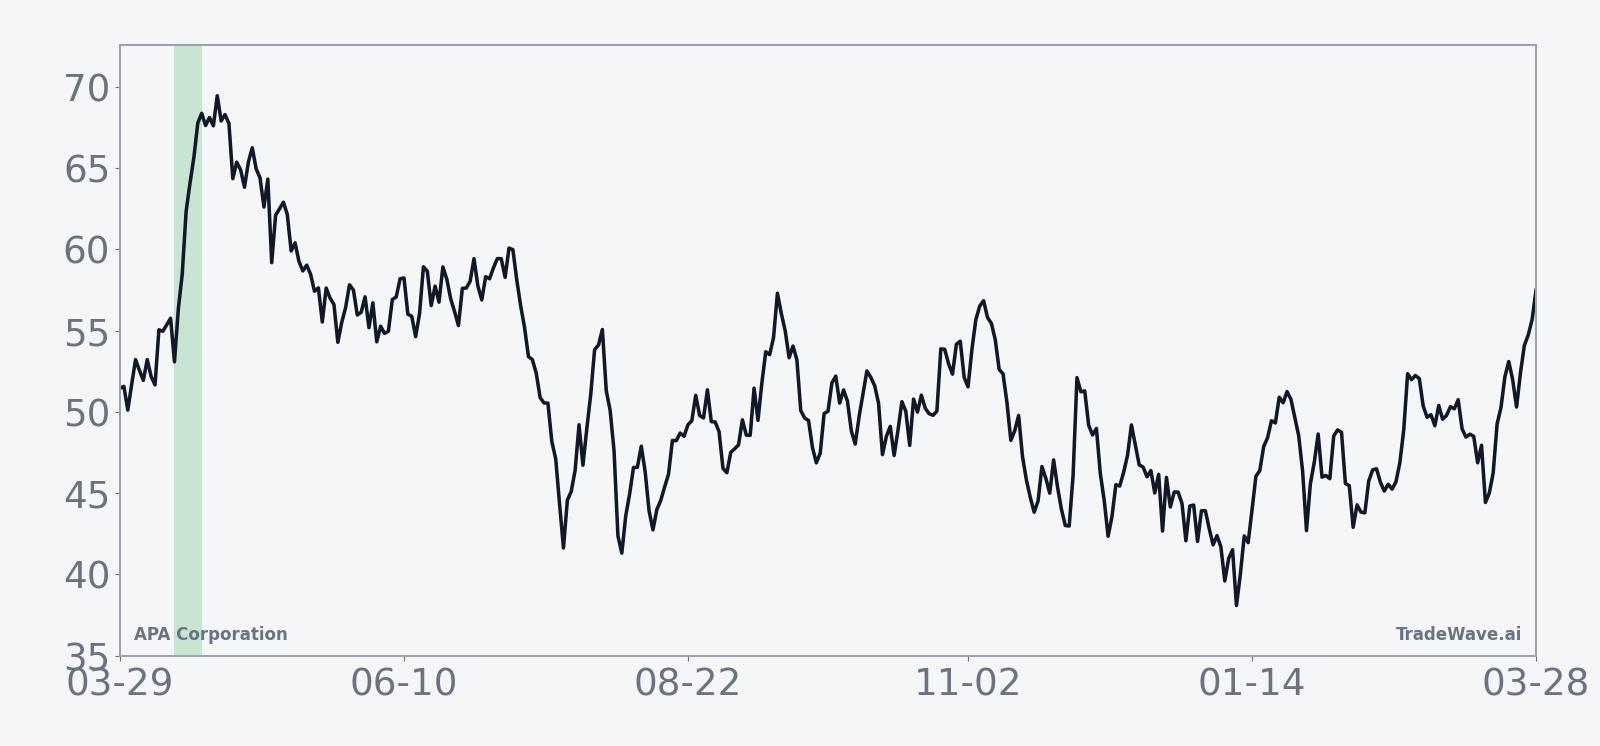
The chart below situates the latest move in its recent multi-month context and overlays the upcoming seasonal projection.
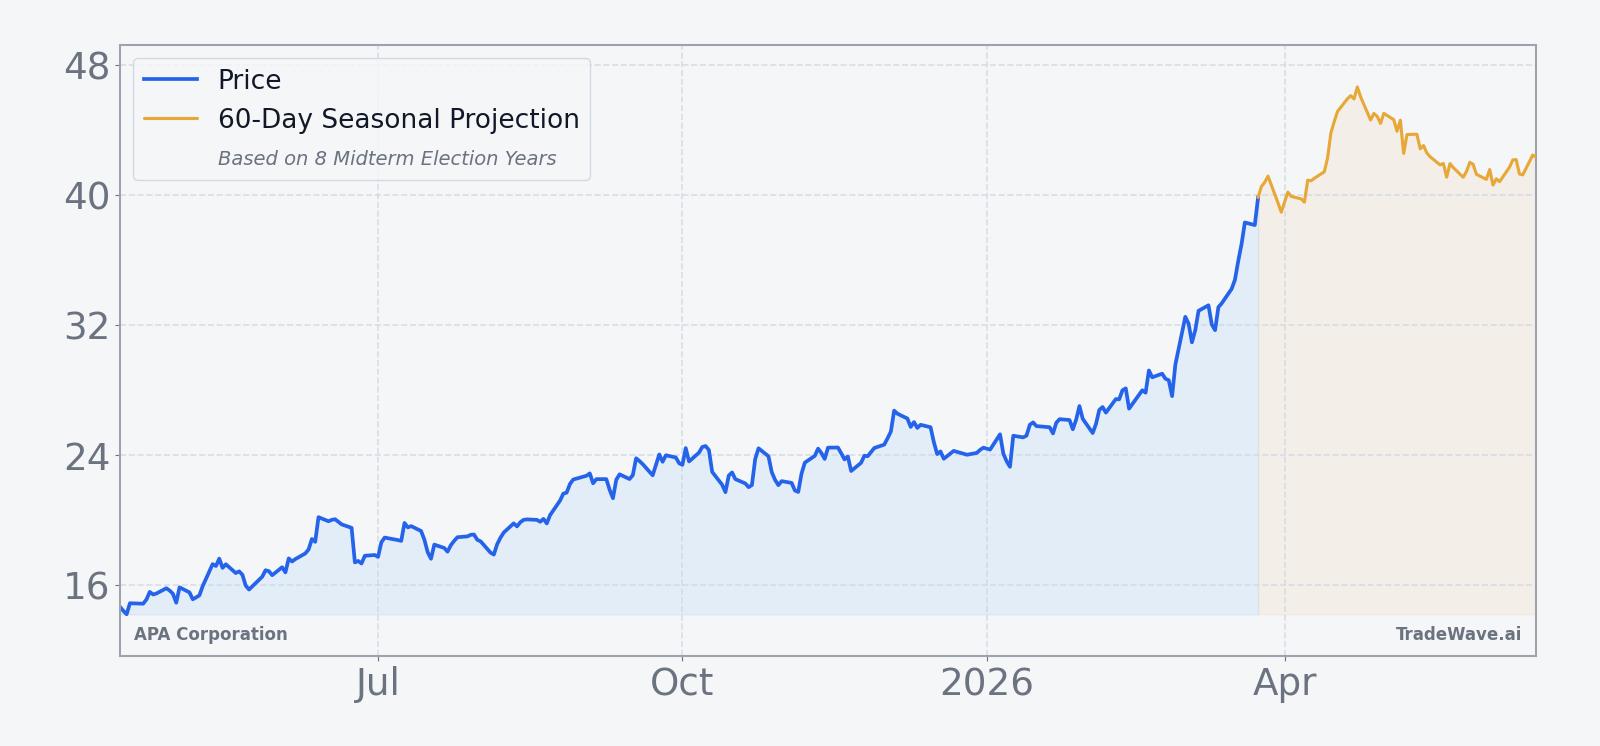
In Dec 2025, CNBC trader Joe Terranova disclosed that he had sold APA shares, a move that at the time hinted at caution among some fast-money players toward the name.[1] Since then, the stock has rebuilt momentum, and the current setup into the midterm-year window looks very different from the sentiment backdrop that prevailed when that sale was made.
What to watch as the window opens
The early-April midterm-year window for APA is short, intense and historically skewed to the upside, which makes the next few weeks a timing exercise rather than a slow macro story. The first marker is price behavior as Apr 12 approaches: if APA holds near or above its 50-day moving average gap and continues to respect the recent breakout zone around the low 40s, it would be consistent with prior strong cycles where the stock entered the window already in motion.
Inside the 8-day stretch itself, traders will be watching for whether gains start to accrue early, as they did in 1994 and 2018, or whether the stock delivers a brief shakeout similar to the 2010 pattern before recovering. A quick push toward or through the 52-week high with contained intraperiod drawdowns would rhyme with the historical profile of large maximum favorable moves and relatively modest worst-case dips. A deeper pullback of 3% or more inside the window would not be unprecedented, but it would mark a departure from the smoother winning years.
Macro and policy headlines will also matter, given the midterm election-year backdrop. Any shifts in energy policy, regulatory rhetoric or fiscal priorities that affect exploration and production names could either reinforce or fight the seasonal tendency. If volatility in APA spikes around such headlines while the stock still respects the historical pattern of finishing the window higher more often than not, it would suggest that the election-cycle effect is still in play. If instead the stock breaks decisively below recent support and fails to recover by the end of the window, that would be a clear sign that this midterm-year iteration is diverging from the past.
For traders who track sentiment, it is also worth monitoring whether high-profile investors who stepped away from APA in late 2025 re-engage or stay on the sidelines as the window unfolds.[1] Follow-through buying from institutions and active managers would align with the pattern’s long bias, while renewed selling into strength would argue that this cycle’s fundamentals are overpowering the usual seasonal tailwind.