Newmont (NEM) Has Rallied in 12 of 12 Late-March Windows as a 20-Day Bullish Stretch Opens
Newmont is heading into a 20-day late-March stretch that has never been a loser in the past 12 years, even as the stock trades well below its 52-week high and sentiment around gold miners stays divided.

Key takeaways
- Newmont has posted gains in 12 of 12 years during the 20-day window starting Mar 26, with an average profit of 7.7% for long exposure.
- The pattern is firmly bullish: 100% Percent Profitable, with 12 winners and 0 losers across the lookback period.
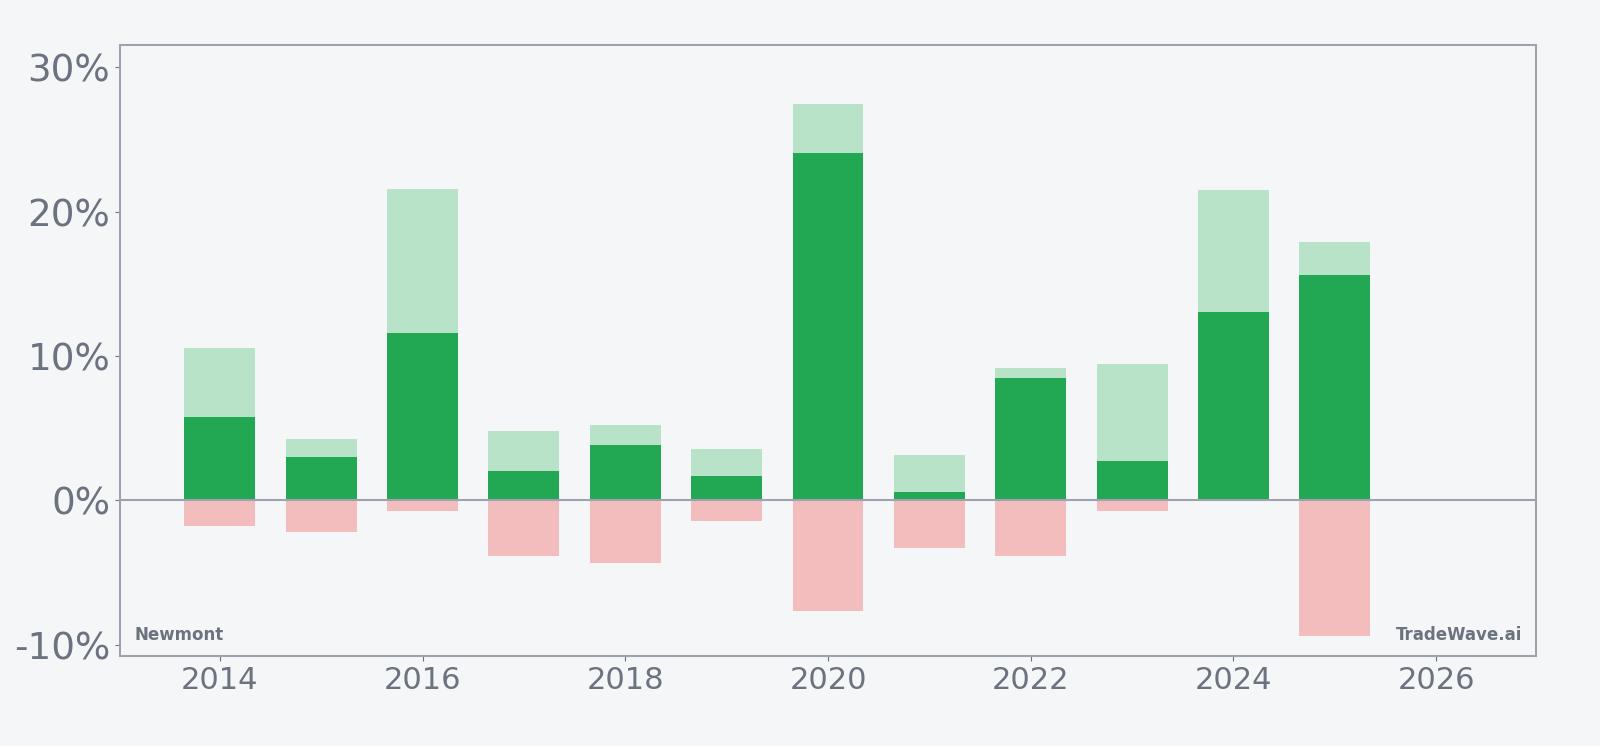
- Intraperiod swings have been meaningful, with some years showing double-digit maximum favorable moves alongside mid-single-digit drawdowns before finishing higher.
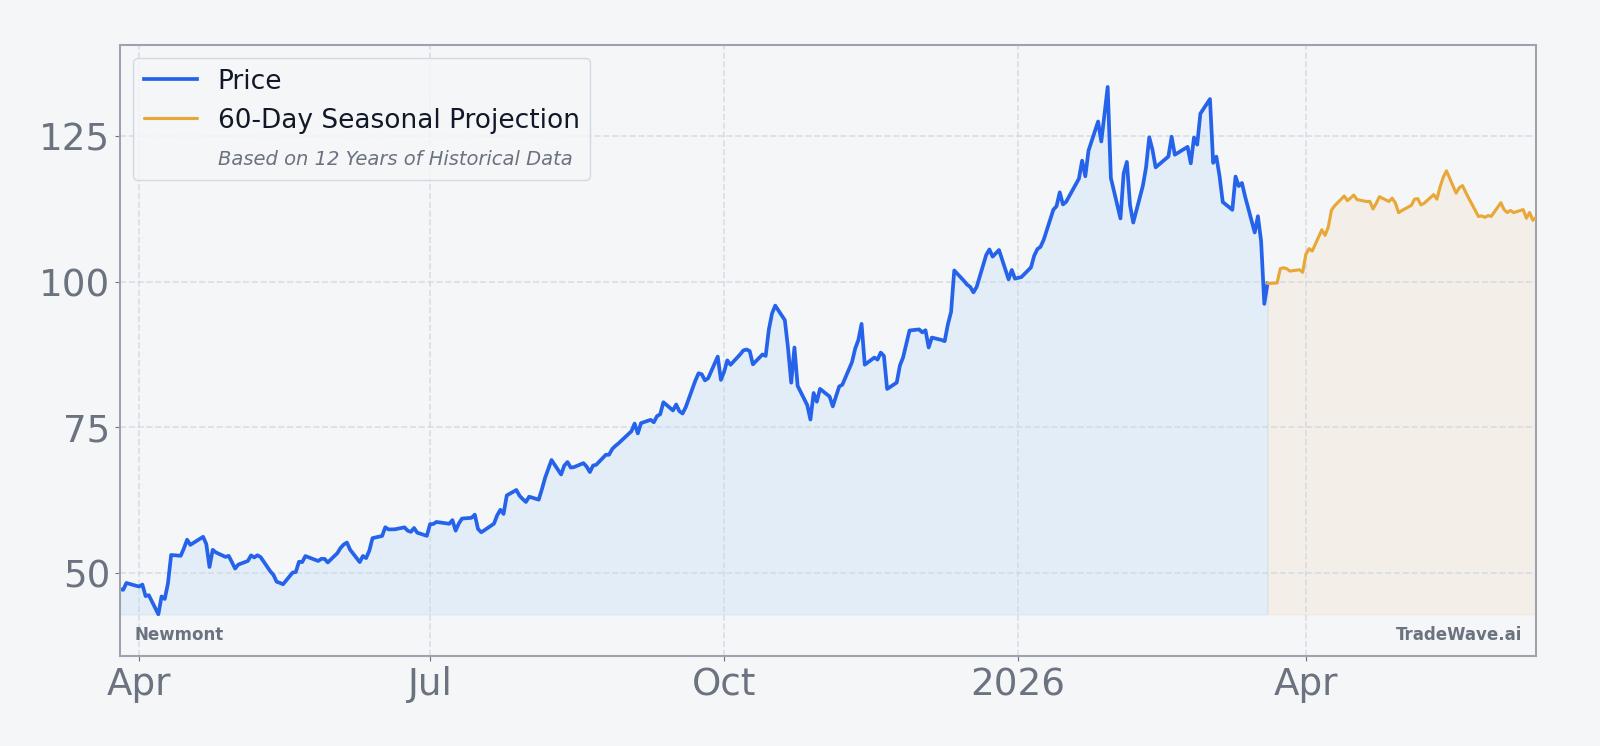
- Today NEM closed at $95.80, down 3.4% on the day and about 28.7% below its 52-week high, leaving room above if the seasonal tailwind repeats.
- Street research still leans positive on the miner, with an “Outperform” consensus and a $71.67 long-run target that reflects an earlier price regime and a constructive view on gold-linked cash flows.[1][4]
- Traders watching this window should focus on how NEM behaves around recent support levels and whether any renewed volatility lines up with the historical late-March pattern.
According to historical data from TradeWave.ai, this upcoming stretch has behaved very differently from an average month on the calendar for Newmont, and the next iteration is only days away.
Seasonal window
Newmont has risen in 12 of 12 years during the 20-day window that begins on Mar 26, averaging 7.7% gains for long positions. Today the stock closed at $95.80, down 3.4% on the session and about 28.7% below its 52-week high of $134.34, after a sharp pullback over the past month.[1][4] That combination of a clean winning streak and a stock trading well off its highs is what makes this particular late-March setup stand out on the calendar.
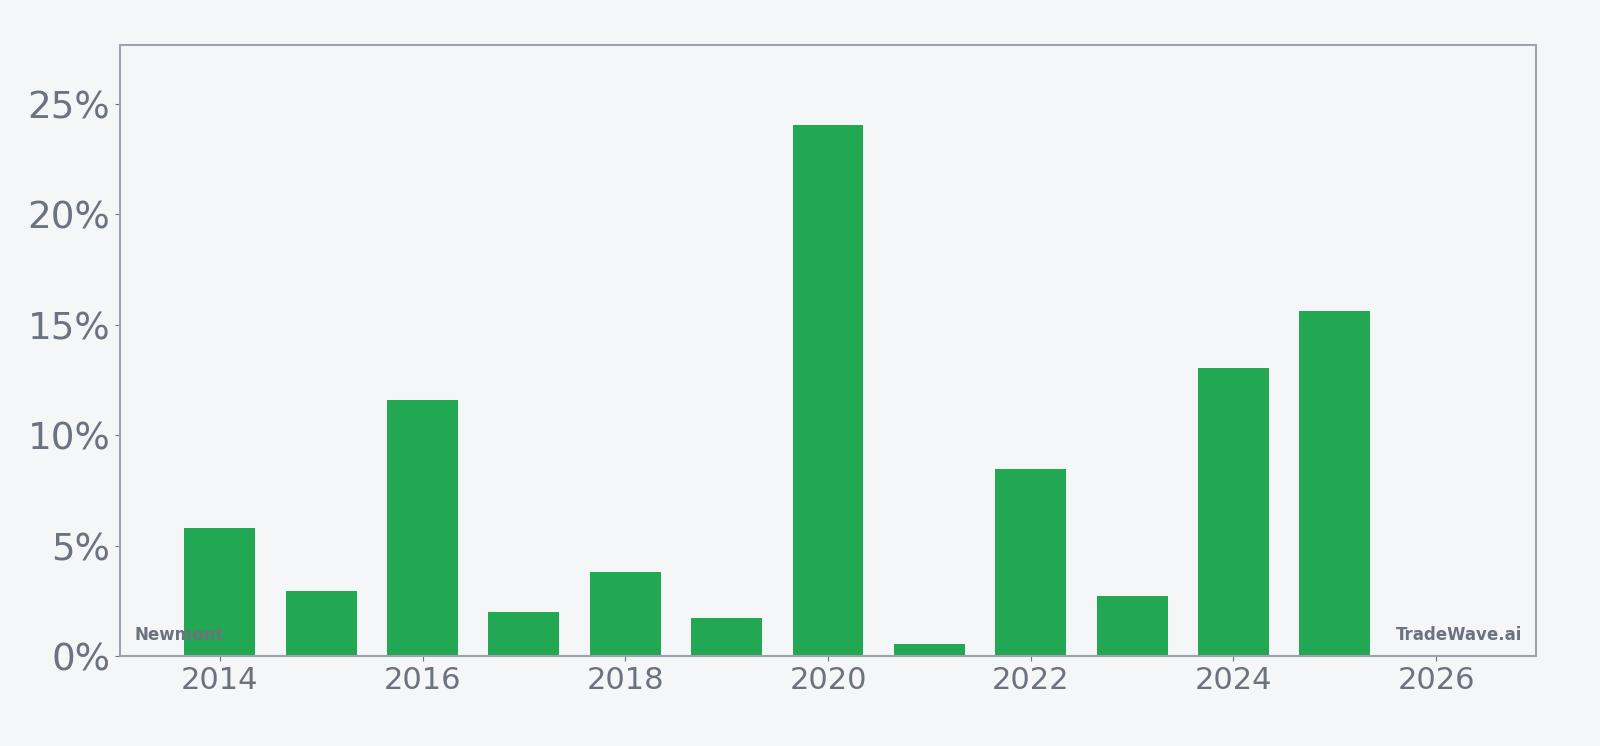
Year-by-year net returns and intraperiod swings show how often Newmont has pushed higher and how deep the temporary dips have been.
Across the 12-year sample, the trade direction for this pattern is long, and every iteration has finished in the green. Average gains of 7.7% mask a wide range of outcomes, from modest moves of around 1% to 3% in quieter years to double-digit surges like the roughly 24% net return in 2020 and 15.6% in 2025. Add it up and the cumulative return across all windows is 138%, which is a meaningful contribution for a 20-day slice that repeats annually.
The strongest years in the sample show how powerful the upside can be when the window lines up with a bullish gold tape. In 2020, Newmont’s best intraperiod run-up reached about 27.4% before the window closed with a 24.05% gain, while 2016 and 2024 also saw maximum favorable moves above 20%. On the other side, even the softer years like 2019 and 2021 still finished higher, but with net returns closer to 1% to 2% and smaller peak advances.
Intraperiod downside has been present but contained relative to the upside in most years. The worst drawdown from entry in the sample came in 2025, when Newmont briefly traded about 9.4% below its starting level before recovering to finish the window up 15.62%. Several other years saw mid-single-digit adverse moves, such as roughly 7.7% in 2020 and around 4% in 2017, 2018 and 2022, while a few windows barely dipped at all. That mix of sizable maximum favorable moves and manageable, though sometimes sharp, pullbacks is what the TradeWave Ratio of 1.35 is capturing.
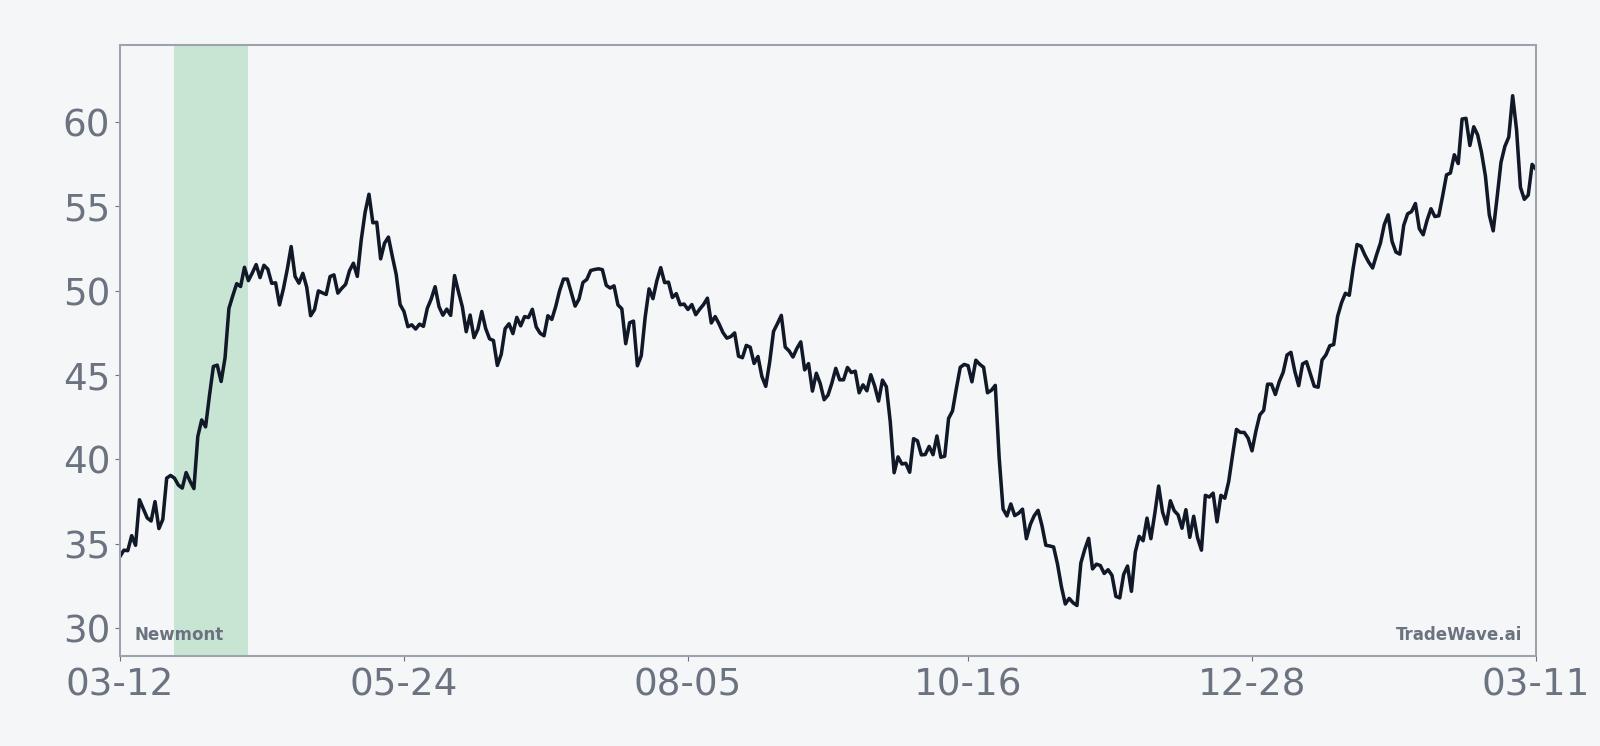
The historical average path suggests that strength has tended to build as the window progresses rather than spiking on day one. The cumulative trend chart shows a steady climb, with gains often accelerating in the back half of the 20-day stretch. That pattern of early chop followed by a stronger finish is consistent with the per-year profiles, where several of the biggest winners endured their deepest drawdowns before flipping higher later in the window.
Put together, the message from this seasonal slice is straightforward: for the past dozen years, late March into mid-April has been a friendly period for long exposure in Newmont, with every window finishing positive and several delivering outsized upside. History does not guarantee a repeat, but a 12-for-12 record with meaningful average gains is hard to ignore as the next iteration approaches.
History does not guarantee future results, and even in a clean winning streak like this one, adverse excursions inside the window have at times reached high single digits before prices recovered.
Price and near-term drivers
Newmont closed Friday at $95.80, down 3.4% on the day after a heavy-volume session that saw nearly 30.4 million shares change hands, more than double its 20-day average of about 11.7 million. The stock has dropped 21.24% over the past month and sits well below its 50-day moving average near $117.62, underscoring how sharp the recent pullback has been even against a constructive backdrop for gold prices.[1][4]
Fresh research coverage still leans positive. On Feb 28, Finviz highlighted an “Outperform” consensus rating on Newmont and cited a $71.67 long-run price target from GuruFocus and RBC Capital Markets, a figure that reflects an earlier, lower price regime but underscores that the Street sees value in the miner’s cash generation and leverage to bullion.[1] In late February, Forbes also pointed to Newmont’s strong finish to 2025, with earnings momentum and project execution setting up 2026 as a year of production stabilization and potential improvement.[4]
Macro conditions have been supportive. In Feb 2026, Finviz reported that major banks had raised long-term gold price forecasts into the $6,100 to $6,300 range by 2026, a bullish backdrop for large-scale producers with low-cost assets like Newmont.[1] Earlier commentary from Forbes in Nov 2025 tied higher bullion prices to geopolitical tensions and tariff risks, arguing that the environment favored gold miners as investors sought hedges against policy and growth uncertainty.[7]
Operationally, Newmont enters this seasonal window from a position of financial strength. Forbes reported on Feb 26 that the company ended 2025 with record free cash flow of about $1.6 billion, near-zero net debt and a portfolio of development projects that management expects to support production stabilization and improvement into 2026.[4] GuruFocus coverage from Jul 27, 2025, noted that Newmont had already surpassed Q2 profit expectations on bullion gains, reinforcing the link between higher gold prices and the miner’s earnings power.[2]
Sector context also matters. GuruFocus analysis from Aug 2025 highlighted that Newmont generated roughly $20.6 billion in revenue with margins above industry medians, positioning it as one of the financially stronger names in the global mining space.[3] That strength has kept the stock in the conversation for investors looking for liquid, large-cap exposure to gold, even as some high-profile commentators have debated whether rival miners offer better risk-reward at current levels.[5][6]
Insider activity has been a modest counterpoint. In Dec 2025, GuruFocus reported that director Bruce Brook sold shares of Newmont, a move that did not change the company’s strategic trajectory but served as a reminder that insiders sometimes take profits after strong runs.[8] Against that backdrop, the current pullback and the approaching seasonal window give traders a fresh lens on how sentiment might reset into the spring.
The chart below situates the latest slide and volatility spike in the context of Newmont’s past year of trading and the forward seasonal projection.
What to watch as the window opens
The next test for this pattern arrives on Mar 26, when the 20-day window opens again. Traders will be watching whether Newmont can stabilize above recent lows after a 21.24% monthly slide and start to rebuild toward its 50-day moving average, or whether selling pressure persists despite the historical tailwind.[1]
Earnings and macro headlines will be key. While the exact date of the next quarterly report is not yet set, recent coverage has emphasized Newmont’s leverage to higher gold prices and its pipeline of projects slated to support production in 2026.[2][4] Any update on costs, capital spending or guidance that shifts the narrative around free cash flow could either reinforce or undercut the seasonal pattern as the window progresses.
On the macro side, watch for fresh signals on tariffs, geopolitical risk and central-bank gold buying, all of which have been cited as drivers of bullion strength in prior coverage.[1][7] If gold prices continue to firm into mid-April, the historical record suggests that Newmont has often translated that backdrop into outsized gains during this specific slice of the calendar.
Finally, positioning and sentiment will matter. Volume has already spiked above normal levels, and any follow-through in trading activity as the window opens will show whether institutions are leaning into the pullback or stepping aside. If Newmont starts to respect support levels and build higher lows during the window, it would rhyme with the 12-for-12 history of late-March strength. A failure to do so would mark a clear break from the pattern and signal that fundamentals or macro forces have taken the driver’s seat this time around.
Sources
- [1] Finviz, “Newmont Corporation (NEM): A Bull Case Theory,” Feb 28, 2026.
- [2] GuruFocus, “Newmont (NEM) Surpasses Q2 Profit Expectations on Bullion Gains,” Jul 27, 2025.
- [3] GuruFocus, “Newmont (NEM) Sells Entire Stake in Orosur Mining for $5.55M,” Aug 1, 2025.
- [4] Forbes, “Newmont Ends 2025 Strong — 2026 In Focus,” Feb 26, 2026.
- [5] Finviz, “Jim Cramer Says ‘Newmont is Real, Real Good’,” Dec 4, 2025.
- [6] Finviz, “Jim Cramer on Investing in Newmont While Holding AEM: ‘No Need, You Own the Best’,” Feb 7, 2026.
- [7] Forbes, “Gold Rush: Buy Or Sell Newmont Stock?,” Nov 4, 2025.
- [8] GuruFocus, “Insider Sell: Bruce Brook Sells Shares of Newmont Corp (NEM),” Dec 4, 2025.