International Paper (IP) Has Rallied in 6 of 7 Midterm Spring Windows as a 27-Day Run Opens
International Paper is heading into a historically strong 27-day midterm-year window just as shares trade near a 52-week low and the company reshapes its portfolio.

Key takeaways
- International Paper’s upcoming 27-day window starting Mar 23 has been positive in 6 of the last 7 midterm election years, a historically strong bullish stretch.
- The long trade direction has delivered an average 5.48% gain in winning years and a 5% average outcome across all years in the sample.
- Maximum favorable moves inside the window have often pushed toward high single digits, but adverse swings have at times reached mid single-digit drawdowns.
- Shares closed at $33.76 on Friday, only about 0.6% above the 52-week low and far below the 50-day moving average of $42.46, underscoring how beaten up the stock is heading into the window.
- The pattern is specific to the midterm election year phase, when policy uncertainty and industrial demand signals often collide for cyclical names like International Paper.
- History shows upside has tended to build gradually across the window rather than in a single spike, but intraperiod volatility has still been meaningful.
According to historical data from TradeWave.ai, this specific midterm-year stretch has behaved very differently from an average month on the calendar for International Paper, and the next iteration begins in days.
Seasonal window
International Paper has risen in 6 of the last 7 midterm election years during this late-March 27-day window, averaging 5.48% gains in the winning runs. The new window opens on Mar 23 with the stock at $33.76, about 0.6% above its 52-week low of $33.57 and well below the 50-day moving average of $42.46, so the pattern is colliding with a depressed price base.
Grouping the data by the presidential election cycle matters here because midterm years often bring a different policy and demand mix for industrials than election years or pre-election years. For a packaging and paper producer tied to freight, consumer goods and e-commerce volumes, the midterm phase can capture shifts in fiscal spending, regulation and business confidence that do not show up in a simple calendar-year average.
This seasonal window begins on Mar 23 and spans 27 trading days. Historically, during this period in midterm election years, International Paper has shown a clear bullish tendency for long trades, with 86% of years in the sample finishing higher and only one losing year.
The long trade direction is explicit in the pattern. Across the seven midterm-year samples, there are 6 winners and 1 loser, with an average profit of 5.48% in the winning years and a 5% average when every year is included. That gap between winners-only and all-years results is small, which tells you the lone losing year did not wipe out the gains from the stronger cycles.
Looking at individual years, the weakest outcome came in 2002 with a modest 0.79% loss, while 2018 and 1998 stand out with gains of 7.82% and 7.43% respectively. In those stronger years, the stock not only finished higher but also saw intraperiod rallies that pushed into double-digit territory at the peak before settling back by the end of the window.
The intraperiod path matters as much as the final score. Maximum favorable excursions, which track the best point-to-peak move from the entry during the window, have ranged from roughly 3% in softer years to more than 10% in 1998 and around 9% in 2010. Maximum adverse excursions, the worst drawdowns from entry inside the window, have at times reached around 6% in 1998 and 2010, while the more benign years such as 2018 and 2022 saw almost no downside from the starting point.
Put simply, the typical pattern shows that when this window works, it often does so with a steady grind higher and room for mid single-digit pullbacks along the way. The historical trend profile leans toward gains building through the middle of the window rather than a one-day pop, which is consistent with a cyclical stock responding to improving order books and sentiment rather than a single headline shock.
The cumulative return view across all seven midterm-year samples adds another layer. Stacking the windows on top of each other produces a smooth upward slope that reaches roughly mid single-digit gains by the end of the period, with only shallow dips along the path. There is no sign of a persistent late-window giveback that would suggest traders routinely fade the move into April.
Year-by-year bars that combine net results with best and worst intraperiod moves show how upside and drawdown have coexisted in this window.
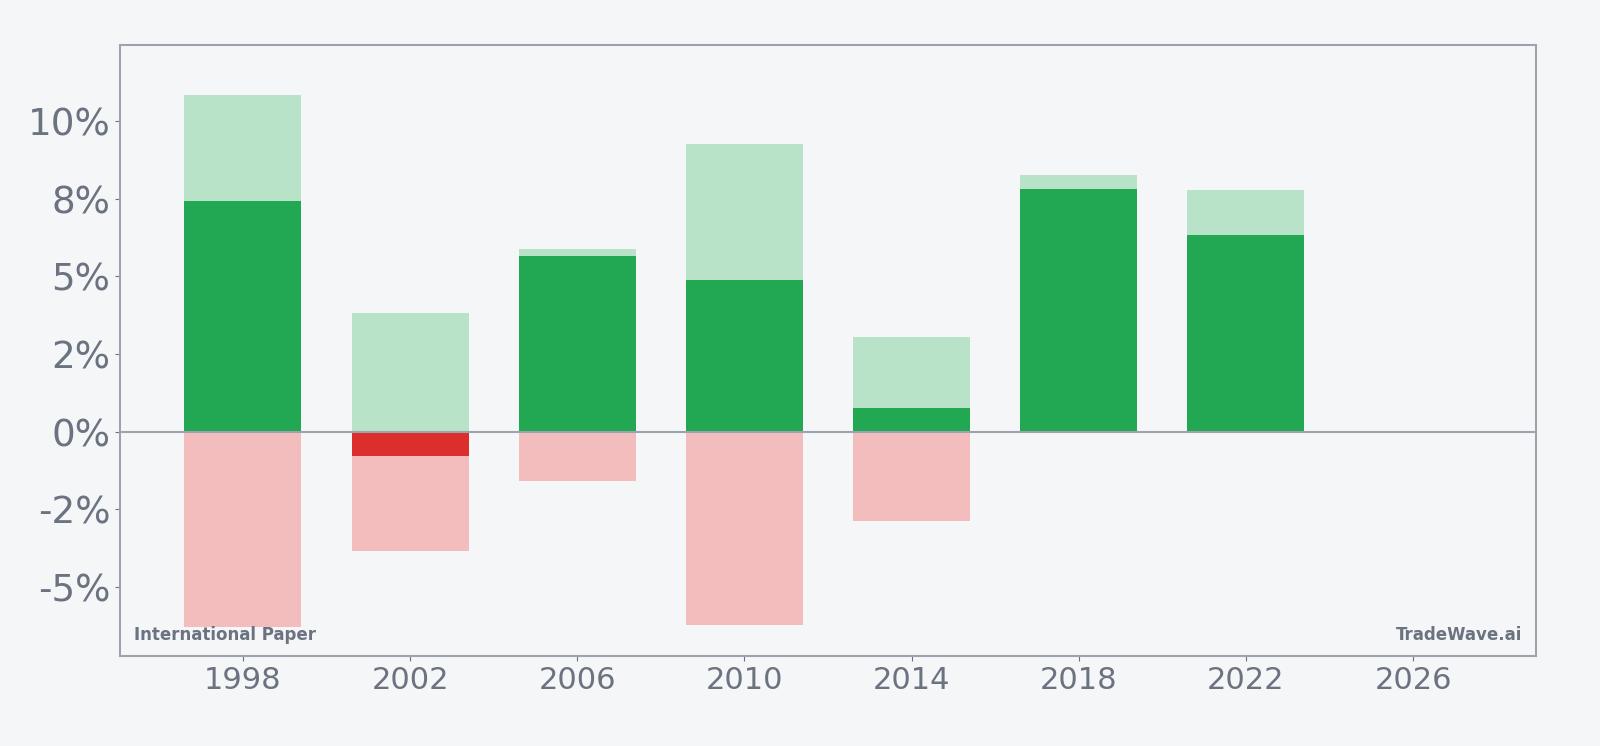
History does not guarantee future results, and even in winning years the worst intraperiod drawdowns have reached several percent, so MAE can be large relative to the final gain.
Price and near-term drivers
International Paper closed Friday at $33.76, down 0.71% on the day, extending a rough stretch that has left the stock about 37.1% below its 52-week high of $53.73 and only a few cents above its 52-week low of $33.57. The one-month return sits at a steep negative 27.97%, and shares trade well under the 50-day moving average of $42.46 on heavy recent volume relative to the 20-day average of roughly 6.4 million shares.
That weakness comes after a major strategic reset. On Jan 29, International Paper said it would split into two publicly traded companies and reported a wider fourth-quarter loss tied to higher costs and an asset impairment charge, even as earlier quarters showed a 28% rise in adjusted EBITDA and wider margins.[3] Management has guided to $600 million of EBITDA benefits in 2026, with a focus on efficiency and high-return projects, and has been streamlining its portfolio under an 80/20 strategy that concentrates resources on the most profitable lines.[1][3]
In June 2025, one analyst argued that International Paper’s shares were not fully reflecting these self-help measures, pointing to the gap between operational progress and the stock price.[4] Since then, the combination of a planned breakup, asset sales and cost work has only grown more visible, even as the share price has slid back toward cycle lows.
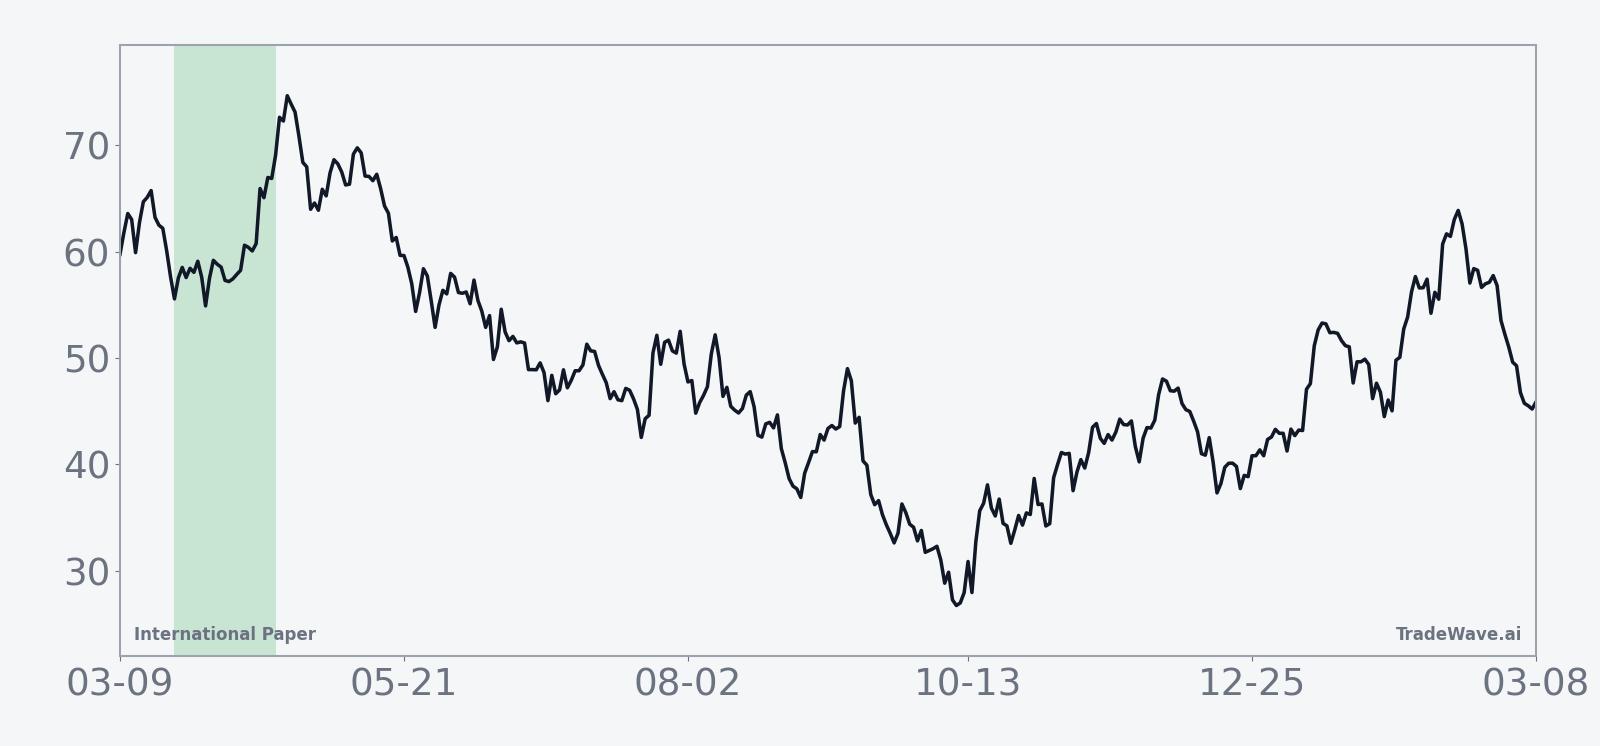
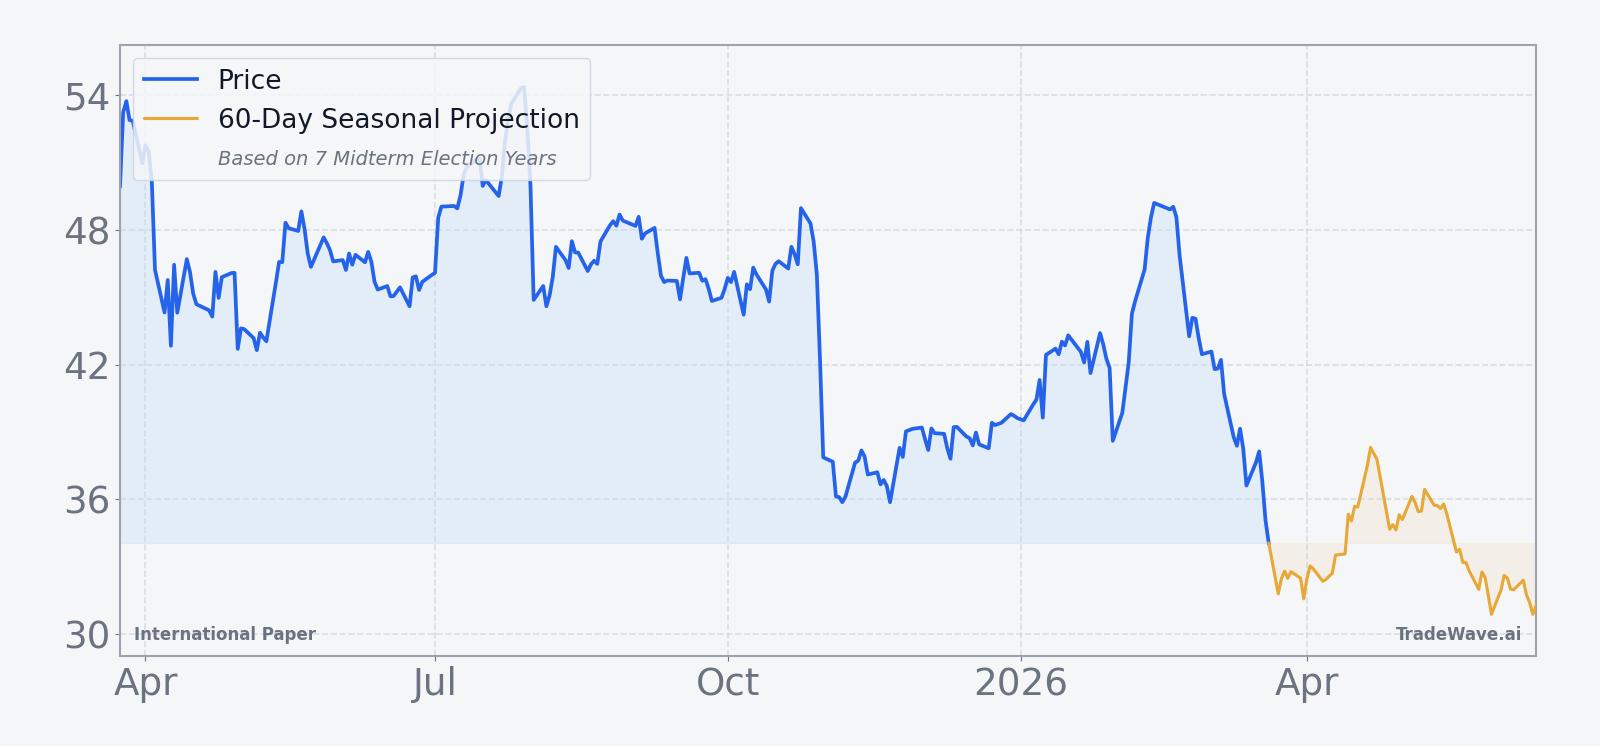
The chart below situates the latest slide against the past year’s trading range and overlays the next 60 days of seasonal projection.
Election-cycle and macro backdrop
The current calendar sits in the midterm election year, the third year of the presidential cycle, which often brings a different mix of policy risk and spending decisions than the election year itself. For a cyclical name like International Paper, that can translate into shifting expectations around infrastructure outlays, environmental regulation and industrial demand that ripple through packaging volumes and pricing power.
Midterm years have historically been choppier for many industrials in the first half of the year, as companies and investors wait for clarity on fiscal priorities and regulatory direction. The 27-day window starting Mar 23 falls squarely into that early midterm phase, just before markets begin to look ahead to the pre-election year, which has often been friendlier for risk assets as policy uncertainty fades and growth expectations stabilize.
For International Paper, the policy calendar intersects with company-specific change. The planned split into two companies and the sale of the global cellulose fibers business for $1.5 billion, announced in August 2025, are reshaping the balance sheet and operating focus.[2][3] That leaves investors weighing restructuring execution risk against the potential for higher-margin, more focused operations as the cycle evolves.
What to watch as the window opens
The seasonal pattern sets a clear backdrop: in the last seven midterm election years, this late-March window has favored long exposure in International Paper, with 6 winners, one small loser and average gains in the mid single digits. The stock is entering that stretch from a position of weakness, trading near a 52-week low and well below key moving averages, which makes the upcoming 27 days an important test of whether history’s bullish bias can assert itself against a tough tape.
Traders will be watching a few concrete markers. First, price behavior around the $33.57 52-week low will matter; a sustained hold and turn higher inside the window would rhyme with prior midterm-year patterns, while a decisive break lower would mark a clear departure. Second, volume relative to the 20-day average near 6.4 million shares will signal whether institutions are leaning into the restructuring story or continuing to sell into strength.
Third, any updates on the planned split, cost programs or asset sales could act as catalysts that either reinforce or overwhelm the seasonal tendency.[2][3] A constructive tape that responds positively to such headlines would fit the historical script of steady gains with manageable drawdowns, while negative surprises or execution missteps could turn this window into the second losing year in the sample.
Finally, behavior across the window itself will be telling. In prior midterm cycles, the strongest years saw rallies build through the middle of the period with only brief pullbacks, while the lone losing year featured a smaller upside push and a deeper intraperiod dip. If International Paper can log higher highs and higher lows across the 27 days, with any selloffs contained to a few percent, it would echo the historical pattern. A choppy, lower-highs profile with repeated tests of the lows would signal that this midterm-year stretch is breaking from its usual playbook.
Sources
- Seeking Alpha: International Paper Shares Are Not Reflecting Ongoing Self-Help Measures (Jun 5, 2025)
- The Wall Street Journal: American Industrial Partners to Buy International Paper Unit for $1.5 Billion (Aug 21, 2025)
- The Wall Street Journal: International Paper Splitting in Two; Wider Quarterly Loss Posted (Jan 29, 2026)