Coterra (CTRA) Has Favored the Short Side in Every 160-Day Midterm Stretch on Record
Coterra is approaching a 160-day midterm-election-year stretch that has historically rewarded short setups even as the stock trades just below its 52-week high.

Key takeaways
- Coterra’s upcoming midterm-election-year window runs 160 trading days from Apr 18 and has favored short trades in every one of the last 8 cycles.
- The pattern shows 100% profitable outcomes for the short direction, with 8 winners and 0 losers and an average profit of 15.76% per window.
- Historically, adverse moves against the short have still been meaningful, with several years showing double-digit drawdowns before the trade finished in the green.
- The TradeWave Ratio of 1.76 suggests price has typically traveled far in the trade direction within the window, while a Sharpe ratio of 1.54 points to strong risk-adjusted results.
- Shares closed at 33.97 on Mar 20, about 2.0% below the 52-week high of 34.67, leaving little cushion if the historical midterm-year soft patch reappears.
- Energy-specific drivers such as U.S. natural gas prices, crude demand and production trends have been key backdrops in prior midterm-year windows.[1]
According to historical data from TradeWave.ai, Coterra’s behavior in midterm election years has followed a distinct seasonal script that differs from its performance in other parts of the presidential cycle.
Seasonal window
Coterra has produced profitable short trades in all 8 midterm-election-year windows in this pattern, averaging 15.76% gains for the short side over each 160-day stretch. The next iteration begins on Apr 18, 2026, with the stock currently at 33.97, about 2.0% below its 52-week high of 34.67. That combination of a clean win record for shorts and a price sitting near the top of its one-year range makes this window hard for traders to ignore.
The analysis groups only the last 8 midterm election years, rather than consecutive calendar years, to line up Coterra’s behavior with the policy and macro backdrop that tends to repeat every four years. Midterm years often bring regulatory noise, shifting expectations for energy policy and budget debates that can ripple through exploration and production names. Looking at Coterra through that lens shows a consistent tendency for the stock to weaken over this specific mid-cycle stretch, even when the broader energy tape has been mixed.
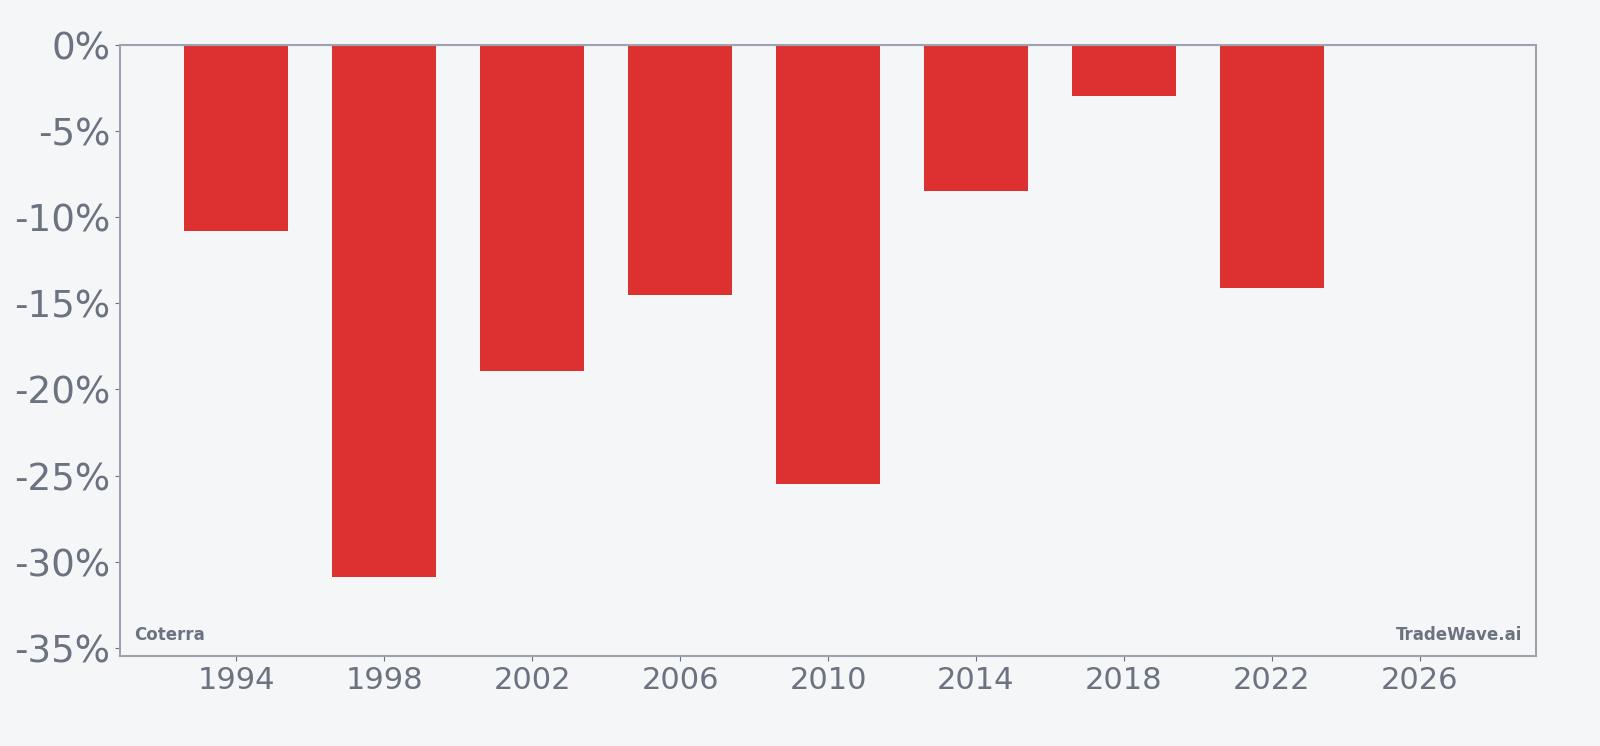
Across the 8 midterm-year samples, Coterra’s short-side returns range from a modest 3.0% gain for shorts in 2018 to a 30.86% gain in 1998, when the stock fell sharply over the window. The median profit for the short direction is 14.3%, close to the average, which suggests the pattern is not being skewed by a single outlier year. In other words, this has not just been a one-off crash story; the stock has tended to grind lower in this phase of the cycle with reasonable consistency.
The per-year table shows that 1998 stands out as the strongest year for the short setup, with a net return of -30.86% for the stock and a worst intraperiod drawdown of -45.01% from the entry price. At the other end of the spectrum, 2018 delivered a relatively small -3.0% net move for the stock, but even there the maximum adverse move against the short reached -10.19% before the trade finished in the green. That mix of outcomes points to a window where downside has often developed, but not always in a straight line.
A combined view of net returns with peak favorable and adverse moves helps clarify how much the stock has tended to swing inside the window.
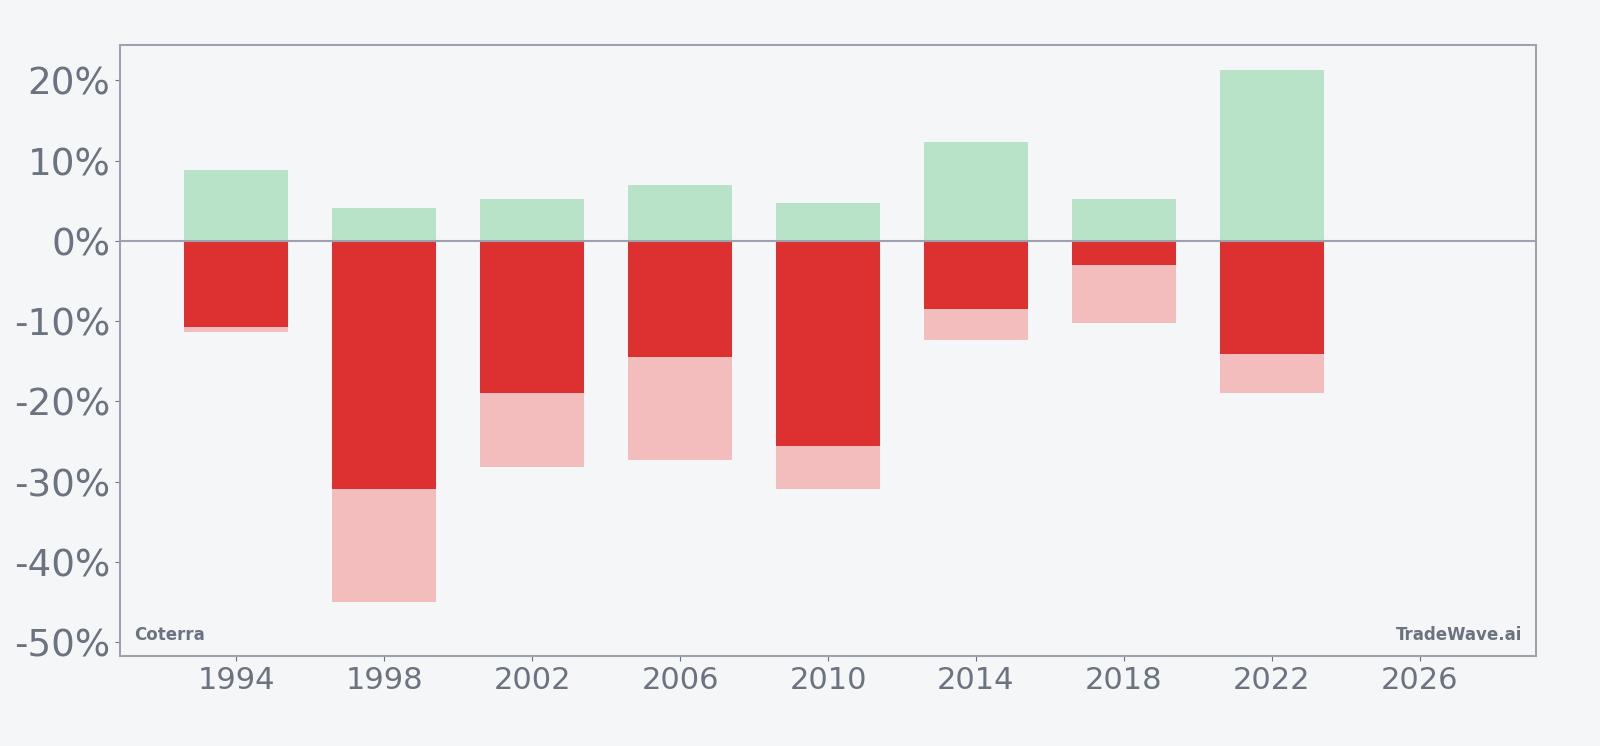
The maximum favorable move for shorts has often been sizable, with several years showing more than 20% peak gains before the window closed, while maximum adverse moves have at times pushed beyond 25% against the short. That profile fits a high-variance environment where the direction has ultimately favored shorts, but where timing and risk management have mattered. The Sharpe ratio of 1.54 reflects strong risk-adjusted results based on end-of-window outcomes, yet the intraperiod swings captured by the MFE and MAE figures show that the ride has rarely been smooth.
History does not guarantee future results, and the worst intraperiod drawdowns in this window have been large even in years that ultimately finished profitably for the short side.
Price and near-term drivers
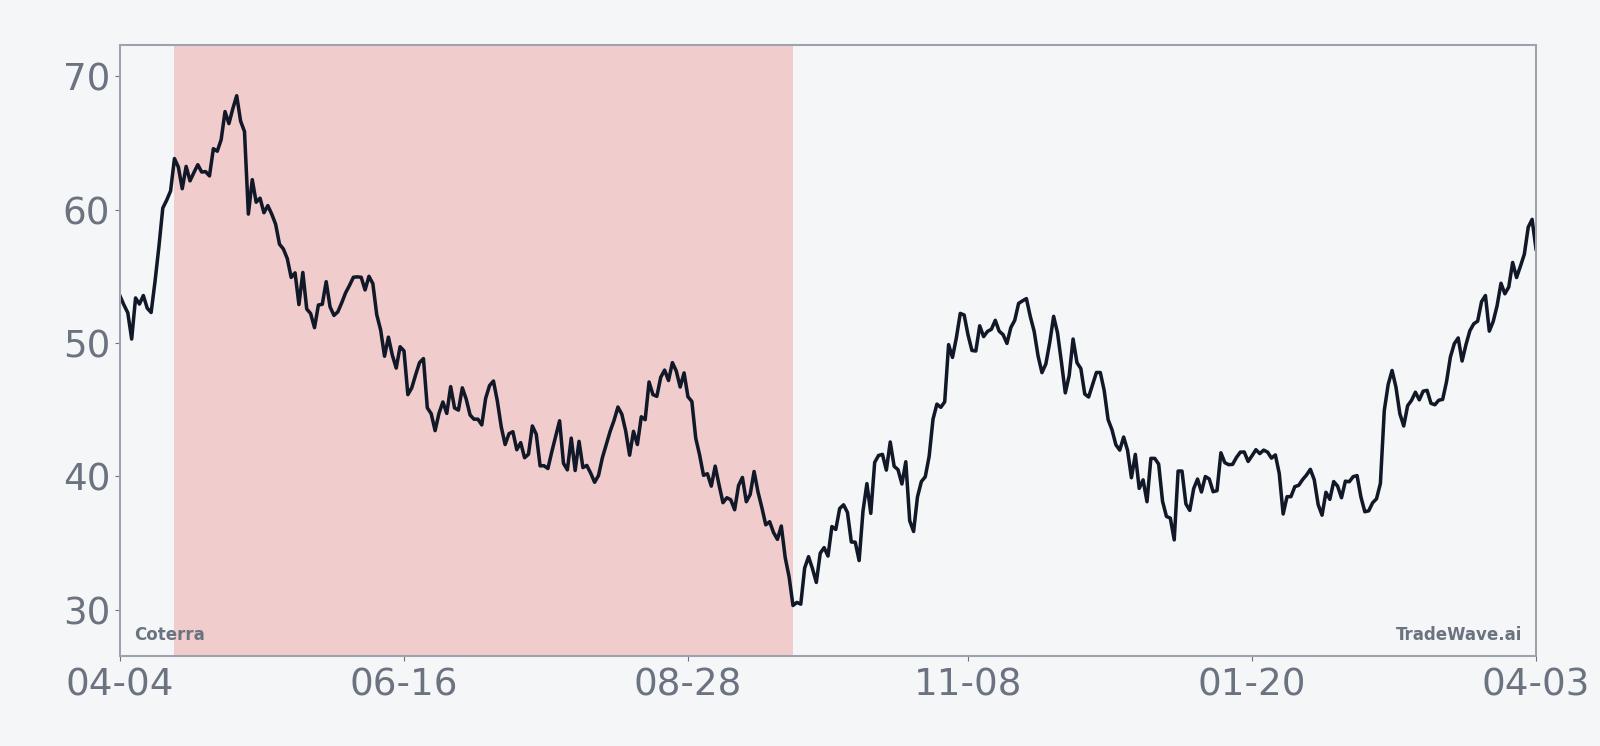
Coterra shares closed at 33.97 on Mar 20, up 0.21% on the day, leaving the stock about 2.0% below its 52-week high of 34.67 and well above the 52-week low of roughly 21.30. The stock has climbed about 8.6% over the past month, trading comfortably above its 50-day moving average of 29.67 on heavy recent volume that has run ahead of the 20-day average of roughly 11.9 million shares. That backdrop means the upcoming midterm-year window is approaching with Coterra in a firm position near the top of its one-year range rather than limping into it from a low.
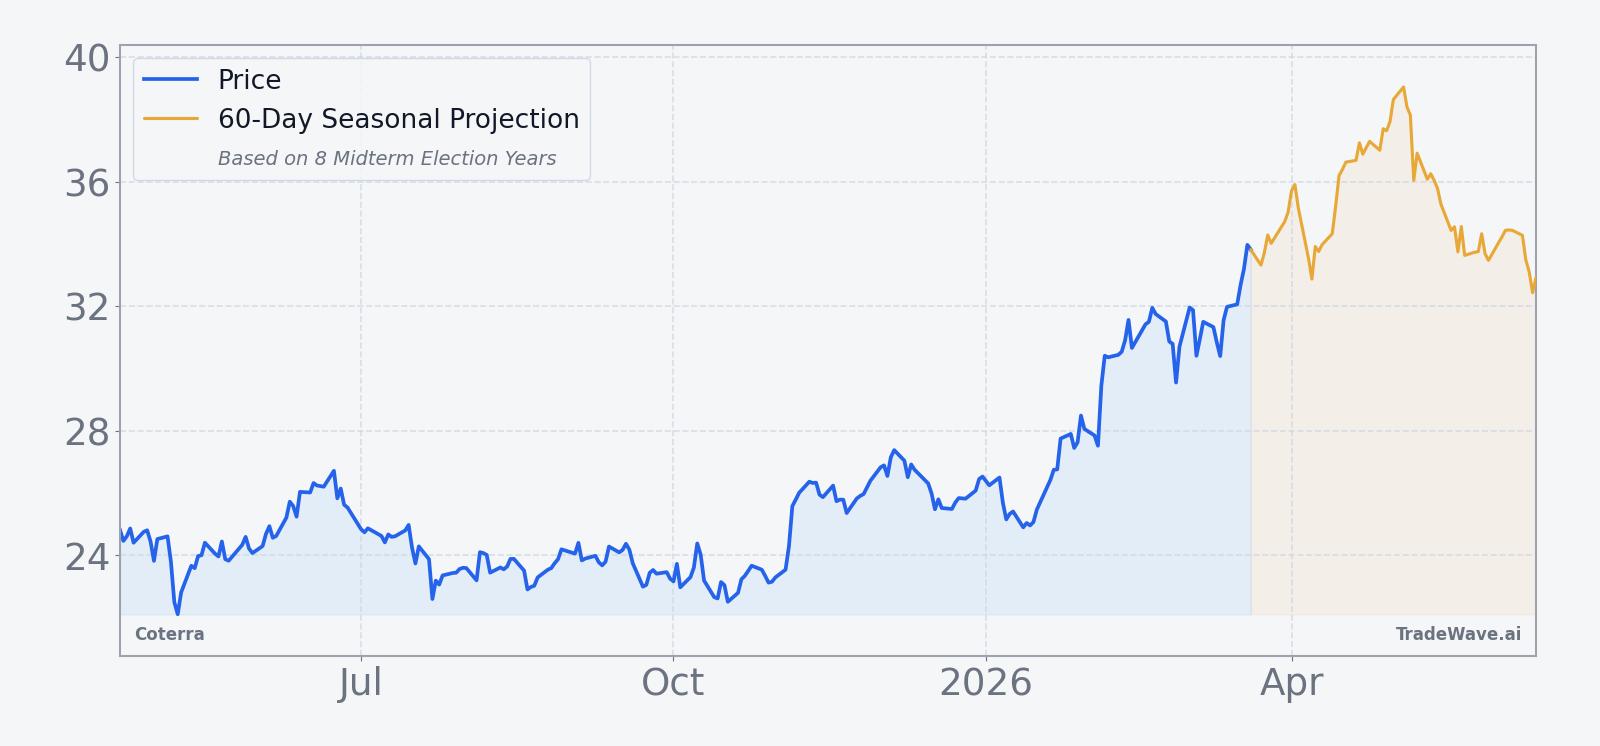
The chart below situates the latest move in its recent multi-month context and overlays a short-term seasonal projection.
Fundamentally, Coterra’s last reported quarter showed the company beating profit expectations on stronger output and higher U.S. natural gas prices, even as weaker crude prices acted as a drag.[1] In Aug 2025, the company reported adjusted profit of 48 cents per share versus estimates of 45 cents, with production up 17% to 783,900 barrels of oil equivalent per day and realized oil prices falling to $62.80 per barrel from $79.37 a year earlier.[1][2] That mix of volume growth, gas leverage and oil-price pressure is a reminder that Coterra’s earnings path can diverge from headline crude benchmarks, especially when gas and liquids pricing move in different directions.
Sector-wise, Coterra sits at the intersection of U.S. shale output and domestic gas pricing, both of which have been sensitive to policy debates around drilling, pipeline approvals and export capacity.[1] In Aug 2025, Reuters reported that higher U.S. natural gas prices and increased output in the Permian and Anadarko basins were key supports for the company, even as weaker global crude demand and additional OPEC+ supply weighed on oil benchmarks.[1] For the upcoming midterm-year window, traders will be watching how any new tariff headlines, regulatory shifts or production guidance updates intersect with that historical pattern of stock weakness.
What to watch as the window opens
The next 160-day midterm-election-year window for Coterra starts on Apr 18, giving traders a defined calendar to track. The first marker is price behavior around the current 52-week high near 34.67: if the stock continues to push higher into the start date, it would echo several past cycles where Coterra peaked early in the window before rolling over. A sustained break below the 50-day moving average around 29.67 during the window would be a stronger sign that the historical short-favorable pattern is reasserting itself.
On the macro and policy side, watch for U.S. energy headlines that tend to cluster in midterm years, including debates over drilling permits, export rules and any renewed tariff or sanctions activity that could shift global demand and supply expectations.[1] Earnings updates and production guidance will also matter, especially if Coterra’s gas-heavy portfolio benefits from domestic price strength while oil remains under pressure, a combination that has shaped past mid-cycle performance.[1][2] If the stock shrugs off those catalysts and holds near or above its recent highs through the bulk of the window, that would mark a clear break from the last eight midterm-election-year patterns. If instead Coterra starts to show the familiar drift lower with sizable intraperiod swings, it would be one more data point in favor of a seasonal script that has yet to miss.