Qualcomm (QCOM) Has Rallied in 10 of 10 Spring Windows Starting April 14
Qualcomm is trading well below its 52-week high just weeks before a 100-day spring stretch that has never been negative in the past decade, setting up a rare clash between cautious guidance and a powerful calendar tailwind.
Key takeaways
- A 100-day seasonal window for Qualcomm starting Apr 14 has been positive in 10 of 10 years, with a long trade direction.
- Across that decade, the window delivered an average gain of 13.67% and a 249% cumulative return for long exposure.
- All years in the sample were winners, with no losing seasons in this specific spring-to-summer stretch.
- Intraperiod swings have been meaningful, with several years showing double-digit drawdowns even as the window finished higher.
- Today QCOM trades at $129.90, about 36.3% below its 52-week high, after guidance flagged a softer near-term revenue outlook tied to memory shortages.[1][3]
- The setup pits a historically strong seasonal pattern against a cautious fundamental backdrop, giving traders a clear calendar to watch rather than a simple buy-the-dip story.
According to historical data from TradeWave.ai, this upcoming stretch has behaved very differently from an average quarter for Qualcomm, with a distinct long-biased pattern that stands out from the rest of the year.
Seasonal window
Qualcomm has risen in 10 of 10 years during the 100-day window that begins on Apr 14, averaging 13.67% gains for long positions. Today the stock closed at $129.90, about 36.3% below its 52-week high of $203.86 and roughly 11.2% above its 52-week low of $116.82, leaving plenty of room on both sides of the recent range.
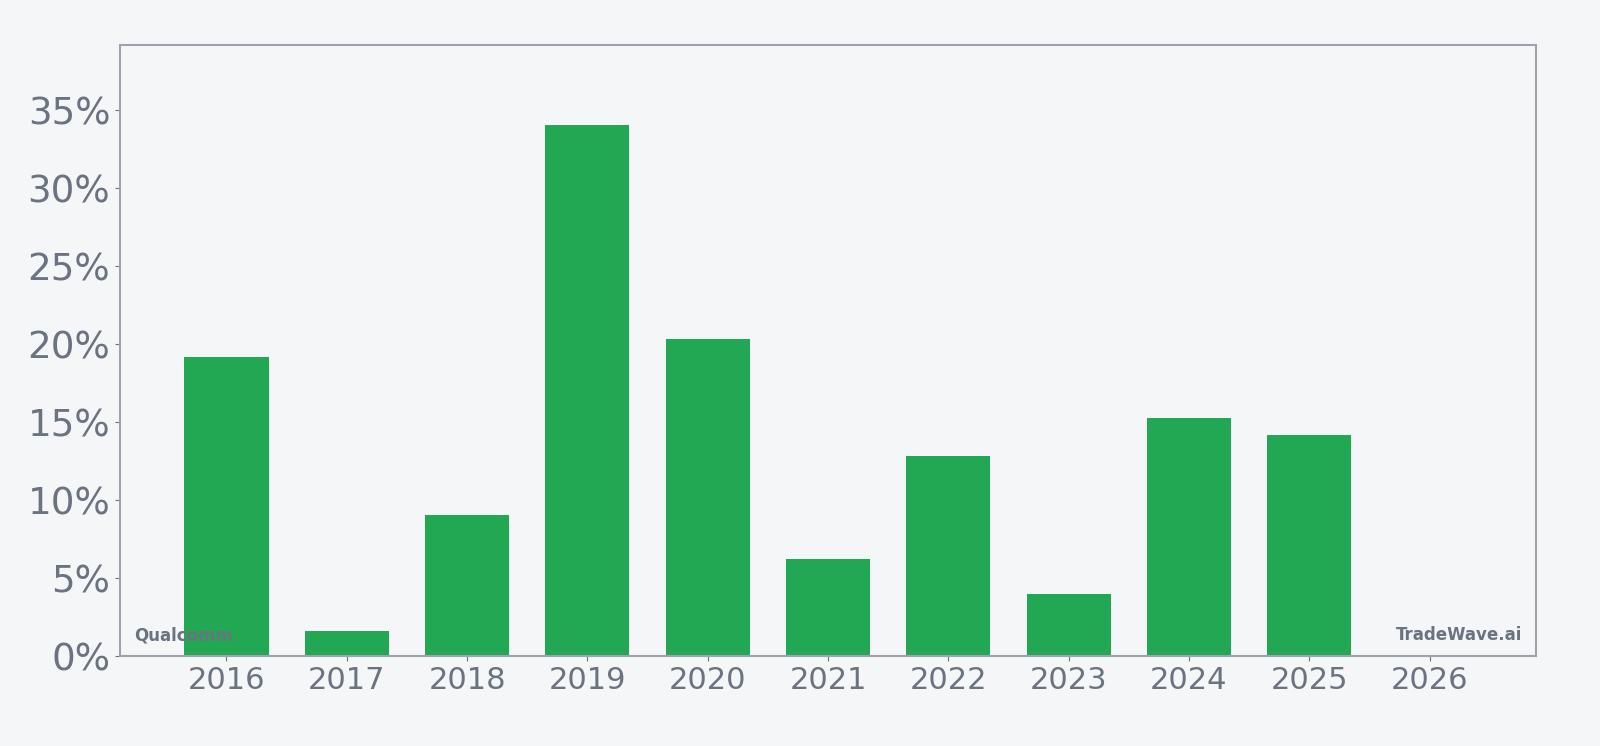
Year-by-year net returns and intraperiod swings show how consistently the window has favored longs while still delivering sizable drawdowns along the way.
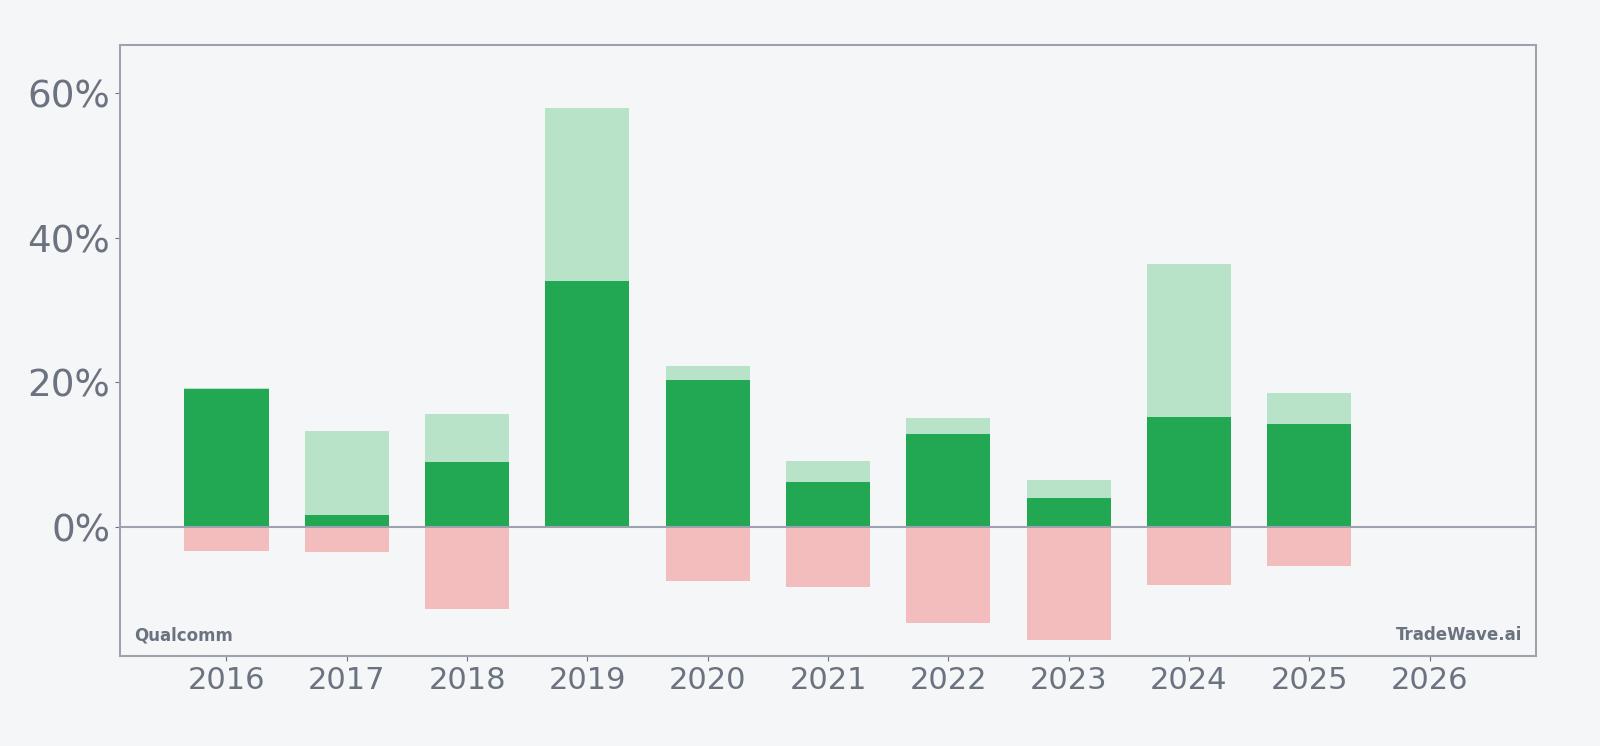
The strongest year in the sample was 2019, when the window produced a 34.04% net gain, with a maximum favorable move of 57.99% and almost no drawdown from entry, a reminder that some cycles have delivered powerful upside bursts. At the other end of the spectrum, 2017 finished only 1.61% higher despite a 13.23% peak run-up and a modest 3.48% worst drawdown, showing that even “win” years can give back most of the move by the close. Several years, including 2018, 2022, and 2023, saw double-digit adverse excursions inside the window, with worst drawdowns between about 11% and 15.55% before recovering to end positive. The TradeWave Ratio of 1.33 and Sharpe ratio of 1.33 point to a window where the typical path has rewarded long exposure but has not been a straight line, with volatility that can cut both ways. Add it up: 10 winners, no losers, and a 249% cumulative gain across ten spring windows is a rare track record for a single slice of the Qualcomm calendar.
History does not guarantee future results, and maximum adverse moves inside the window have at times been large even in years that ultimately finished higher.
Price and near-term drivers
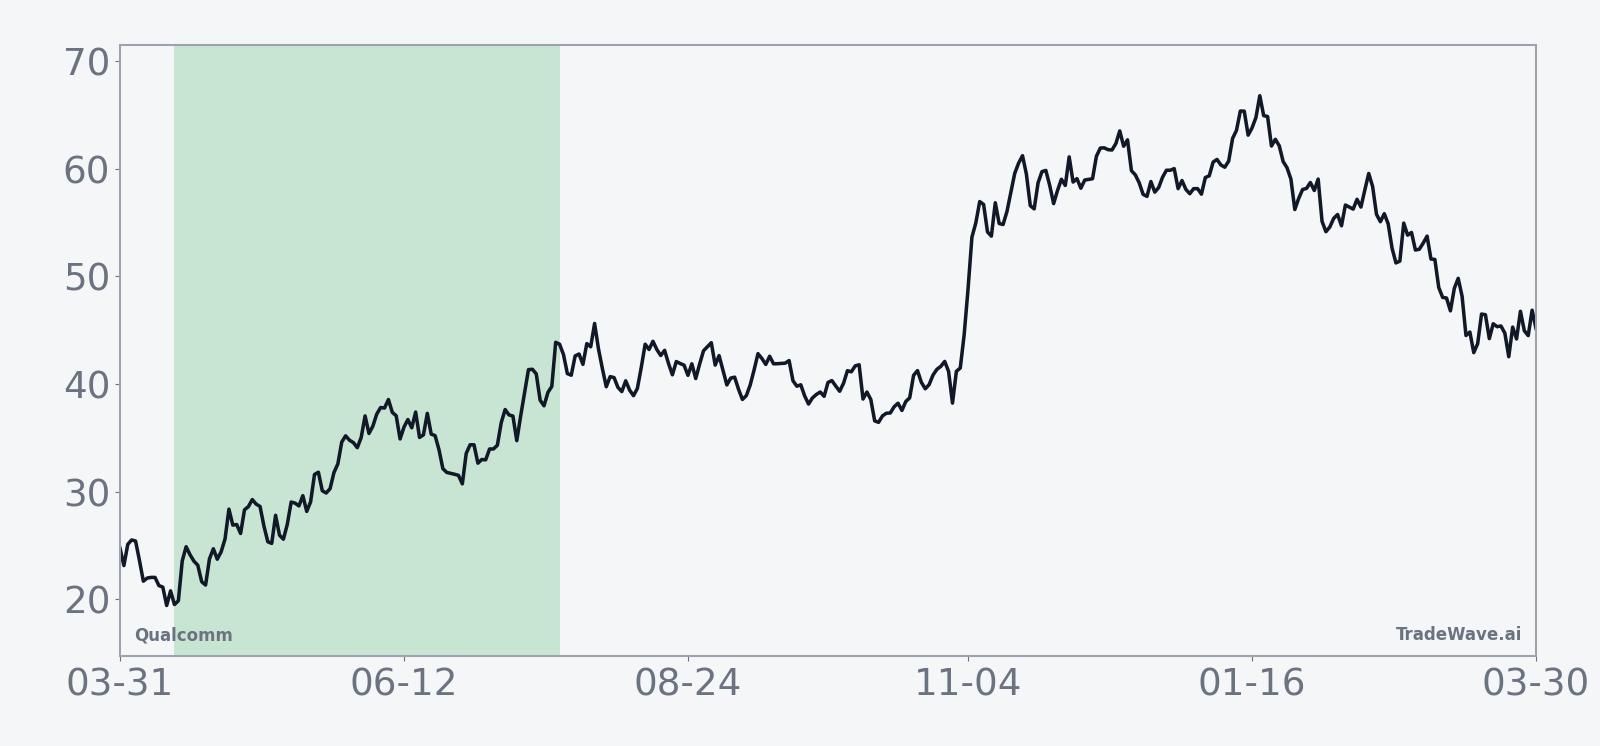
Qualcomm closed Friday at $129.90, down 1.1% on the day, after sliding about 9.08% over the past month and trading below its 50-day moving average of $145.81. The stock sits on heavy volume relative to its 20-day average of roughly 12.96 million shares, and it remains well off its 52-week high of $203.86 as investors digest a softer near-term outlook and sector-wide supply issues.
On Feb 4, Qualcomm reported fiscal first-quarter 2026 revenue of $12.25 billion, slightly ahead of Wall Street’s $12.21 billion estimate, with adjusted earnings of $3.50 per share topping the $3.41 consensus.[1][3] Management paired that beat with guidance for the current quarter that called for adjusted EPS between $2.45 and $2.65 on revenue of $10.2 billion to $11 billion, a step down that reflected a drag from memory shortages and a more cautious demand view.[1][3] The mixed message triggered a sharp reaction in after-hours trading, with shares sinking about 10% in extended trade and dropping 6% as the forecast reset expectations for the rest of the year.[3]
Those supply constraints sit on top of longer-running macro and geopolitical pressures. In Apr 2025, Qualcomm warned that escalating Sino-U.S. trade tensions could weigh on results, noting that China accounted for roughly 46% of its sales at the time.[2] The company has since benefited from a rebound in smartphone demand, with a Nov 2025 forecast calling for first-quarter sales and adjusted profit above Wall Street expectations, but the latest guidance shows how quickly the balance can shift when component shortages and trade frictions collide.[5][6] Sector-wide memory tightness has become a key swing factor for margins and shipment timing across the semiconductor complex, and Qualcomm’s commentary in February put that risk front and center for handset and connected-device supply chains.[1]
Fundamentally, Qualcomm is straddling two narratives. On one side, chip sales have been rising, and the company logged a $2.67 billion profit, or $2.43 per share, in the quarter reported in Jul 2025 as demand for its processors improved.[5] On the other, the latest quarter’s guidance and the post-earnings selloff show investors are quick to punish any hint that the recovery might stall, especially with China exposure and trade policy still in flux.[1][2][3] That tension between cyclical recovery and macro risk is the backdrop against which the April seasonal window will open.
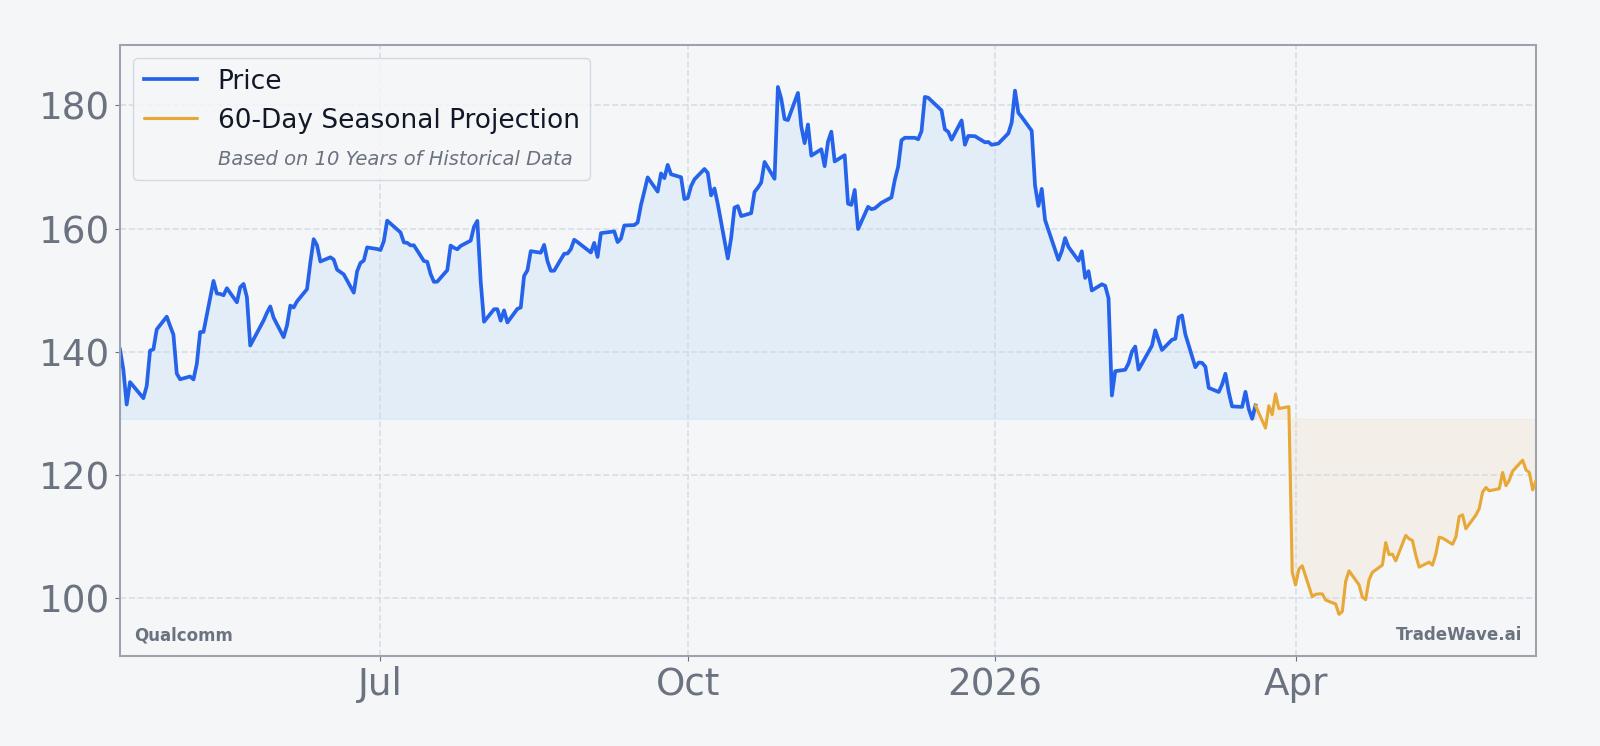
The chart below situates the latest pullback and post-earnings volatility against Qualcomm’s broader 12-month trend and a 60-day seasonal projection.
Earnings and guidance in focus
The Feb 4 report capped a run of quarters in which Qualcomm steadily rebuilt credibility after a tougher 2024 stretch. Revenue growth of 5% year over year in the latest quarter showed that core demand for its chips is holding up, even as management flagged memory shortages as a headwind for upcoming periods.[1][3] The guidance band for the current quarter implies a sequential step down in both revenue and earnings, which helps explain why the stock’s reaction skewed negative despite the headline beat.
Looking back, the company has not been shy about resetting expectations when conditions warrant. In Apr 2025, Qualcomm projected third-quarter revenue below estimates, citing a challenging macro environment and trade tensions, and the stock dropped 6% on the news.[2] By Jul 2025, rising chip sales had pushed profit higher again, underscoring how quickly fundamentals can swing in a sector where product cycles, pricing, and supply constraints all move on different clocks.[5] In Nov 2025, management guided first-quarter results above estimates as smartphone demand bounced back, only to temper that optimism three months later as memory shortages emerged as the new bottleneck.[6][1]
For traders eyeing the April window, the key earnings question is whether the current-quarter guidance proves conservative or marks the start of a more extended slowdown. With no firm date yet for the next earnings release, the seasonal window is likely to overlap at least one major update on Qualcomm’s outlook, which could either reinforce or challenge the historical pattern depending on how the numbers land.
Macro and sector backdrop
Qualcomm’s seasonal pattern does not exist in a vacuum. The company sits at the intersection of global smartphone demand, 5G infrastructure, automotive connectivity, and the broader semiconductor supply chain. In Apr 2025, management highlighted that roughly 46% of revenue came from China, making the stock particularly sensitive to any flare-up in Sino-U.S. trade tensions or export controls.[2] That exposure can amplify both upside and downside during volatile macro stretches.
At the same time, the semiconductor sector is wrestling with memory shortages that have already dented Qualcomm’s outlook.[1] Tight supply can support pricing for some components but also delay shipments and complicate product launches, especially when handset makers and device OEMs are trying to manage their own inventories. For Qualcomm, that means the April-to-summer window could coincide with a period when supply normalization, or lack of it, becomes a key driver of sentiment.
Investors also have to weigh the broader rate and growth backdrop. Higher-for-longer interest rates tend to compress multiples on cyclical tech names, while any sign of a re-acceleration in global growth or a thaw in trade relations can quickly re-rate stocks with heavy China exposure. Qualcomm’s current discount to its 52-week high suggests the market is already pricing in a fair amount of risk, which can either cushion further downside or limit upside if the macro picture fails to improve.
Valuation and positioning context
With Qualcomm trading well below its recent peak and under its 50-day moving average, the stock is no longer priced as a momentum favorite. While precise valuation multiples are not provided here, the combination of a post-earnings reset, heavy China exposure, and supply-chain uncertainty has clearly pushed investors toward a more cautious stance.[1][2][3][4] Commentary in early 2026 from market strategists framed the pullback as part of a broader debate over how low Qualcomm’s stock could go if headwinds persisted, underscoring that sentiment had shifted from chasing upside to managing downside risk.[4]
Positioning around the February earnings print also showed how quickly flows can swing. Qualcomm’s shares sank about 10% in extended trading and dropped 6% after the forecast, a move that reflected both high volume and a rush to reprice the stock’s near-term earnings power.[3] That kind of reaction can leave a mix of frustrated longs, fresh shorts, and sidelined investors all watching the same levels, which often makes subsequent seasonal windows more volatile as new information arrives.
What to watch as the April window opens
The April 14 start date gives traders a clear calendar marker. Historically, this 100-day stretch has favored long exposure in Qualcomm, with every year in the past decade finishing positive and several delivering double-digit gains. The most important test this time will be whether the stock can stabilize above its recent lows and reclaim the 50-day moving average as the window progresses, or whether post-earnings selling pressure and macro worries keep it pinned near the bottom of its 12-month range.
On the fundamental side, watch for any updates on memory supply and China demand, whether through company commentary, supplier reports, or macro headlines.[1][2] Signs that shortages are easing or that handset demand is holding up would support the kind of recovery that has often unfolded during this window in prior years. Conversely, fresh trade restrictions or evidence of a deeper slowdown in Chinese smartphone sales could blunt the historical tailwind.
Price action around the next earnings update will be another key tell. In Feb 2026, Qualcomm’s stock reaction to guidance was swift and severe, with a 10% after-hours drop and a 6% slide after forecasts reset expectations.[3] If a future report during the window sparks similar high-volume moves, traders will be watching to see whether the stock follows the historical script of recovering those losses within the 100-day span or breaks the pattern with a sustained downtrend.
Finally, monitor how Qualcomm trades relative to the broader semiconductor group and major indices. A rebound in sector sentiment or a broader risk-on shift could help the stock lean into its historically strong spring window. A continued defensive tone, especially around China and supply chains, would make this one of the more challenging iterations of a pattern that, on paper, looks almost too clean. For now, the message from the calendar is simple: this is one of Qualcomm’s most consistently positive stretches of the year, and it is less than a month away.
Sources
- [1] The Wall Street Journal, “Qualcomm First-Quarter Sales Rise, But Memory Shortage Dents Outlook,” Feb 4, 2026.
- [2] Reuters, “Qualcomm sees third-quarter revenue below estimates, shares drop 6%,” Apr 30, 2025.
- [3] CNBC, “Qualcomm stock sinks as memory shortage drags on forecast,” Feb 4, 2026.
- [4] Forbes, “How Low Can Qualcomm Stock Drop?,” Jan 13, 2026.
- [5] The Wall Street Journal, “Qualcomm Logs Higher Profit as Chip Sales Rise,” Jul 30, 2025.
- [6] Reuters, “Qualcomm forecasts first-quarter results above estimates as smartphone demand bounces back,” Nov 5, 2025.