This 50-Day Spring Run Has Delivered 7.28% Average Gains for McKesson Corporation (MCK)
McKesson Corporation is heading into a 50-day spring stretch that has delivered gains every year for a decade, just as shares cool off from February’s earnings spike.

Seasonal window
McKesson Corporation has posted gains in 10 of 10 years during this 50-day spring window, averaging a 7.28% rise. The next iteration begins on Apr 1 with the stock at $885.84, about 11.3% below its 52-week high of $999.00 after a sharp post-earnings run earlier this year.[3] That combination of a flawless decade-long record and a pullback from highs gives this upcoming stretch unusual weight on the trading calendar.
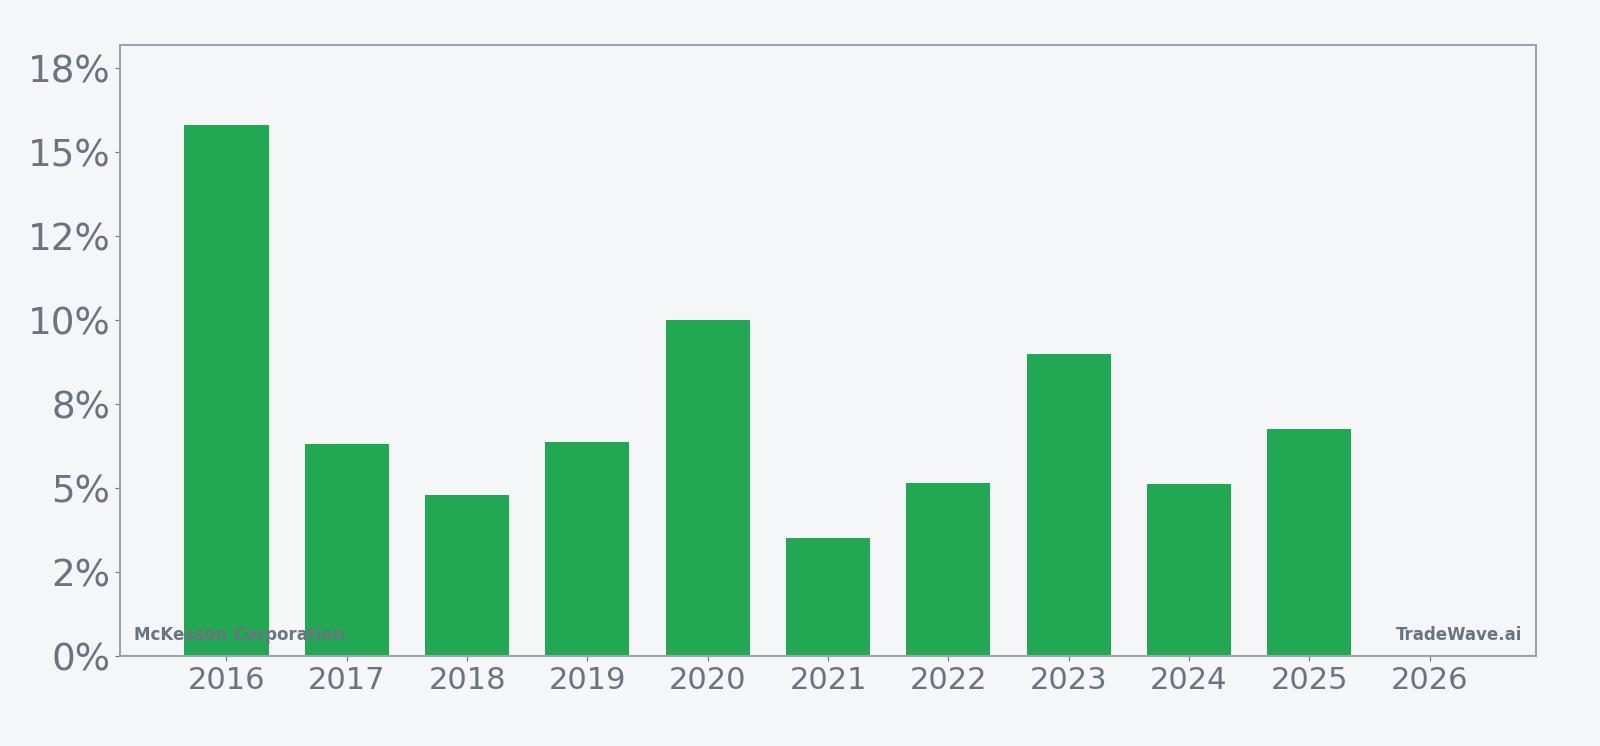
Year-by-year net returns and intraperiod swings show how upside and drawdowns have coexisted in this window.
Across the past decade, every single spring window has finished in the green for a long position, with net gains ranging from 3.53% in 2021 to 15.81% in 2016. The average winner’s gain of 7.28% lines up closely with the all-years average because there have been no losing years in this sample. That consistency is unusual for a single-stock pattern and helps explain the relatively strong 1.89 Sharpe ratio, which measures risk-adjusted average return based on end-of-window outcomes.
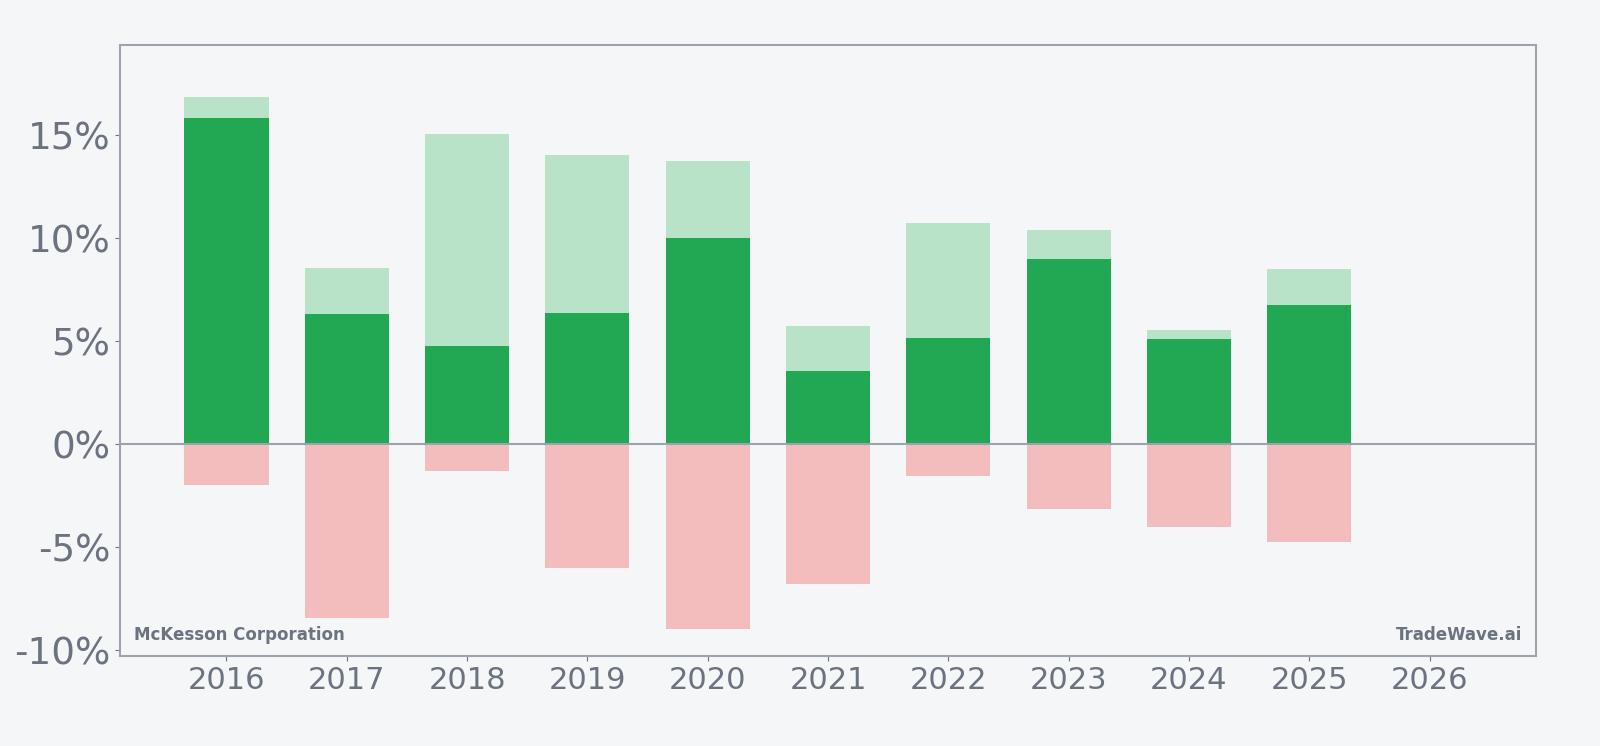
The intraperiod swings tell a more nuanced story. In strong years like 2018 and 2020, McKesson’s best point-to-peak move inside the window reached 15.04% and 13.72% respectively, while the worst drawdowns from entry stayed contained at around 1% to 9%. In choppier years such as 2017 and 2020, the stock still finished higher but endured adverse moves of up to 8.95% before recovering, underscoring that even “all-win” windows can feel uncomfortable in real time.
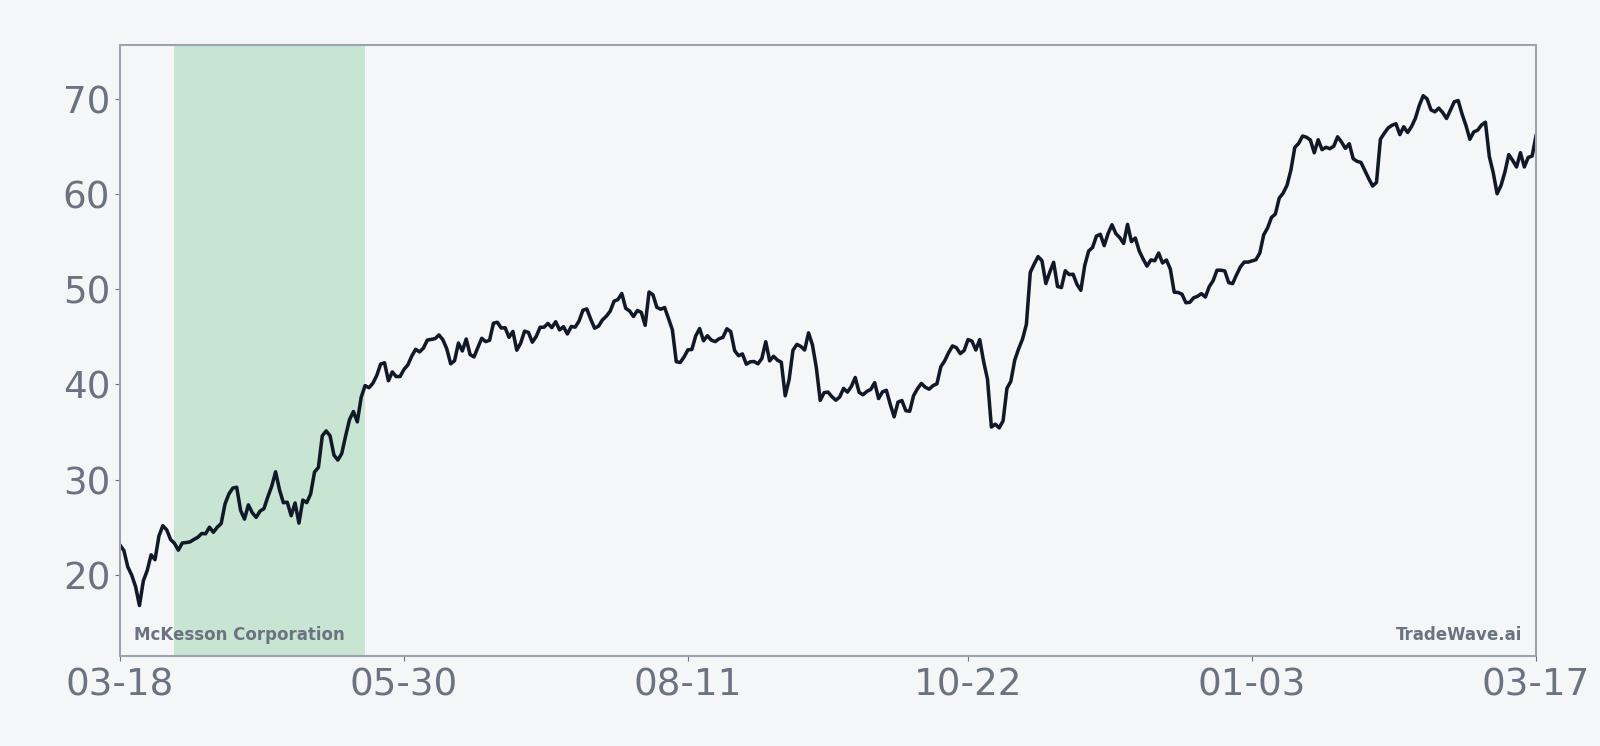
The typical seasonal path, based on the 10-year average trend, shows gains starting relatively early in the window and then grinding higher rather than spiking in a single burst. That profile matches the per-year pattern, where many cycles show a solid maximum favorable move that exceeds the final net return, suggesting that traders often see intraperiod rallies that partially fade by the close of the 50 days. The cumulative return chart for the window reinforces this picture of steady, additive gains rather than a one-off anomaly, with a 101% cumulative return across the decade.
The stacked net, peak run-up and worst-drawdown bars highlight the trade-off. Maximum favorable excursions have often pushed into double digits, while maximum adverse excursions have typically stayed in the mid-single digits, though 2017 and 2020 show that deeper dips are possible. For a long setup, that mix of sizable upside potential and manageable but real downside swings is what the 2.65 TradeWave Ratio is capturing: price has historically traveled meaningfully in the trade direction within this window.
History does not guarantee future results; adverse excursions (MAE) can be large even in winning windows.
Key takeaways
- McKesson’s 50-day spring window starting Apr 1 has finished positive in 10 of 10 years, with no losers.
- Average gain across those years is 7.28% for a long position, with cumulative returns of 101% over the decade.
- Maximum favorable moves inside the window have often reached double digits, while typical drawdowns have stayed in the mid-single digits.
- The stock enters this window at $885.84, about 11.3% below its 52-week high after a powerful February earnings rally.[3]
- Recent results and guidance point to strong specialty-drug momentum, which has underpinned the stock’s multi-year uptrend.[3][4]
According to historical data from TradeWave.ai, this specific 50-day stretch has behaved very differently from an average month on the calendar, with a decade of consistent upside for McKesson.
Price and near-term drivers
McKesson shares closed Monday at $885.84, down 1.46% on the day, leaving the stock about 11.3% below its 52-week high of $999.00 and roughly 40% above its 52-week low of $633.26.[3] The pullback comes after a powerful run that saw the stock surge 17% in a single session on Feb 6, when stronger-than-expected earnings and raised guidance reset expectations for the drug distributor.[3]
On that February earnings day, McKesson reported adjusted earnings per share of $9.34, topping estimates of $9.19, and highlighted double-digit revenue growth tied to specialty medicines.[3] The company also lifted its fiscal 2026 adjusted EPS forecast into a range that, across various updates, has moved from $36.75 to as high as $39.20, reflecting confidence in demand for high-margin oncology and other specialty drugs.[1][2][3][4] The market’s reaction signaled that investors had been underestimating both the earnings power and the operating leverage in McKesson’s model.
That February spike capped a multi-year climb built on the same theme. In May 2025, McKesson reported that fiscal 2025 fourth-quarter revenue rose 19% to $90.8 billion, while adjusted EPS jumped 64%, and it set an initial fiscal 2026 EPS range of $36.75 to $37.55.[4] Subsequent updates in August and November 2025 nudged that guidance higher as demand for specialty medicines continued to surprise to the upside, with revenue and profit both beating expectations.[1][2] The latest guidance hike in February 2026 extended that pattern and helped justify the stock’s move into the high-$900s before the recent consolidation.[3]
Sector and macro currents have been working in McKesson’s favor. In November 2025, Reuters reported that robust demand for specialty drugs, including treatments for cancer and other complex conditions, was driving higher profit margins for distributors like McKesson.[1] The company has leaned into that trend by expanding its oncology and specialty distribution footprint, which has supported both top-line growth and margin expansion.[1] For investors, that backdrop helps explain why the stock has been able to absorb periodic pullbacks and still trend higher over time.
Analysts have largely endorsed the story. LSEG data cited in prior coverage shows a consensus “Buy” rating on McKesson, reflecting confidence that the company can continue to grow earnings as specialty volumes rise.[1][2] While specific price targets were not detailed in the latest reports, the repeated guidance raises and earnings beats have tended to pull estimates higher over the past year, even as the stock has already rerated significantly.[1][2][3]
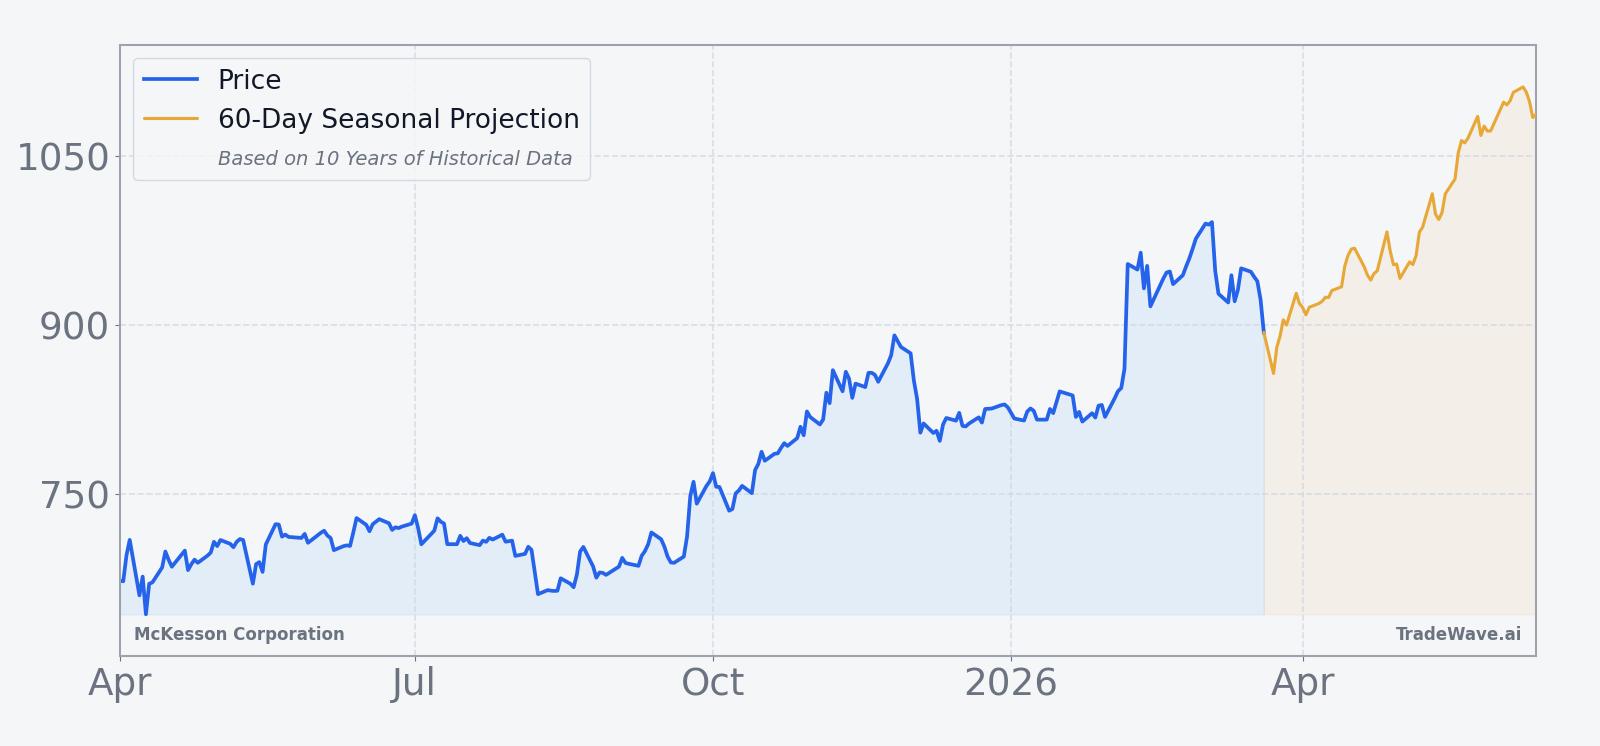
The chart below situates the latest pullback against McKesson’s strong multi-month uptrend and the upcoming seasonal projection.
Earnings and guidance backdrop
McKesson’s recent earnings cadence has been unusually strong for a mature distributor. For the most recent reported quarter, the company delivered revenue of $106.16 billion, up 11.4%, alongside adjusted EPS of $9.34 that edged past consensus forecasts.[3] In the prior fiscal fourth quarter, adjusted EPS of $10.12 represented a 64% year-over-year jump, underscoring how mix shift toward specialty drugs is amplifying profitability.[4]
Guidance has marched higher in stages. In May 2025, management set fiscal 2026 adjusted EPS at $36.75 to $37.55.[4] By August 2025, that range had been lifted to $37.10 to $37.90 on the back of stronger-than-expected specialty demand and a first-quarter revenue print of $97.83 billion that topped estimates.[2] In November 2025, the company again raised its outlook, this time to $38.35 to $38.85, citing continued robust demand for specialty drugs and improved margin visibility.[1] Some February 2026 commentary referenced an even higher range of $38.80 to $39.20, reflecting the latest upgrade tied to the Q3 beat.[3]
That steady guidance creep matters for the seasonal story. A stock that repeatedly beats and raises tends to attract momentum and long-only flows, which can reinforce positive seasonal tendencies if they line up with the calendar. McKesson’s 10-for-10 spring window sits on top of a fundamental narrative that has been improving for several years, rather than a one-off technical quirk.
Macro and sector context
McKesson sits at the center of a powerful macro trend: the rise of specialty medicines. Reuters reported in November 2025 that high-margin specialty drugs for conditions such as cancer are driving growth across the healthcare and pharmaceuticals ecosystem, boosting distributors that can handle complex logistics and patient-support programs.[1] McKesson has been investing heavily in oncology and specialty distribution, positioning itself as a key conduit between manufacturers, providers and payers.[1]
That positioning has two implications for the stock. First, it ties McKesson’s earnings trajectory more closely to secular healthcare demand than to short-term macro cycles, which can dampen volatility relative to more cyclical sectors. Second, it gives the company leverage to volume and mix shifts that can expand margins even in a slow-growth environment. For a seasonal pattern that has historically favored longs in the spring, a stable macro tailwind can help sustain the kind of steady, grind-higher behavior seen in the 10-year average trend.
Valuation and positioning
Specific valuation multiples were not detailed in the latest reports, but the combination of a strong multi-year rally and repeated guidance hikes suggests that McKesson is trading at a premium to its own history, if not necessarily to high-growth healthcare peers.[1][2][3][4] The February 17% one-day jump on earnings and guidance is the kind of move that often flushes out shorts and forces underweight investors to chase, which can leave positioning stretched in the short term.[3] The subsequent pullback into late March has eased some of that pressure, but the stock remains elevated versus its 52-week low.
For traders watching the upcoming seasonal window, that backdrop cuts both ways. A rich valuation and crowded long positioning can make any adverse macro or company-specific surprise more painful, especially in a window that has historically seen mid-single-digit drawdowns even in winning years. At the same time, if earnings estimates continue to drift higher and specialty demand stays firm, the stock may find support from fundamental buyers on dips, which has been a recurring feature of the past decade.
What to watch as the window opens
As Apr 1 approaches, the key test will be whether McKesson’s price action respects the historical pattern of steady spring gains or breaks from it. The first marker is the $900 area, close to the 50-day moving average, which has acted as a pivot in recent weeks; sustained trade back above that zone would fit the typical early-window grind higher, while a decisive break lower would signal a different regime.[3]
Earnings and guidance commentary will remain central. Although the next formal earnings date has not yet been set, any pre-announcements or sector read-throughs on specialty-drug demand could influence how investors treat dips during the window.[1][2][3][4] Traders will also be watching for follow-through from February’s high-volume surge: if volumes stay elevated on up days and muted on down days, it would suggest that institutional buyers are still adding, which has historically aligned with positive seasonal outcomes.[3]
Finally, behavior inside the window itself will be the real tell. A pattern of early drawdowns in the mid-single digits followed by recoveries toward new highs would echo several past years and keep the 10-for-10 streak intact. A deeper, persistent break that fails to recover by the end of the 50 days would mark a clear departure from the decade-long script. For a stock that has become a key proxy for specialty-drug growth, how McKesson trades through this spring stretch will offer a clean read on whether its seasonal edge is still intact.
Sources
- Reuters, "McKesson raises annual profit forecast on robust demand for specialty drugs," Nov 5, 2025.
- Reuters, "Mckesson lifts annual profit forecast on robust demand for specialty drugs," Aug 6, 2025.
- Forbes, "How McKesson Stock Surged 17% In A Day," Feb 6, 2026.
- McKesson, "McKesson Reports Fiscal 2025 Fourth Quarter and Full Year Results," May 8, 2025.