McKesson Corporation (MCK) Has Rallied in 10 Straight 50-Day Spring Windows
McKesson Corporation is heading into a historically strong 50-day spring stretch just as shares cool from February’s earnings spike and sit well below their 52-week high.

Key takeaways
- From Apr 1, McKesson Corporation enters a 50-day window that has produced gains in 10 of 10 years, a 100% hit rate for long trades.
- Average profit across those years is 7.28%, with a median gain of 6.35% and cumulative returns of 101% over the decade.
- The pattern is long-biased, with a Trade Direction of “long,” a TradeWave Ratio of 2.65 and a Sharpe ratio of 1.89, pointing to historically strong risk-adjusted upside.
- Intraperiod swings have been meaningful, with maximum adverse moves as deep as about 9% in some years even though every window finished positive.
- Today the stock trades at $863.56, down 1.8% on the day and about 13.6% below its 52-week high of $999, after a 17% earnings-driven surge in early February.[3]
- Strong specialty-drug demand and raised fiscal 2026 EPS guidance have underpinned the rally, setting up a bullish fundamental backdrop for the upcoming seasonal window.[3]
According to historical data from TradeWave.ai, this specific spring stretch has behaved very differently from an average month on the McKesson calendar.
Seasonal window
McKesson Corporation has risen in 10 of 10 years during this 50-day spring window, averaging 7.28% gains. The next iteration begins on Apr 1, with the stock closing Friday at $863.56, down 1.8% on the day and about 13.6% below its 52-week high of $999.[3] That combination of a clean seasonal track record and room to the prior high is what has this window on traders’ radar.
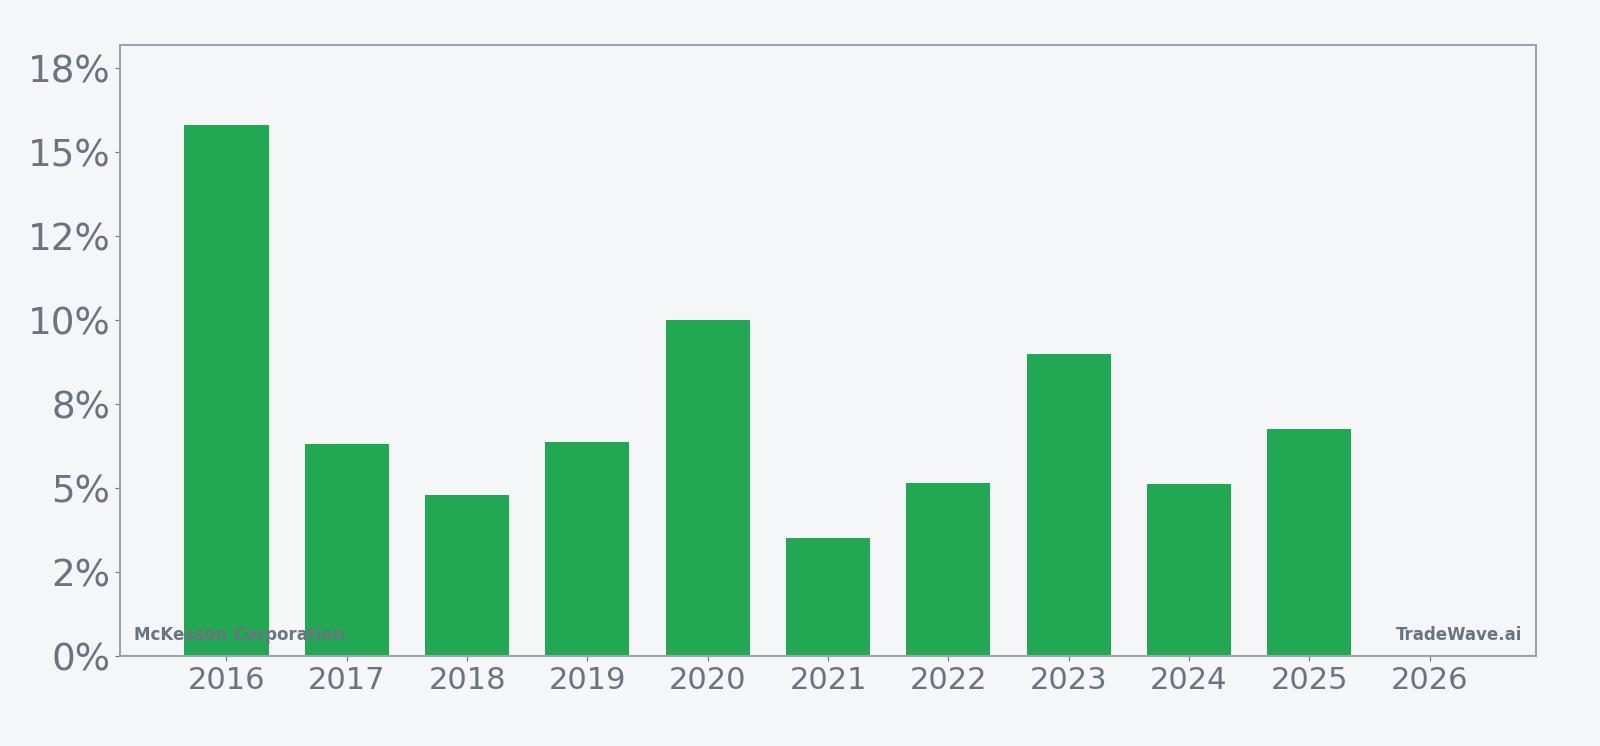
Across the 10-year sample, the long setup has not produced a single losing year. The weakest outcome was a 3.53% gain in 2021, while the strongest was a 15.81% rally in 2016. Add it up and the cumulative return across these ten spring windows is 101%, meaning this slice of the calendar alone has historically doubled long exposure over the decade.
The average winner’s gain of 7.28% sits slightly above the median 6.35%, which tells you the distribution is not being driven only by one or two outlier years. Even the softer years like 2018 and 2024 still finished with mid-single-digit advances. For a defensive healthcare distributor, that is a surprisingly consistent seasonal tailwind.
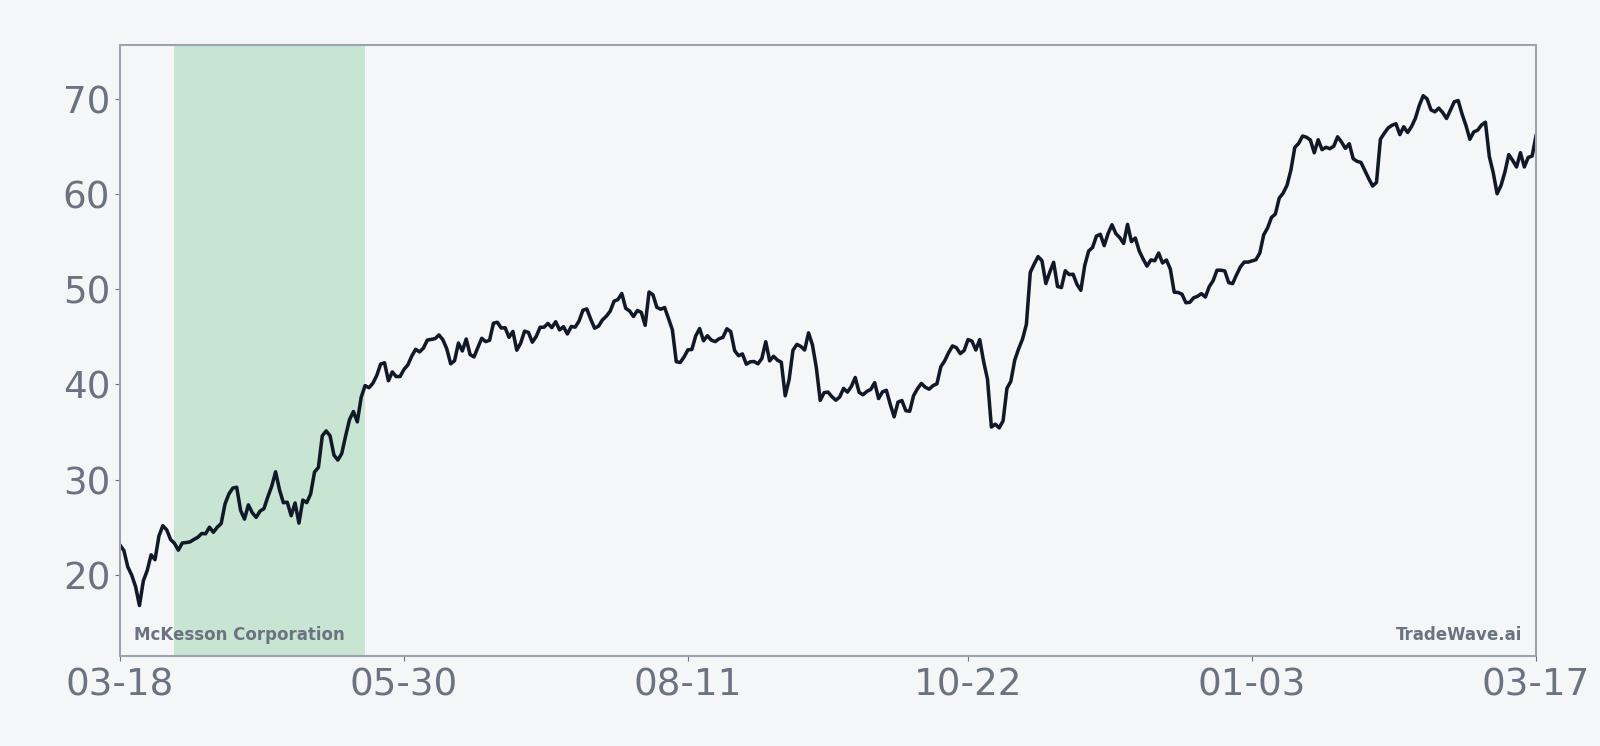
The historical seasonal average shows gains building steadily through the middle of the window rather than spiking only at the end. In several years, including 2016, 2019 and 2020, the strongest advances came after an early consolidation, which fits the idea of a grind higher rather than a one-day event.
Yearly net and peak moves highlight upside persistence amid typical drawdowns.
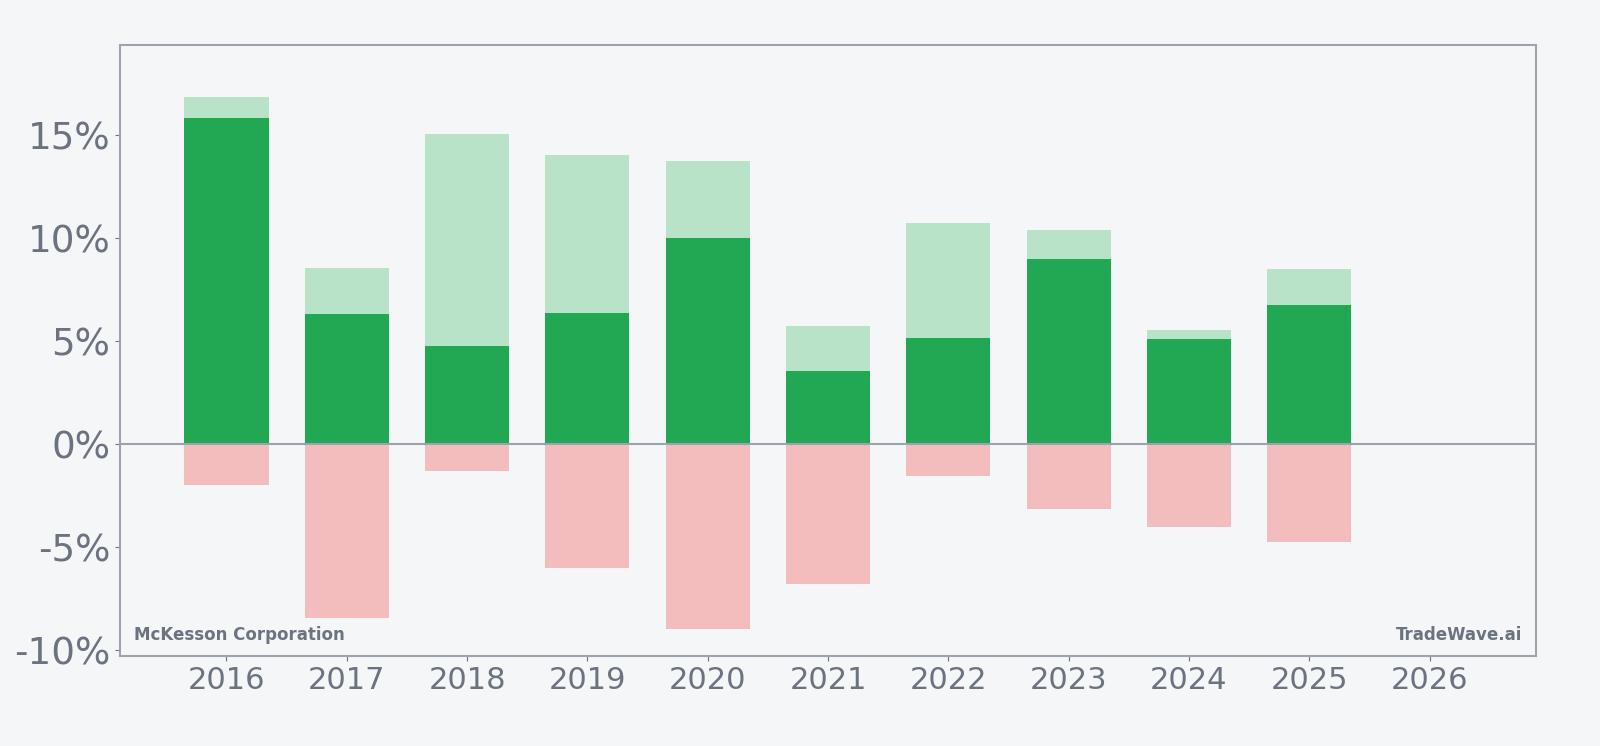
Intraperiod swings have still mattered. In 2017 and 2020, for example, the stock ultimately finished the window higher but saw worst-case drawdowns of about 8% to 9% from the entry before recovering. Maximum favorable moves have often stretched into the low- to mid-teens, with years like 2016 and 2018 posting peak run-ups above 15% and 15% respectively before settling back by the close. That mix of double-digit upside potential and mid-single- to high-single-digit downside excursions is what the TradeWave Ratio of 2.65 and Sharpe ratio of 1.89 are capturing in a single set of summary numbers.
History does not guarantee future results; adverse excursions (MAE) can be large even in winning windows.
Still, the headline takeaway is simple: ten for ten. For a decade, this 50-day stretch starting Apr 1 has favored long positions in McKesson, with every year finishing in the green and several delivering double-digit percentage gains.
Price and near-term drivers
McKesson shares closed Friday at $863.56, down 1.8% on the session, extending a roughly 6.35% slide over the past month and leaving the stock about 13.6% below its 52-week high of $999.[3] That pullback comes after a powerful move earlier in the quarter, when the stock jumped 17% in a single day on heavy volume following stronger-than-expected fiscal third-quarter results and a guidance hike.[3]
On Feb 6, McKesson reported adjusted third-quarter EPS of $9.34, topping analyst expectations and accompanied by an 11.4% year-on-year revenue increase to $106.16 billion.[3] Management raised its fiscal 2026 adjusted EPS forecast to a range of $38.80 to $39.20, building on earlier guidance lifts tied to robust demand for high-margin specialty medicines in oncology and other complex conditions.[1][2][4] That earnings momentum has been the fundamental engine behind the stock’s multi-year climb and helps explain why buyers were willing to chase the February spike.
Specialty drugs remain the core story. The company’s U.S. Pharmaceutical segment has been the main growth driver, benefiting from rising volumes and favorable economics in complex therapies that command premium pricing.[1][2] In fiscal 2025, McKesson delivered adjusted EPS of $33.05, up 20% from the prior year, and management’s successive upgrades to fiscal 2026 guidance signal confidence that this trend has legs.[4] For a stock that has already rerated higher, the question for traders is how much of that growth is now embedded in the price as the seasonal window approaches.
The chart below situates the latest move in its recent multi-month context, including the February earnings spike and the current consolidation phase.
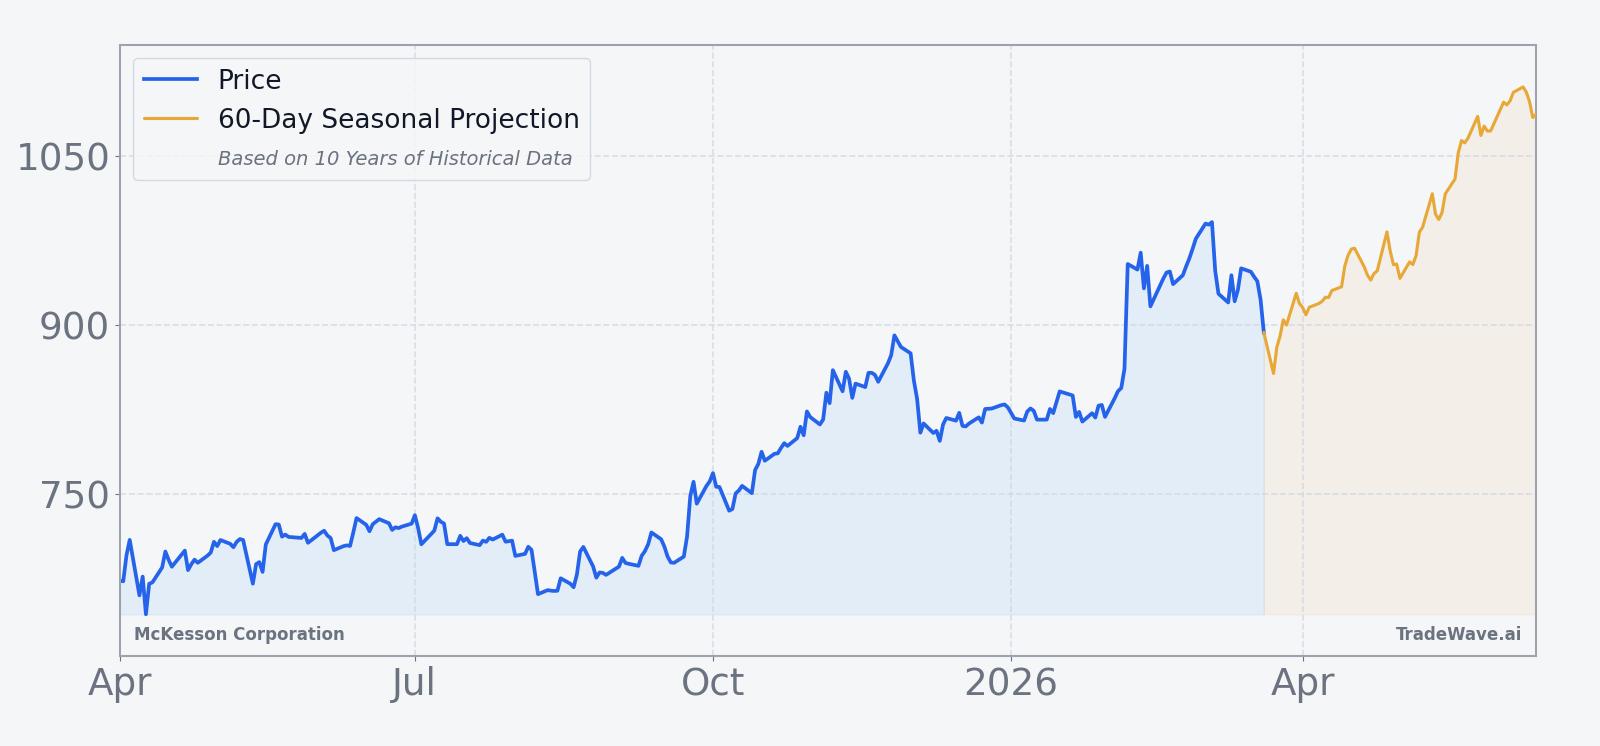
From a positioning standpoint, the February volume spike signaled aggressive institutional interest as investors digested the stronger outlook.[3] Since then, the stock has slipped below its 50-day moving average of about $900, with average 20-day volume running near 704,000 shares, suggesting a cooling phase rather than a disorderly reversal. With the consensus analyst rating at “Buy” according to LSEG, the street remains constructive on the name even as the tape consolidates.[1][2][3]
Earnings and guidance backdrop
McKesson’s recent earnings cadence has been unusually consistent. Fiscal 2025 adjusted EPS of $33.05 represented a 20% jump from $27.44 a year earlier, powered by growth in the U.S. Pharmaceutical business and continued cost discipline.[4] In the current fiscal year, the company has twice raised its adjusted EPS outlook, first to $38.35 to $38.85 and later to $38.80 to $39.20, as specialty-drug demand outpaced earlier assumptions.[1][2][3]
Revenue has also been tracking ahead of expectations. Second-quarter sales came in at $103.15 billion versus an estimate of $104.13 billion, while third-quarter revenue grew 11.4% to $106.16 billion, underscoring the scale of McKesson’s distribution footprint.[3] The combination of double-digit top-line growth and expanding earnings has given management room to lean into shareholder returns without sacrificing investment in higher-growth niches.
Looking ahead, the absence of a scheduled near-term earnings date means the upcoming seasonal window is less likely to be dominated by a single results-day shock. Instead, traders will be watching for incremental updates on specialty-drug trends and any commentary from management or peers that could validate or challenge the current guidance trajectory.
Sector and macro context
McKesson sits at the intersection of healthcare demand and drug-pricing dynamics, which tend to be less cyclical than broader economic activity. Growth in specialty medicines for cancer and other complex diseases has been a key tailwind, as these therapies carry higher margins and often involve intricate distribution and support services that favor scale players.[1] That structural backdrop has helped the stock outperform many traditional distributors and has cushioned it against macro slowdowns.
At the same time, policy risk around drug pricing and reimbursement remains a constant overhang for the sector. While no single headline in recent months has reset the thesis, investors in McKesson typically keep one eye on Washington and another on the pipeline of new specialty therapies that could flow through its network. The seasonal window starting in April will unfold against that familiar mix of defensive demand and regulatory noise.
Valuation and positioning check
With the stock roughly 13.6% below its 52-week high and trading under its 50-day moving average, the near-term setup looks more like a pause than a blow-off top.[3] The lack of a widely cited, up-to-date consensus price target makes it harder to anchor valuation to a single number, but the “Buy” rating from LSEG’s surveyed analysts suggests the street still sees upside relative to current levels.[1][2][3]
For traders focused on the upcoming seasonal window, the key question is whether February’s 17% earnings pop exhausted near-term buying power or simply reset the base for another leg higher.[3] The historical pattern argues that this part of the calendar has often rewarded long exposure, but the magnitude of prior intraperiod drawdowns is a reminder that even strong setups can involve uncomfortable volatility.
What to watch as the window opens
As Apr 1 approaches, the first marker to watch is how McKesson behaves around its 50-day moving average near $900. A sustained push back above that level during the window would be consistent with the historical pattern of mid-window strength, while a failure to reclaim it would be an early sign that this cycle may diverge from the past.
Second, traders will be tracking whether the February volume surge was a one-off reaction to earnings or the start of a longer accumulation phase.[3] Continued elevated volume on up days would suggest institutions are still building positions into weakness, whereas fading activity or heavy selling on rallies would hint at profit-taking and a more fragile tape.
Third, any updates on specialty-drug demand from McKesson or peers will matter. Positive commentary that reinforces the raised fiscal 2026 EPS guidance would align with the bullish seasonal backdrop, while signs of slowing volumes or pricing pressure could blunt the historical tailwind.[1][2][4]
Finally, behavior inside the window itself will be the real test. If the stock can absorb typical mid-single-digit drawdowns and still grind higher toward or through prior highs, it would mark an eleventh straight win for this spring pattern. A sharp break that fails to recover would be the first real challenge to a decade-long seasonal streak.
Sources
- Reuters: McKesson raises annual profit forecast on robust demand for specialty drugs (Nov 5, 2025)
- Reuters: McKesson lifts annual profit forecast on robust demand for specialty drugs (Aug 6, 2025)
- Forbes: How McKesson Stock Surged 17% In A Day (Feb 6, 2026)
- McKesson: Fiscal 2025 Fourth Quarter and Full Year Results (May 8, 2025)