Hasbro (HAS) Has Rallied in 9 of 10 Years in This 21-Day April Window
Hasbro shares are trading below their recent peak as a historically strong 21-day April window approaches, giving traders a defined seasonal backdrop against tariff and gaming story lines.

Key takeaways
- Hasbro’s 21-day window starting Apr 6 has been bullish, with gains in 9 winners versus 1 loser over the past decade.
- Average profit in winning years is 8.29%, while including all years the average outcome is a 7% gain for long positions.
- The pattern is long-directed, with a TradeWave Ratio of 1.66 and a Sharpe ratio of 1.1, pointing to historically favorable risk-adjusted returns.
- Intraperiod swings have been meaningful, with some years showing double-digit run-ups and mid-single-digit drawdowns before finishing higher.
- Today HAS trades at 92.19, about 13.8% below its 52-week high of 106.98, after a 7.58% slide over the past month.
- Tariff pressures and a shift toward digital gaming remain key fundamental drivers as the stock heads into this historically strong stretch.[1][2][3]
According to historical data from TradeWave.ai, this early April stretch has behaved very differently from an average month for Hasbro. The next section walks through how that pattern has played out across the past ten years without making any prediction about what comes next.
Seasonal window
Hasbro has risen in 9 of the past 10 years during the 21 trading days starting Apr 6, with winning years averaging an 8.29% gain. The upcoming window begins with the stock at 92.19, about 13.8% below its 52-week high of 106.98 and after a 7.58% drop over the last month. That mix of a strong historical tailwind and a stock trading off its highs gives this particular slice of the calendar more weight than usual.
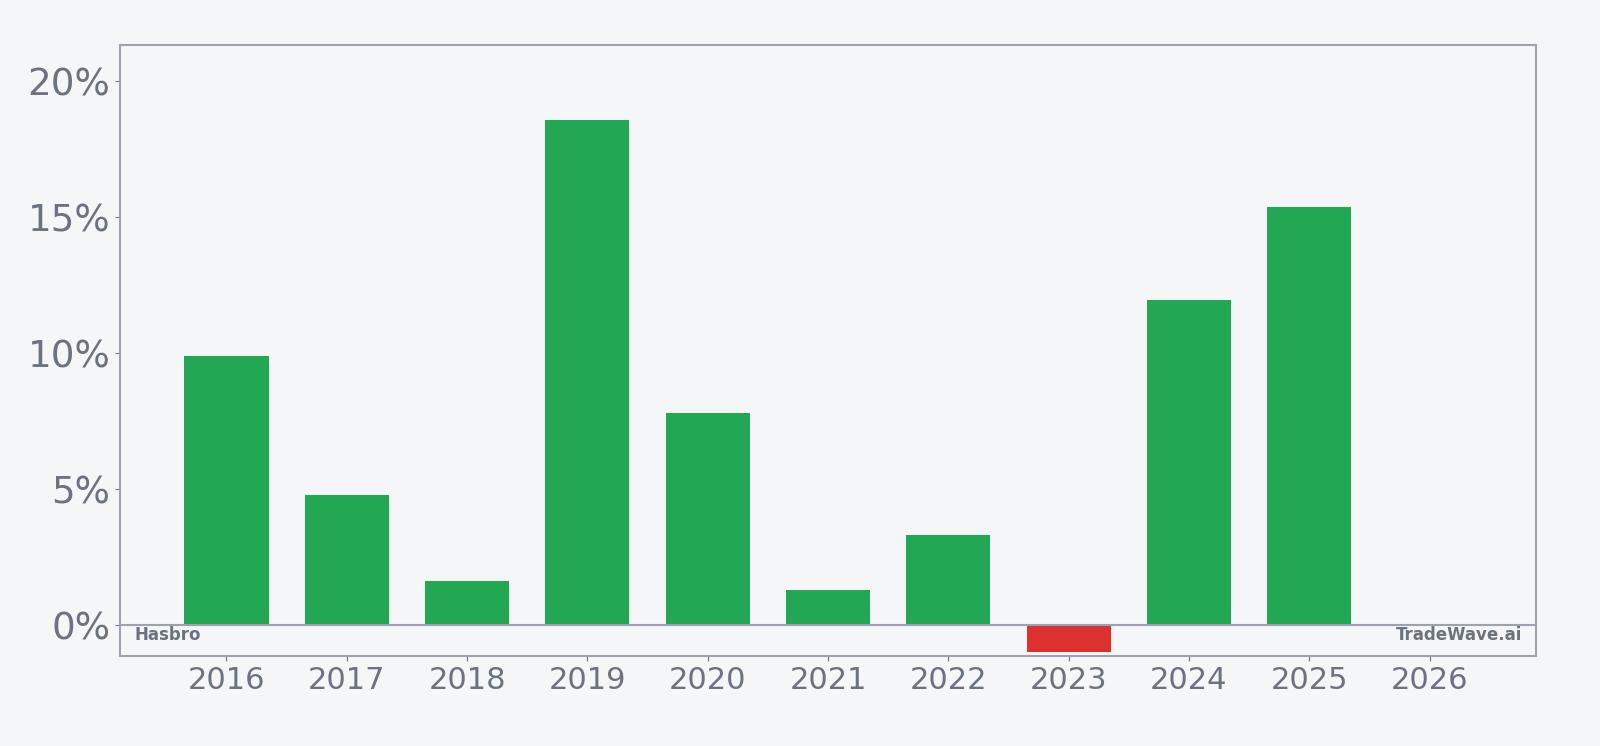
Historically this has been a long-biased setup. Across the ten-year sample, the all-years average outcome is a 7% gain for long positions, with only one losing year and a median profit of 6.3%. The lone down year, 2023, saw just a 1.0% loss, while strong years such as 2019 and 2025 posted net gains of 18.56% and 15.37% respectively, showing how powerful the upside has been when the pattern clicks.
The typical path inside the window has featured early strength that often builds into the back half. In 2019, for example, Hasbro’s best intraperiod move reached 19.63% above the entry price, while the worst drawdown from entry was limited to 2.06%. In 2024 the stock rallied as much as 15.25% at the peak before finishing the window up 11.95%, even after enduring a 5.78% pullback from entry at one point.
There have been choppier years as well. In 2018 the stock finished only 1.63% higher, but that came after a 5.48% run-up and a 6.43% drawdown from the starting level, a reminder that even modest final gains can hide a lot of intraperiod noise. The 2023 window, the only loser in the set, still saw a 2.54% peak move higher before slipping to a 1.0% net decline, with the worst drawdown limited to 2.23%.
Stacked bars of net results with peak run-ups and worst drawdowns show how upside and downside have coexisted inside this window.
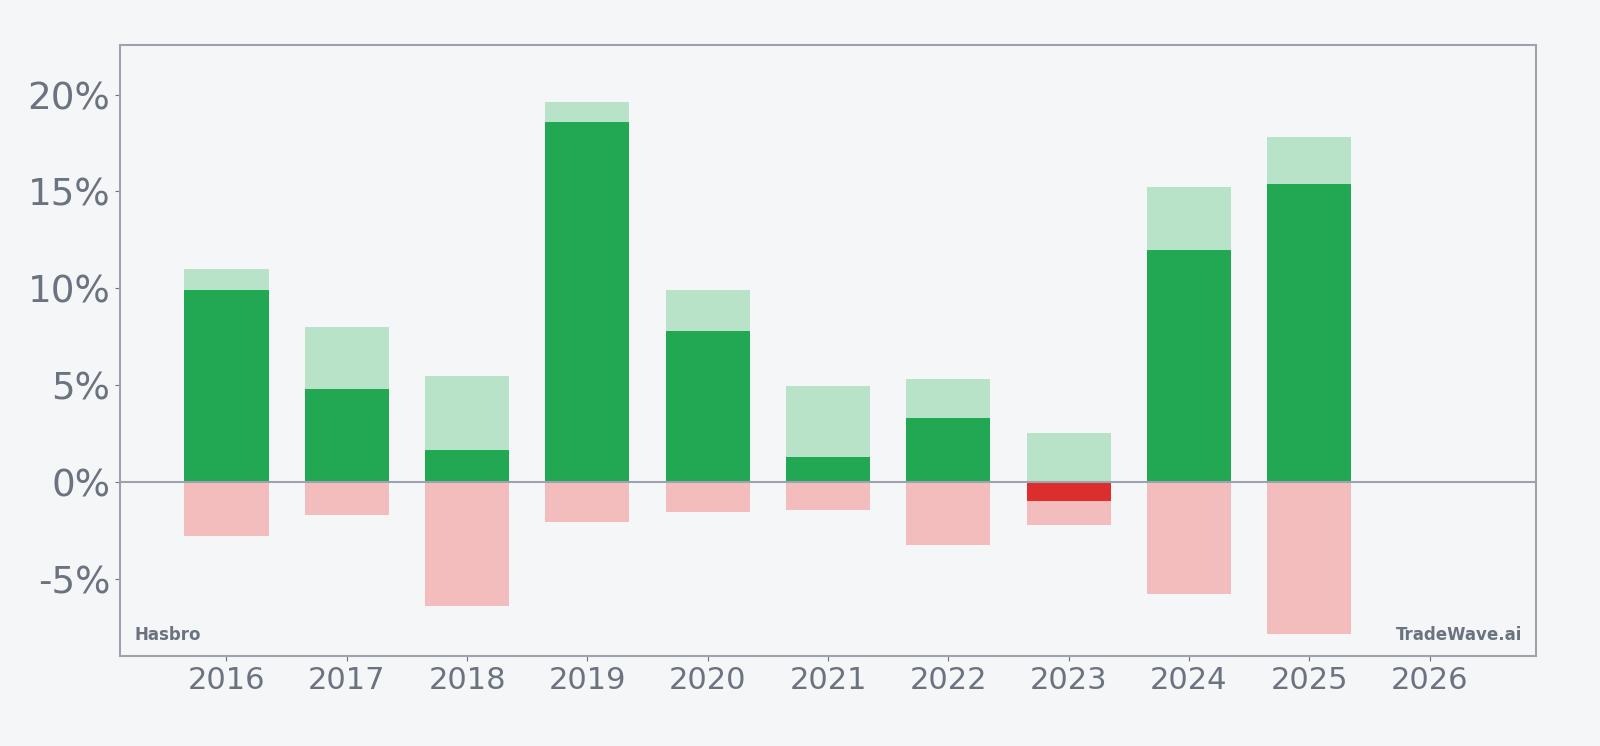
History does not guarantee future results; adverse excursions can be large even in winning windows, and traders should size positions with that intraperiod risk in mind.
Add it up: nine wins, one small loss, and several double-digit rallies give this April stretch a clear bullish tilt for long setups, even if the ride has not always been smooth.
Price and near-term drivers
Hasbro closed Thursday at 92.19, down 0.44% on the day, extending a one-month slide of 7.58% and leaving the stock about 13.8% below its 52-week high of 106.98. Trading volume of 969,449 shares came in below the 20-day average of roughly 1.51 million, suggesting the pullback has been more of a grind than a capitulation move.
Fundamentally, the story is still defined by a tug-of-war between tariff pressure and digital strength. In Q2 2025, Hasbro delivered adjusted EPS of $1.30 versus a $0.78 estimate on revenue of $980.8 million, helped by strong demand for Magic: The Gathering in its Wizards of the Coast and Digital Gaming segment, even as traditional toy sales and tariffs weighed on the top line.[3] In Q3 2025, revenue rose 8% to $1.39 billion, beating expectations, and adjusted EPS of $1.68 topped forecasts, prompting management to lift its full-year revenue and EBITDA outlook to high-single-digit growth and $1.24 billion to $1.26 billion respectively.[2]
Tariffs remain a structural headwind. In June 2025, Hasbro cut about 3% of its workforce as it worked to offset higher costs tied to tariffs on Chinese imports and to diversify its manufacturing footprint.[4] Those moves underline how sensitive the business is to trade policy and input costs, even as the company leans harder into higher-margin digital franchises.
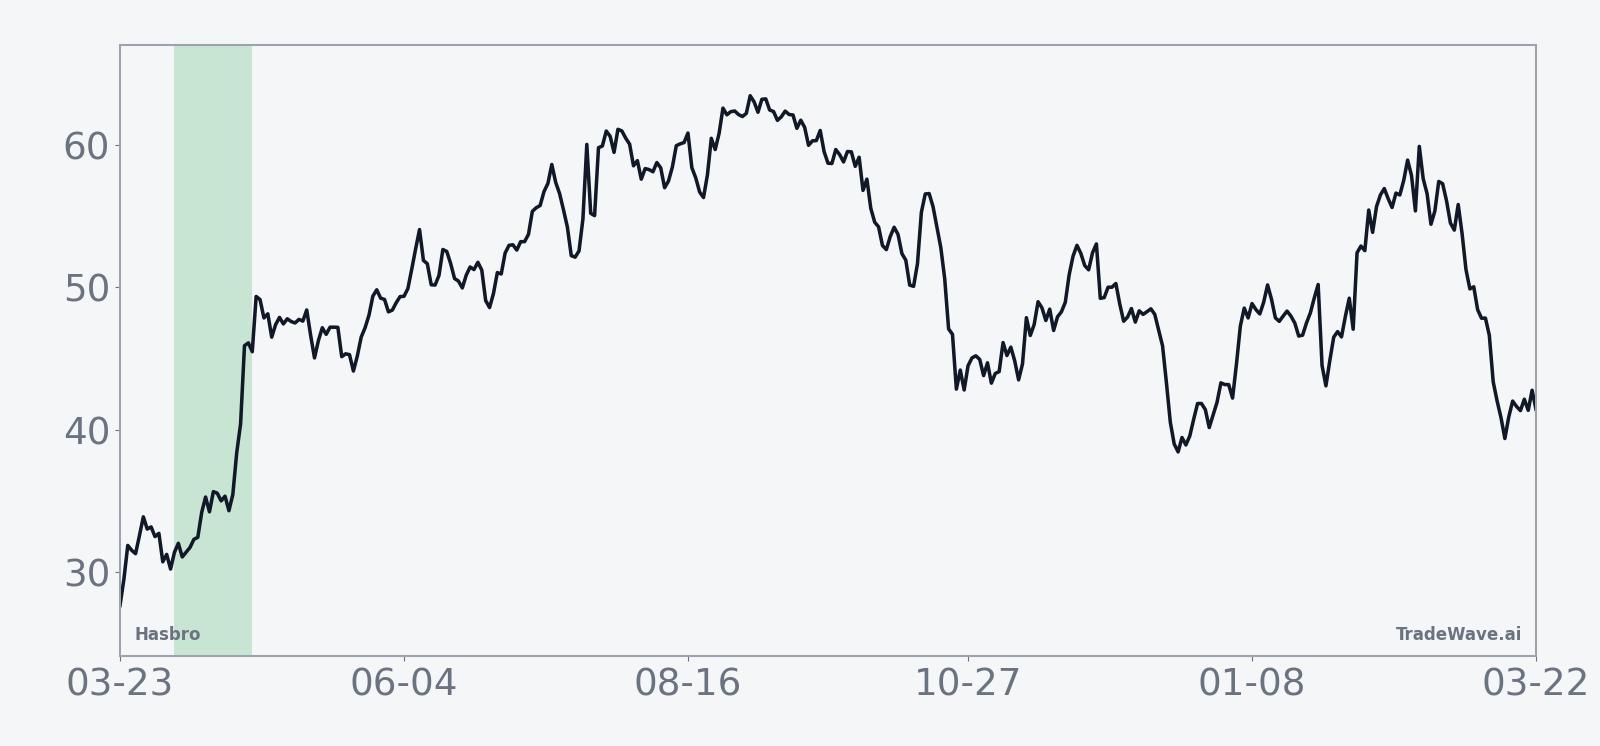
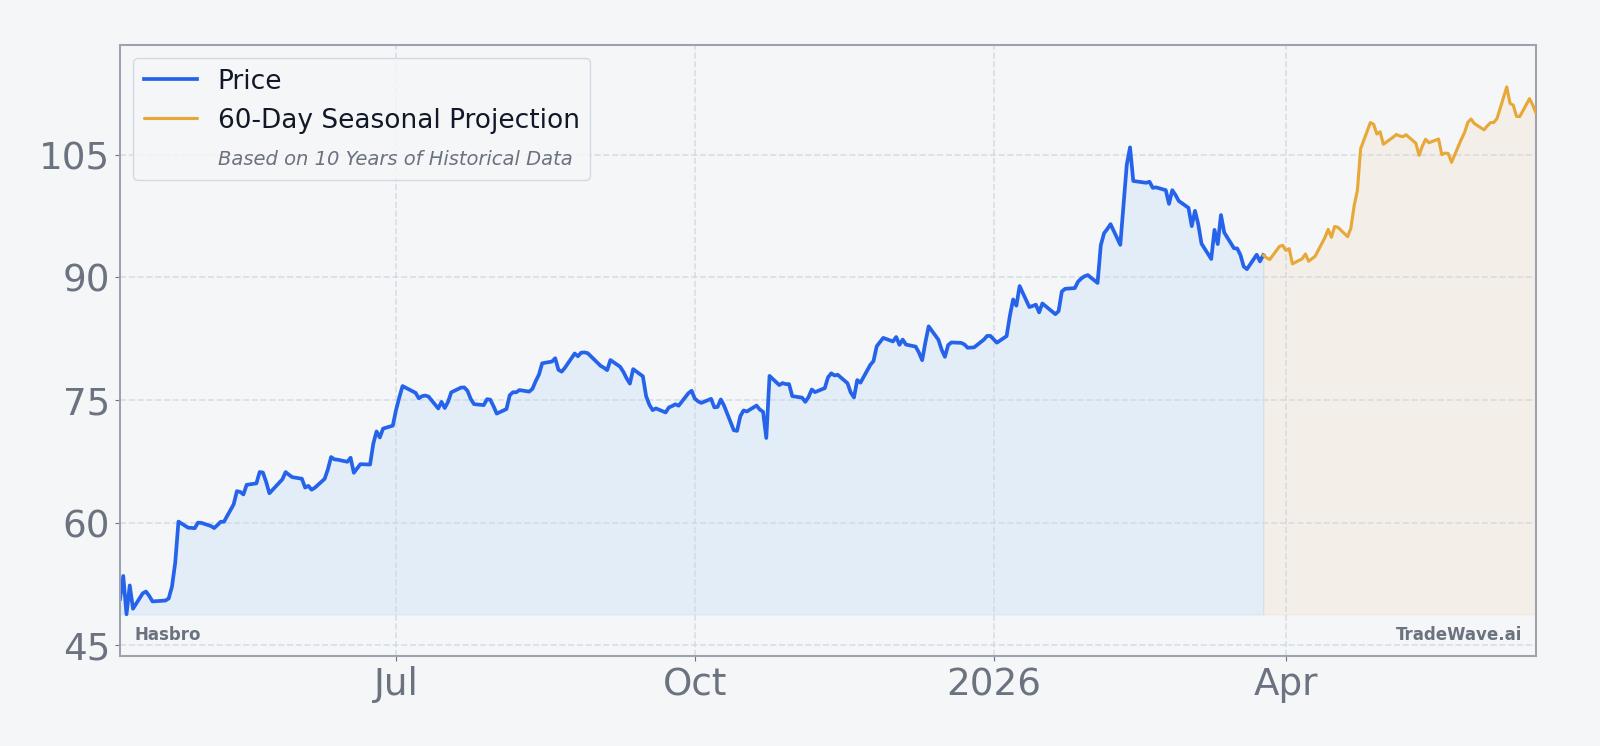
The chart below situates the latest pullback and consolidation against the past year of trading and the forward seasonal projection.
Earnings backdrop
Looking ahead, the next scheduled catalyst on the calendar is Hasbro’s Q3 2025 earnings report on Oct 23, 2025, where investors will look for confirmation that raised guidance and digital momentum are holding up against tariff and cost pressures.[1][2] Street commentary has focused on whether high-single-digit revenue growth and the $1.24 billion to $1.26 billion adjusted EBITDA target are achievable without deeper cuts to traditional toy investments.[2][3]
For traders eyeing the April seasonal window, the key point is that the company enters this period with upgraded guidance already on the table rather than looming event risk. That reduces the odds of a surprise guidance reset landing in the middle of the window, though macro or policy headlines could still inject volatility.
Macro and sector context
Hasbro sits at the intersection of consumer discretionary spending and digital entertainment. The toy and gaming industry has been wrestling with shifting consumer preferences and digital saturation, with physical toy demand under pressure while digital gaming and collectible card games pick up the slack.[1][3] For Hasbro, that has meant leaning harder into Wizards of the Coast and digital initiatives to offset softness in legacy toy lines.
Tariffs on Chinese imports add another layer. Higher input costs have already driven workforce reductions and a push to diversify manufacturing, and any change in trade policy could quickly alter margin expectations.[4] For a stock that has historically rallied in early April, a backdrop of policy uncertainty and evolving consumer behavior makes the upcoming window less about a simple “seasonal trade” and more about how those forces intersect with a strong historical pattern.
Valuation snapshot
Traditional valuation markers such as forward P/E and consensus price targets are harder to pin down from public summaries alone, but the market’s message is clear enough: at 92.19, Hasbro trades well above the mid-2020s trough near the 52-week low of 46.30 yet still meaningfully below its recent high. The 50-day moving average sits at 94.54, slightly above the current price, which frames the stock as consolidating just under a short-term trend line rather than in a runaway uptrend or breakdown.
What to watch as the window opens
For traders tracking this pattern, the first checkpoint is how Hasbro behaves as the Apr 6 window begins. A move back above the 50-day moving average near 94.54 with firm volume would be consistent with prior strong years, especially if the stock can hold above recent lows around 91 on any intraday dips. Conversely, a decisive break toward the lower 80s early in the window would mark a clear departure from the typical path and raise the odds that this cycle looks more like 2023’s lone losing year.
Fundamentally, watch for any fresh commentary on tariffs, supply chain shifts, or the performance of Magic: The Gathering and other digital franchises. New headlines on trade policy or consumer spending could either reinforce or overwhelm the historical pattern, particularly if they alter expectations for the high-single-digit revenue growth and $1.24 billion to $1.26 billion EBITDA guidance laid out in late 2025.[1][2][4]
Inside the window, intraperiod behavior matters as much as the final print. In prior years, strong runs have often come with mid-window pullbacks of 3% to 6% from entry before the stock reasserted its trend. If Hasbro again shows a sharp early rally followed by a controlled drawdown that holds above key support, that would fit the historical script. A failure to bounce after a typical-sized dip, or a deeper-than-usual slide, would be an early sign that this iteration is breaking pattern.
Bottom line: the April window has been one of Hasbro’s most reliable bullish stretches over the past decade, but with tariffs, digital transition and a stock still below its highs, traders will need to watch both price levels and headlines closely to see whether history rhymes this time.