McKesson Corporation (MCK) Has Rallied 10 of 10 Springs, Averaging 7.03% Gains in This 45-Day Window
McKesson Corporation is heading into a historically strong 45-day spring trading window just as shares hover near record levels after a powerful post-earnings run.

What is the seasonal pattern for McKesson Corporation (MCK)?
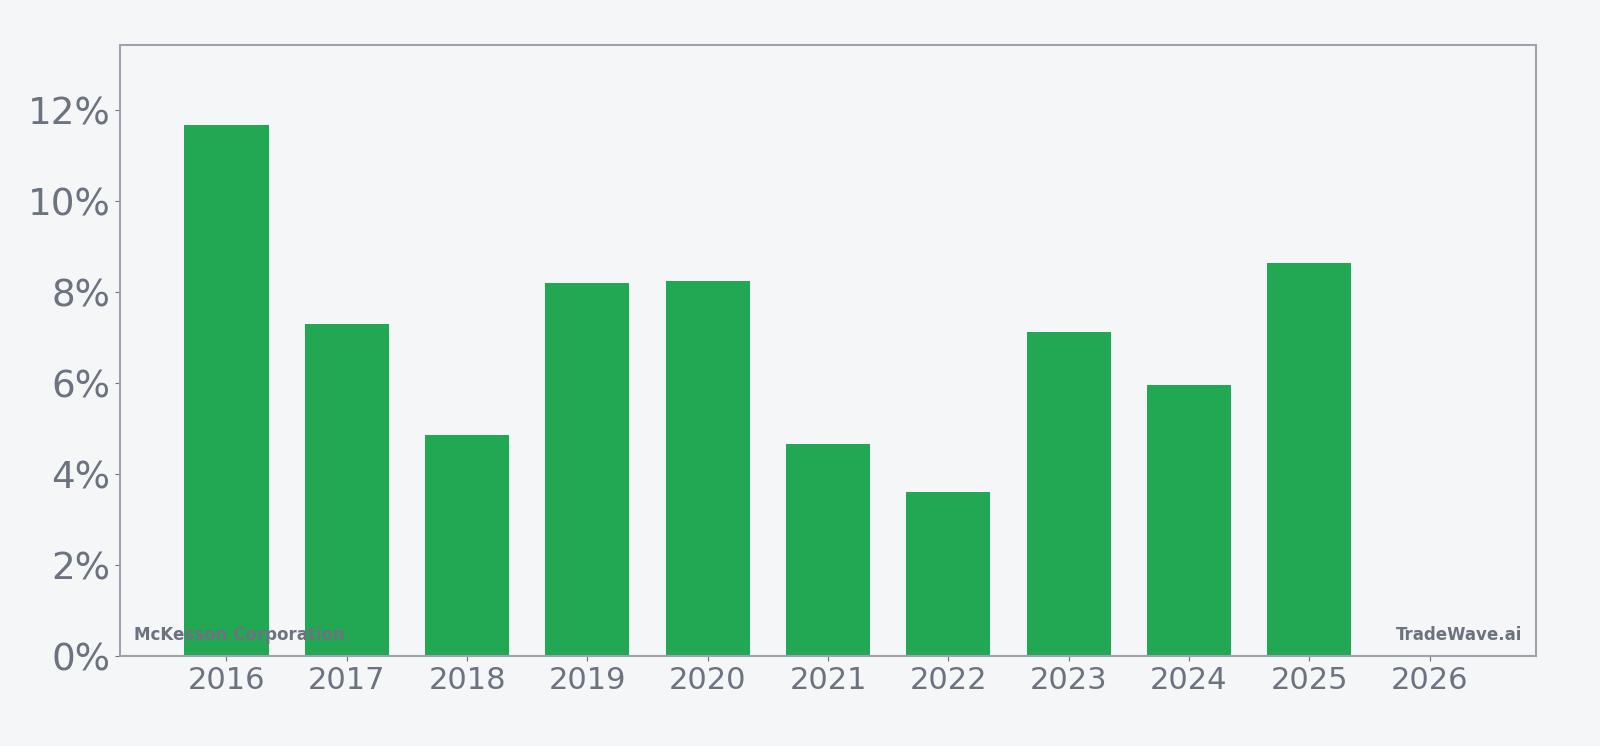
McKesson Corporation has risen in 10 of 10 years during this April–May window, with an average gain of 7.03% in winning years.
- 10 for 10 in this 45-day spring window, with average gains of 7.03% across all winning years.
- Seasonal window runs from Apr 6 for 45 trading days, forming a consistently bullish MCK seasonal trend.
- Percent Profitable is 100%, with 10 winners and 0 losers over the past decade in this McKesson Corporation trading window.
- Average winner gain of about 7% stacks up to a 96% cumulative return across the ten historical windows.
- Intraperiod swings have been meaningful, with individual years showing double-digit peak run-ups and several percentage points of downside before finishing higher.
- For a defensive healthcare distributor, this April–May stock pattern analysis stands out as unusually consistent upside seasonality.
According to historical data from TradeWave.ai, this upcoming stretch has behaved very differently from an average month on the calendar for McKesson. The next section walks through how that pattern has played out over the past decade and where the risks have shown up inside the window.
How has McKesson Corporation (MCK) traded in this April–May window?
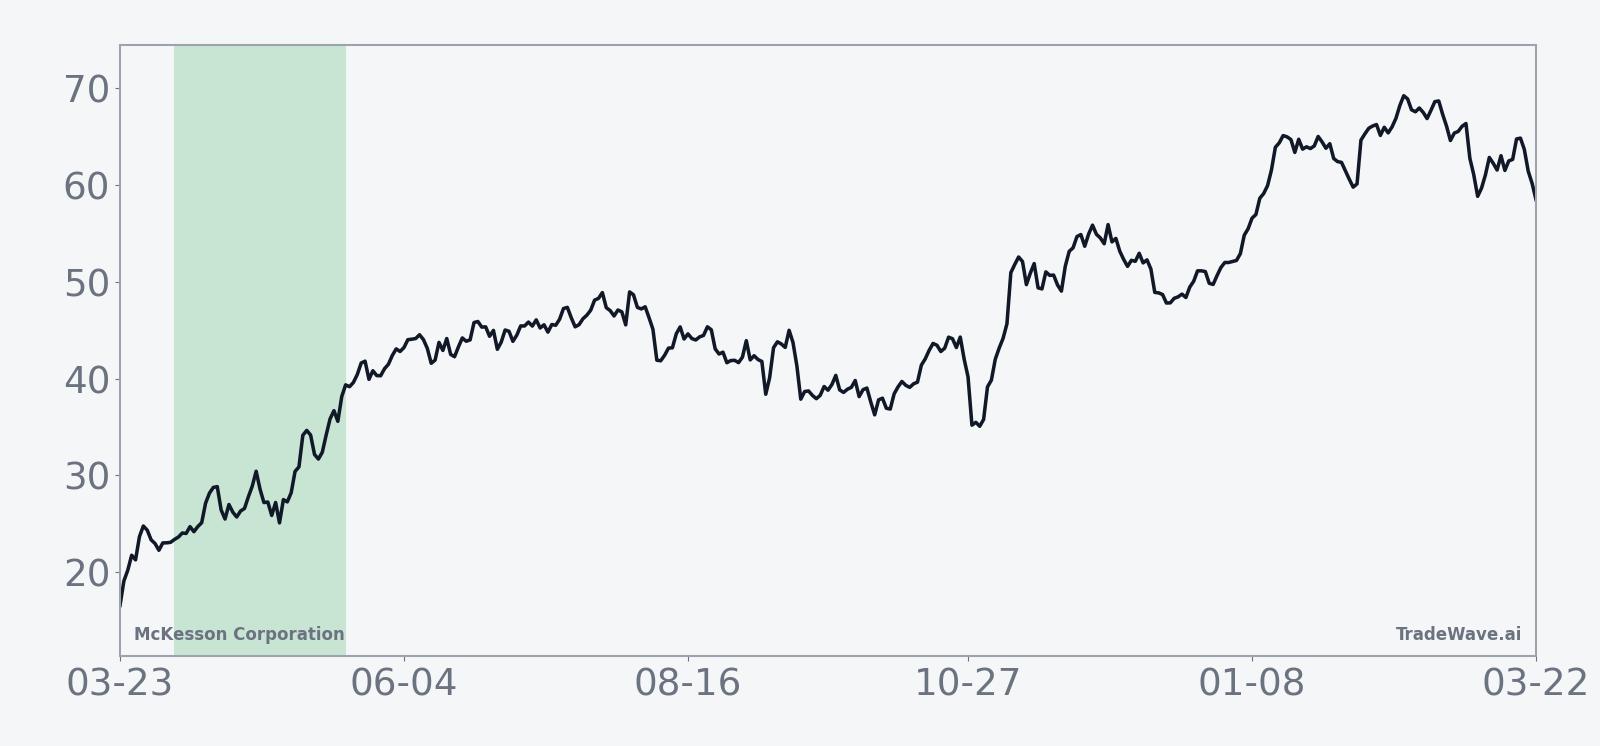
McKesson Corporation has posted gains in every one of the past 10 years during the 45 trading days starting Apr 6, averaging a 7.03% rise in this seasonal window. The stock closed Tuesday at 865.36, up 0.6% on the day and about 13.4% below its 52-week high of 999.00.[1] That combination of a clean 10-for-10 spring record and a stock that has already run hard into the upper end of its range gives this year’s window more weight than usual.
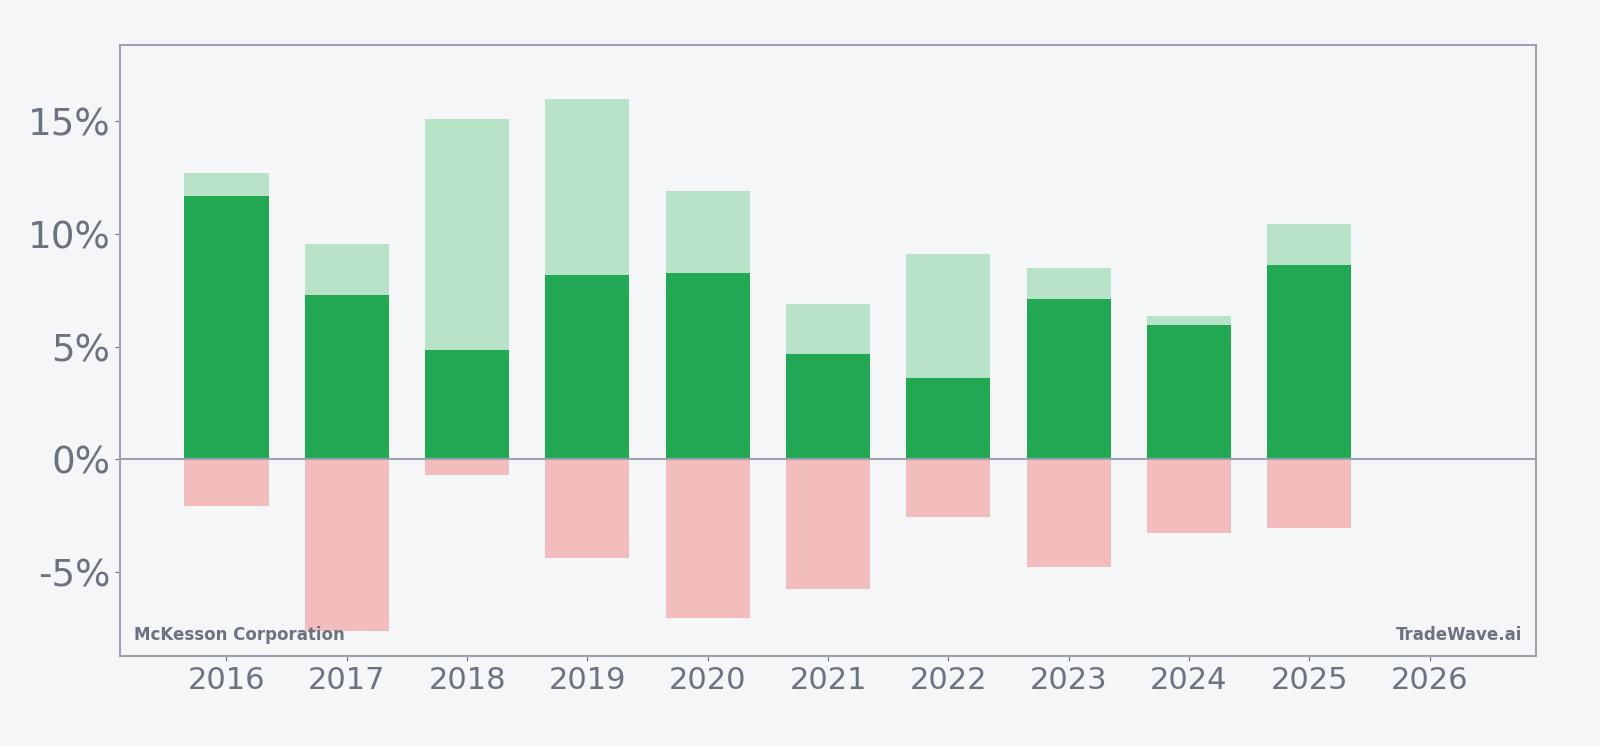
Stacked bars of net returns with peak run-ups and worst drawdowns show how far MCK has typically swung inside this window.
Historically this has been a straightforward long-biased setup. The trade direction is long, and every one of the past 10 iterations finished in the green, with a 96% cumulative gain across those windows. Average profit of 7.03% sits close to the 7.21% median, which tells you the wins have been relatively clustered rather than driven by a single outlier year.
The per-year breakdown shows how that upside has come through. The strongest year in the sample was 2016, when MCK gained 11.69% in the window, helped by a maximum favorable move of 12.7% from the entry. On the softer side, 2022 still finished up 3.62%, but the stock never ran more than 9.11% above entry and saw a 2.57% intraperiod dip before grinding higher.
MFE/MAE, short for maximum favorable and maximum adverse excursions, frame the risk and reward inside the window. In 2019, for example, McKesson’s best point-to-peak move reached 16.0% while the worst drawdown from entry was 4.37%, a classic “up and to the right” year for a long. By contrast, 2017 delivered a solid 7.3% net gain but came with a 7.61% adverse swing at one point, reminding traders that even winning years have required sitting through volatility.
The TradeWave Ratio of 3.13 signals that price has typically traveled meaningfully in the trade direction during the window, not just drifted a couple of points. Combined with a Sharpe ratio of 2.77 based on end-of-window outcomes, the pattern has historically offered a favorable balance of return versus variability for a defensive healthcare name.
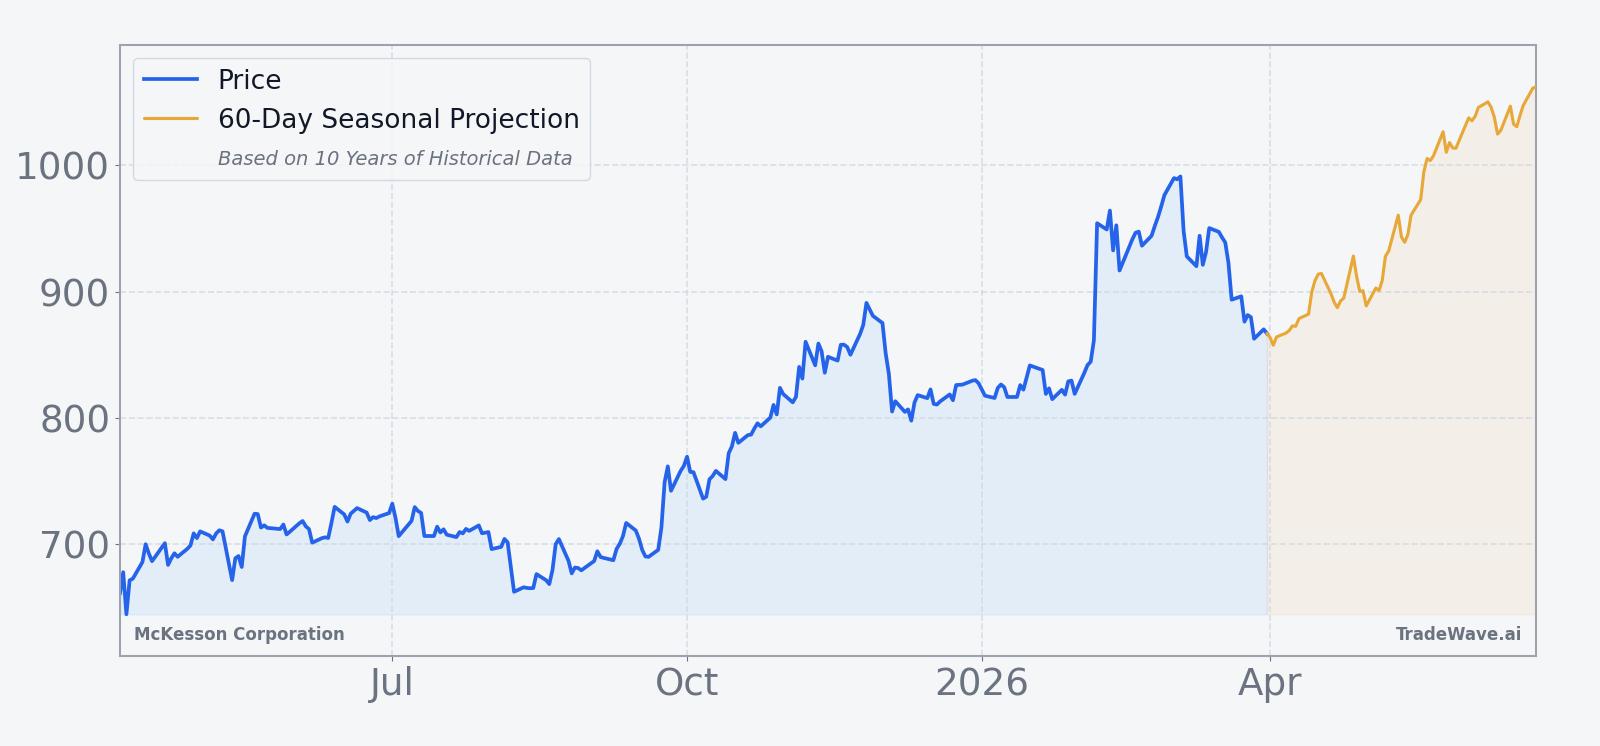
Looking at the average seasonal trend chart, the typical path has been front-loaded. Returns tend to build in the first half of the 45-day stretch, flattening out into the back end as early gains consolidate. The cumulative return profile across the decade shows a steady staircase higher rather than a jagged pattern of big wins and big losses.
Add it up: 10 for 10 with mid-single to low-double-digit gains and manageable, if sometimes bumpy, drawdowns. History does not guarantee a repeat, but the consistency of this April–May window for McKesson is hard to ignore.
Why does McKesson Corporation (MCK) follow this seasonal pattern?
One likely driver is the company’s earnings and guidance cadence, with fiscal-year updates and raised forecasts often landing in late spring and pulling forward demand for the stock.[1] Analysts have also pointed to institutional portfolio repositioning in healthcare distributors around this time, as investors lean into defensive names after the first-quarter macro data is in. The pattern may also reflect sector rotation into drug distribution as specialty medicines volumes and reimbursement trends become clearer for the new fiscal year.[2][3]
History does not guarantee future results, and even in a perfect 10-for-10 window, adverse excursions inside the trade have reached more than 7% in some years.
What is driving McKesson Corporation (MCK) today?
McKesson shares finished Tuesday at 865.36, up 0.6% on the session, after a sharp pullback over the past month that has left the stock about 13.4% below its 52-week high of 999.00 despite a powerful run since early February.[1] The big inflection came on Feb 6, when McKesson surged 17% in a single high-volume session after reporting Q3 adjusted earnings per share of 9.34 versus expectations of 9.19 and 11.4% revenue growth to 106.16 billion, alongside a raised fiscal 2026 EPS forecast to 38.80 to 39.20.[1] That spike reset the trading range and confirmed that investors are still willing to pay up for the company’s exposure to specialty drugs and its steady cash generation.
In Aug 2025, McKesson had already lifted its annual profit forecast on robust demand for specialty medicines such as cancer and rheumatoid arthritis treatments, citing Q1 revenue of 97.83 billion versus estimates of 96.08 billion and adjusted EPS of 8.26 versus 8.15.[2] By Nov 2025, the company raised guidance again after Q2 adjusted EPS of 9.86 beat a 9.02 consensus and revenue reached 103.15 billion, tightening the fiscal 2026 EPS range to 38.35 to 38.85 before the latest upgrade.[3] The backdrop is a business that has been compounding earnings at a double-digit clip, with fiscal 2025 adjusted EPS of 33.05 up 20% year over year and 5.2 billion in free cash flow, giving management room to keep returning capital while investing in higher-margin specialty distribution and oncology platforms.[4]
The chart below shows how that earnings-driven breakout fits into McKesson’s broader uptrend and the projected seasonal path into early summer.
How do earnings, macro trends and valuation frame this seasonal setup?
Fundamentally, McKesson heads into this historically strong seasonal window with momentum at its back. The company has raised its fiscal 2026 adjusted EPS forecast multiple times, most recently to 38.80 to 39.20, after a string of quarterly beats on both revenue and earnings.[1][2][3] That guidance implies another year of solid double-digit profit growth on top of the 20% EPS expansion delivered in fiscal 2025, supported by scale in drug distribution and a growing mix of higher-margin specialty products.[4]
Sector-wise, the story is about demand for specialty medicines. In Aug 2025, McKesson highlighted robust volumes in treatments for cancer and rheumatoid arthritis as a key driver of its upgraded outlook, a theme that has continued to support the broader healthcare distribution group.[2] For investors looking at the healthcare sector seasonal outlook, McKesson’s pattern matters because it sits at the intersection of defensive cash flows and exposure to secular growth in complex therapies.
Valuation markers are harder to pin down without a current consensus multiple, but the stock’s climb from the mid-600s in early 2025 to above 800 after the February 2026 earnings shock suggests the market has been willing to re-rate the name as earnings power steps higher.[1][4] With the shares still trading below their 50-day moving average of 906.07 after the recent pullback, the upcoming seasonal window will test whether buyers are ready to lean back into the uptrend or let the stock consolidate further.[1]
What should traders watch in this McKesson seasonal window?
First, the calendar. The 45-day window starting Apr 6 has been a sweet spot for McKesson in each of the past 10 years, and traders will be watching whether the stock can again build a mid-single to low-double-digit gain off current levels. Price action relative to the 50-day moving average around 906 and the prior high near 999 will be key markers for whether the historical pattern is repeating or breaking down.[1]
Second, earnings follow-through. While the next formal earnings date is not yet set, the company is operating under a freshly raised fiscal 2026 EPS range, and any interim commentary on specialty drug volumes, reimbursement, or capital returns could either reinforce or undercut the bullish seasonal bias.[1][2][3] Traders will be sensitive to whether management continues to sound confident about double-digit growth or starts to hint at normalization after two years of strong upgrades.
Third, volume and volatility. The Feb 6 session showed how quickly McKesson can move when new information hits, with a 17% single-day jump on heavy trading.[1] If the stock starts to build higher again inside the seasonal window, a pickup in volume on up days would echo prior strong years, while a pattern of high-volume selling into strength would be an early sign that this cycle may diverge from the 10-for-10 record.
Finally, sector rotation. McKesson’s role as a large-cap healthcare distributor means its behavior often tracks broader flows into or out of defensive growth. If macro headlines push investors toward safety, the historical April–May strength could align with renewed demand for the name. If risk-on sentiment dominates and money rotates into more cyclical areas, the stock may have to work harder to keep its seasonal streak alive.
Sources
- Forbes – How McKesson Stock Surged 17% In A Day (Feb 6, 2026)
- Reuters – McKesson lifts annual profit forecast on robust demand for specialty drugs (Aug 6, 2025)
- Reuters – McKesson raises annual profit forecast on robust demand for specialty drugs (Nov 5, 2025)
- McKesson – McKesson Reports Fiscal 2025 Fourth Quarter and Full Year Results (May 8, 2025)
About this seasonal analysis
Seasonal pattern data is sourced from TradeWave.ai, which analyzes historical price behavior across annual calendar windows going back up to 30 years. Read the full data methodology or the book The 100-Year Pattern by Afshin Moshrefi (2026 edition). Past performance of seasonal patterns does not guarantee future results. This article is for informational purposes only and does not constitute investment advice.