Hasbro (HAS) Has Rallied in 10 Straight April Windows, Averaging 8.74% Gains
Hasbro is heading into a historically strong 19-day trading window just as shares pull back from recent highs and investors weigh cybersecurity and tariff risks.

What is the seasonal pattern for Hasbro (HAS)?
Hasbro has risen in 10 of 10 years during this April 9–27 window, with an average gain of 8.74% in winning years.
- 10 for 10 in this 19-day April window, with average gains of 8.74% in winning years.
- Percent Profitable is 100%, with 10 winners and 0 losers across the past decade in this slice of the calendar.
- The upcoming window runs from Apr 9 through roughly Apr 27, covering 19 trading days for Hasbro.
- Average gains cluster in the mid-to-high single digits, but individual years have ranged from about 1.4% to 19.5%.
- Intraperiod swings have included worst drawdowns of up to about 11%, showing that even “all-win” windows can be bumpy.
- The TradeWave Ratio of 1.85 and Sharpe ratio of 1.55 point to historically strong, risk-adjusted upside in this specific trading window.
According to historical data from TradeWave.ai, this mid-April stretch has behaved very differently from an average month for Hasbro. The next section unpacks how that pattern has played out over the past decade and what it means for the coming weeks.
How has Hasbro (HAS) traded in this April seasonal window?
Hasbro has posted gains in every single iteration of this 19-day April window over the past decade, averaging an 8.74% rise with a long trade direction. Shares closed Tuesday at 89.40, down 1.1% on the day and about 15.3% below their 52-week high of 105.52, leaving room above if the pattern repeats.[5]
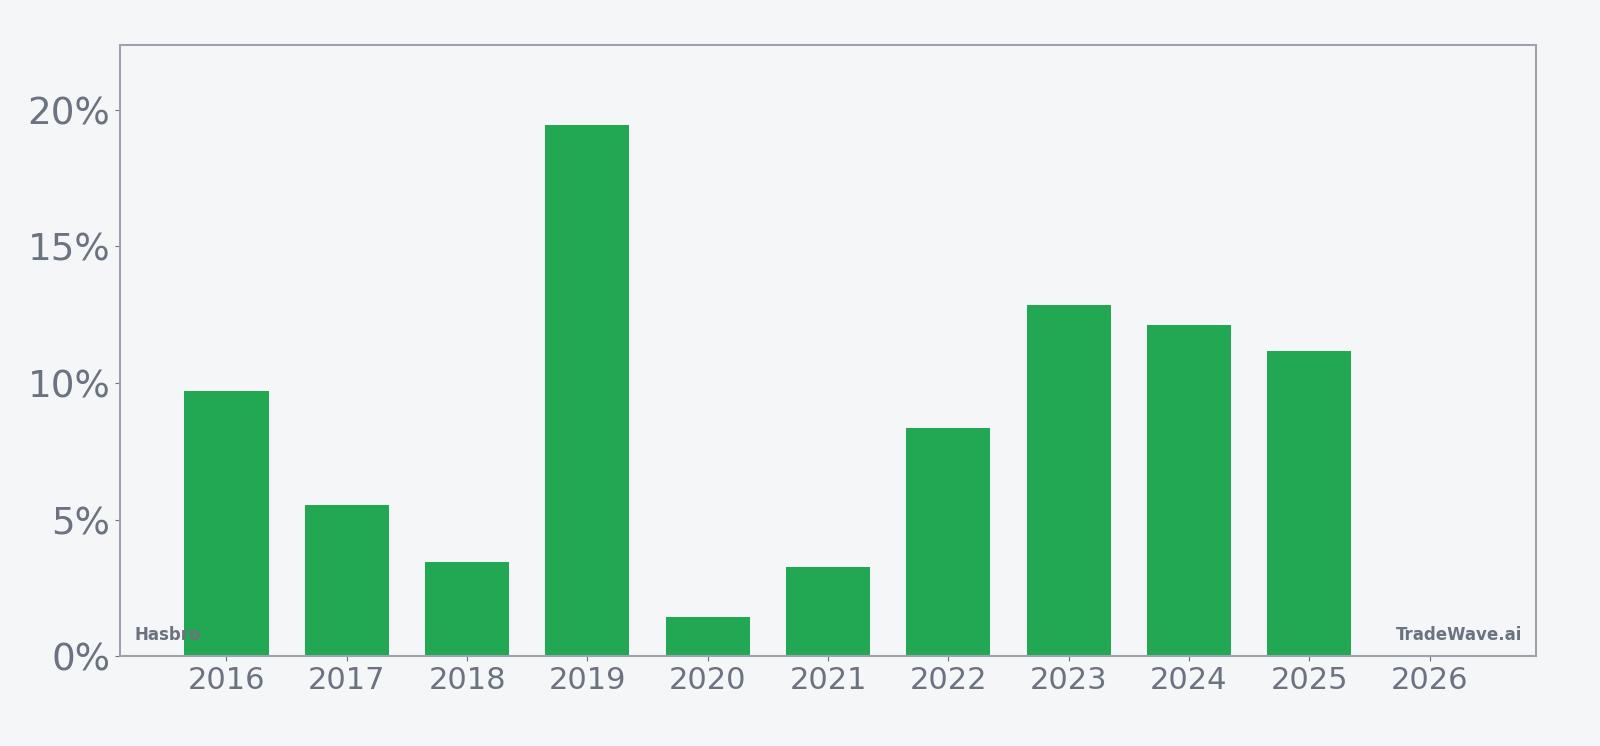
Across the 10-year sample, the strongest year in this Hasbro trading window was 2019, when the stock gained 19.46% between entry and exit, with a maximum favorable move of 21.67% and almost no drawdown. The softest year was 2020, which still finished up 1.44% but saw the worst intraperiod slide, with a maximum adverse move of about 7.39% before recovering. That mix of outcomes shows a bullish seasonal bias, but not a straight line higher.
A second view layers in both the best and worst intraperiod swings for each year.
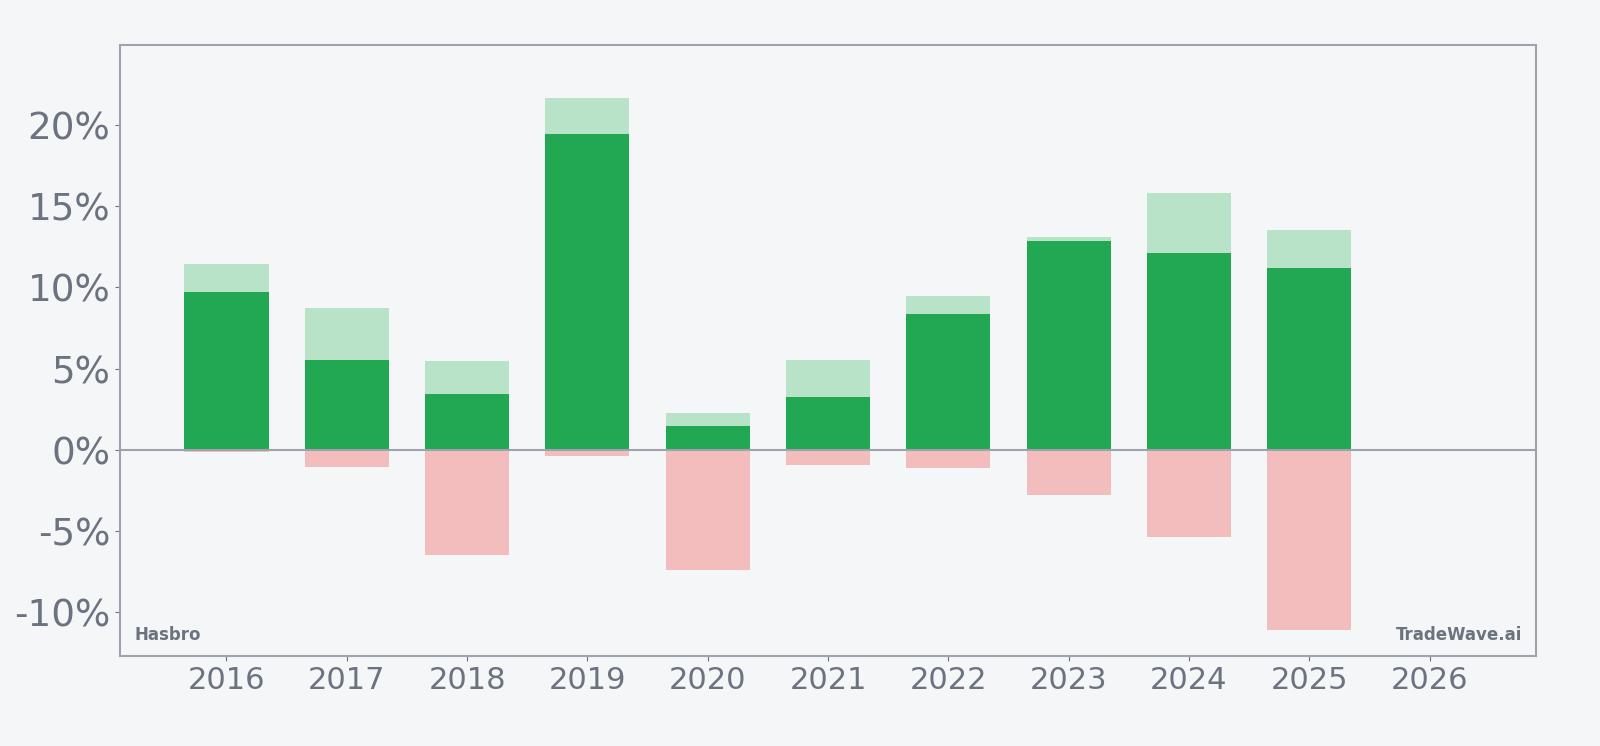
The bar profile shows that in most years, Hasbro’s maximum favorable move in this window has pushed into high single or low double digits, while the worst drawdowns have usually stayed in the low single digits, with 2018, 2020 and 2025 as the main downside outliers. The TradeWave Ratio of 1.85 suggests that, historically, price has tended to travel meaningfully in the long direction during the window, and the Sharpe ratio of 1.55 points to a relatively strong risk-adjusted payoff compared with many short-term stock patterns. Add it up: 10 for 10 with solid average gains makes this one of the cleaner bullish seasonal stretches on Hasbro’s calendar, even if the ride has occasionally been rough.
History does not guarantee future results; adverse excursions can still be large even in windows where every past year finished positive.
Why does Hasbro (HAS) follow this seasonal pattern?
One likely driver is Hasbro’s position in the toy and gaming cycle, where retailers and distributors often place orders and adjust inventory ahead of mid-year product launches. Analysts have also pointed to the company’s earnings calendar, with first-half updates and guidance tweaks sometimes prompting portfolio repositioning around this time. The pattern may also reflect broader sector rotation into consumer and gaming names as investors look past the post-holiday lull toward summer demand.
What is driving Hasbro (HAS) today?
Hasbro slipped 1.1% Tuesday to 89.40 on the Nasdaq, extending a roughly 6.7% one-month pullback even as the stock trades almost double its 52-week low of 45.67 and sits above its 20-day average volume of about 1.71 million shares.[5] The move comes as the company investigates a cybersecurity incident disclosed on Apr 1, after systems were taken offline on Mar 28 in a step that could delay orders and disrupt parts of the business.[5]
In 2025, Hasbro’s story was dominated by tariffs and the pivot toward digital gaming. In July 2025, the company reported Q2 results that beat expectations, with adjusted EPS of $1.30 versus a $0.78 estimate and revenue of $980.8 million, helped by strong demand for Magic: The Gathering even as traditional consumer products lagged under tariff pressure.[3] By Oct 23, 2025, Hasbro had raised its annual revenue and adjusted EBITDA forecasts on the back of that digital momentum, targeting high-single-digit revenue growth and adjusted EBITDA between $1.24 billion and $1.26 billion.[2]
Those upgrades came against a tougher backdrop. In June 2025, Hasbro cut about 3% of its global workforce, roughly 150 jobs, to offset higher tariff costs tied to Chinese imports and to support a broader supply-chain diversification push.[4] In Oct 2025, law firm Kahn Swick & Foti said it had launched an investigation into Hasbro’s officers and directors, adding a governance overhang to the mix.[7] Together with ongoing tariff and trade-policy risks, those factors help explain why the stock has been volatile even as the digital segment has delivered standout growth.
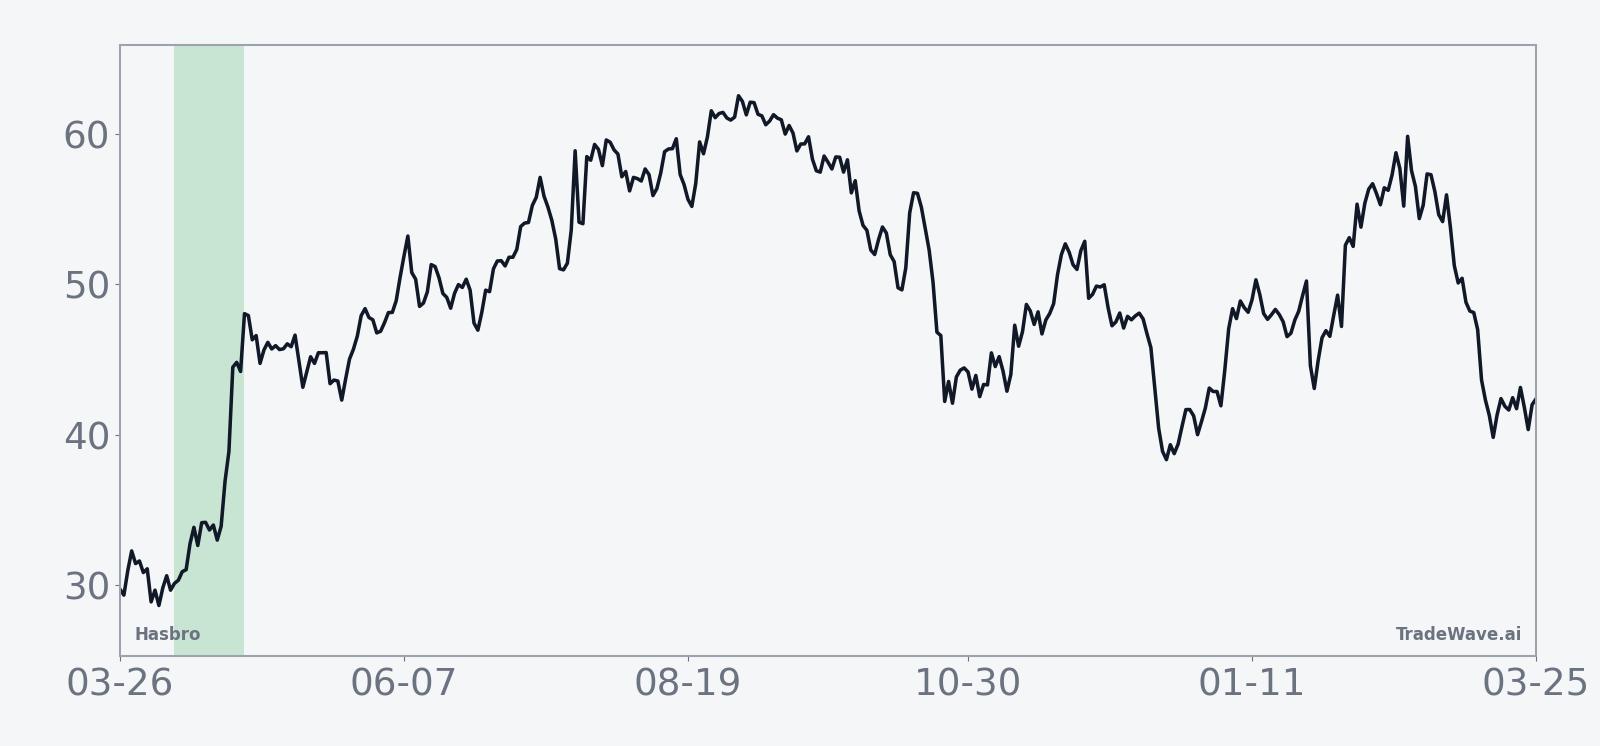
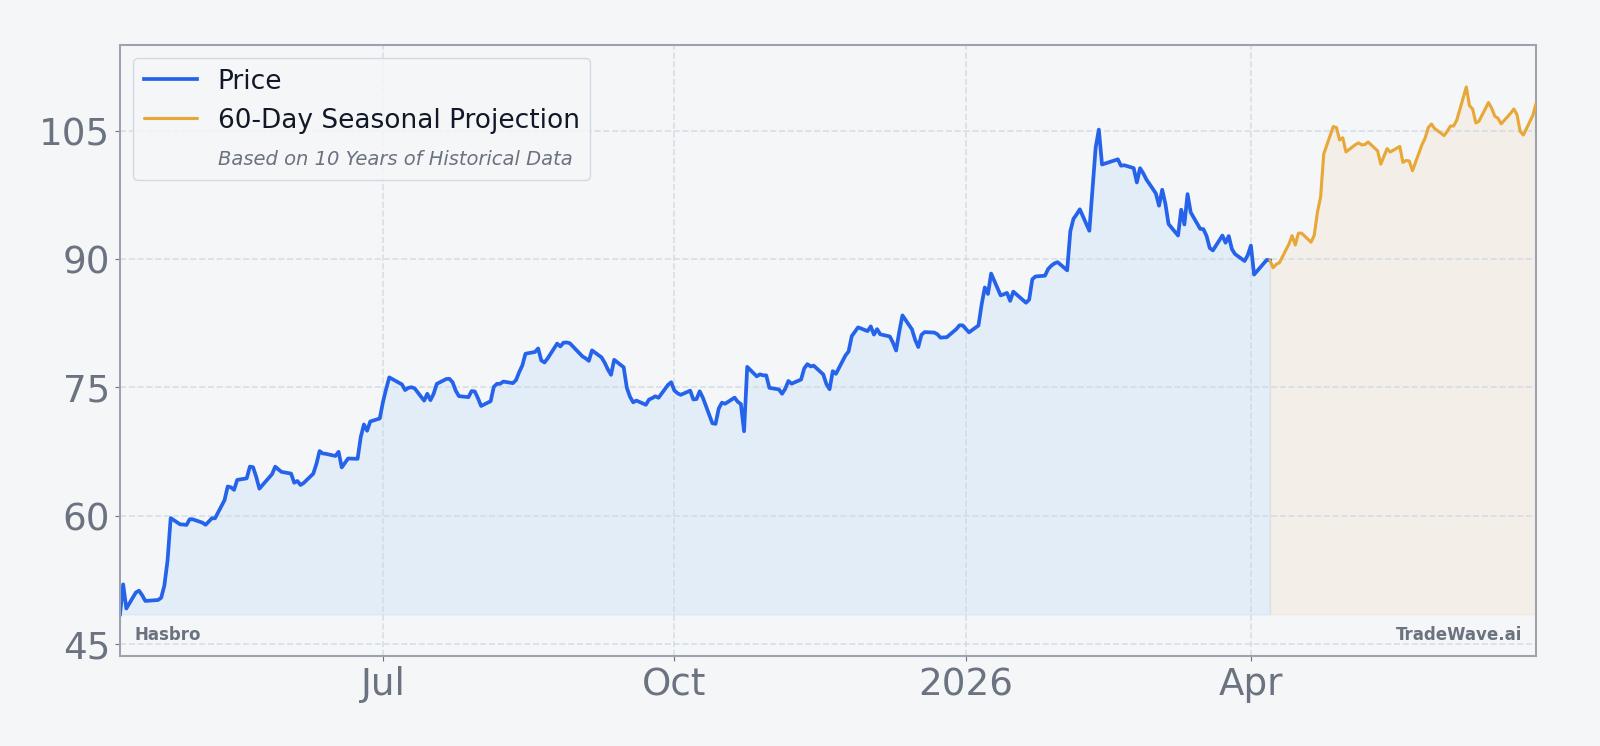
The chart below situates the latest move in its recent multi-month context and overlays the upcoming seasonal projection.
What does the earnings backdrop look like for Hasbro (HAS)?
Hasbro’s next scheduled earnings event in this dataset is Q3 2025 results on Oct 23, 2025, when the company reported revenue of $1.39 billion, up 8% year over year, and adjusted EPS of $1.68, both ahead of estimates.[2] Management used that update to lift full-year guidance to high-single-digit revenue growth and the $1.24 billion to $1.26 billion adjusted EBITDA range, citing strength in digital gaming and Magic: The Gathering in particular.[2]
In July 2025, Q2 numbers had already shown the same pattern: digital and gaming segments growing briskly while traditional toys and consumer products struggled with tariffs and shifting consumer preferences.[3] Revenue from Magic: The Gathering rose 23% in Q2 2025 and 42% in Q3 2025, underscoring how much the franchise has become a profit engine for the group.[3] For traders watching the upcoming April seasonal window, that earnings history matters because it frames Hasbro less as a pure toy stock and more as a hybrid gaming and entertainment name, with different sensitivities to macro and consumer cycles.
How are tariffs and macro trends affecting Hasbro (HAS)?
Tariffs on Chinese imports remain a key macro swing factor for Hasbro, which has historically relied heavily on Chinese manufacturing for its toy and game portfolio.[4] Higher duties have pushed up costs, pressured margins and forced the company to cut jobs and diversify its supply chain, including shifting some production to other regions.[4] Those moves help reduce long-term risk but can weigh on near-term profitability and cash flow.
At the same time, the broader toy industry is dealing with evolving consumer preferences and a saturated digital entertainment landscape, which has made it harder to grow traditional toy sales.[3] Hasbro’s response has been to lean into digital gaming and branded entertainment, where franchises like Magic: The Gathering have delivered record growth and supported the company’s upgraded forecasts.[2] That sector rotation within the business helps explain why the stock can trade more like a gaming or media name at times, which may interact with the historical seasonality around mid-April as investors reposition across sectors.
How does Hasbro (HAS) look on basic valuation and trading metrics?
At 89.40, Hasbro is trading about 15.3% below its 52-week high of 105.52 and roughly 95.7% above its 52-week low of 45.67, a wide band that reflects the stock’s recovery from prior stress and the market’s reassessment of its digital growth story.[5] The shares sit below their 50-day simple moving average of about 94.68, which signals a short-term pullback within a longer rebound, and the one-month return of about -6.66% shows that some of the recent optimism has cooled.[5] With no current consensus rating or price target data in this dataset, traders are leaning more on price action, macro headlines and seasonal cues than on a clear Street playbook.
What should traders watch in this Hasbro (HAS) seasonal window?
First, the calendar. The 19-day window beginning Apr 9 has been a perfect 10 for 10 for long positions over the past decade, with average gains of 8.74% and a long trade direction. Traders will be watching whether early price action respects the historical pattern of building gains through the middle of the window or whether a deeper drawdown, like 2020 or 2025, shows up again.
Second, levels. On the upside, the 50-day moving average near 94.68 is a logical first test, followed by the psychological 100 level and, beyond that, the 52-week high around 105.52.[5] On the downside, the recent low zone around the high 80s and the prior breakout area above 70 from earlier years in the sample are key reference points if the stock sells off inside the window.
Third, catalysts. Any updates on the cybersecurity investigation, including signs of prolonged system outages or customer disruption, could override the usual April seasonal pattern if they materially change the earnings outlook.[5] Macro headlines on tariffs or trade policy, especially anything that affects Chinese manufacturing costs, also matter because they feed directly into Hasbro’s margin story and could amplify or blunt the typical seasonal move.[4]
Finally, behavior versus history. If Hasbro starts the window strong and holds gains despite negative headlines, that would be consistent with the past decade’s bullish seasonal trend. A flat or sharply negative performance across the full 19 days would mark the first real break in this pattern and could signal that the company’s risk profile, from cybersecurity to tariffs and governance, is reshaping how investors treat this part of the calendar. Either way, the next three weeks will test whether one of Hasbro’s cleanest historical trading windows still has power in a very different fundamental environment.
Sources
- [2] Reuters, "Hasbro lifts annual forecasts on 'Magic: The Gathering' demand boost," Oct 23, 2025.
- [3] MarketWatch, "Hasbro has seen toy prices creep higher, and they should keep rising this year," Jul 23, 2025.
- [4] Reuters, "Hasbro cuts 3% of its total workforce, WSJ reports," Jun 17, 2025.
- [5] Reuters, "Hasbro investigates cybersecurity incident, takes some systems offline," Apr 1, 2026.
- [7] Morningstar, "Hasbro Investigation Initiated By Former Louisiana Attorney General," Oct 18, 2025.
About this seasonal analysis
Seasonal pattern data is sourced from TradeWave.ai, which analyzes historical price behavior across annual calendar windows going back up to 30 years. Read the full data methodology or the book The 100-Year Pattern by Afshin Moshrefi (2026 edition). Past performance of seasonal patterns does not guarantee future results. This article is for informational purposes only and does not constitute investment advice.