Citigroup Sees 45% Upside for Generac (GNRC) Just Ahead of Its Historically Bullish Spring Run
Generac shares are down double digits for 2026, but a historically strong 56-day spring window is about to open just as AI-driven power demand becomes a bigger story for the stock.

What is the seasonal pattern for Generac (GNRC)?
Generac has risen in 10 of 10 years during this 56-day April-to-June window, with an average gain of 8.35% in winning years.
- 10 for 10 in this window, with Generac averaging 8.35% gains across all winning years.
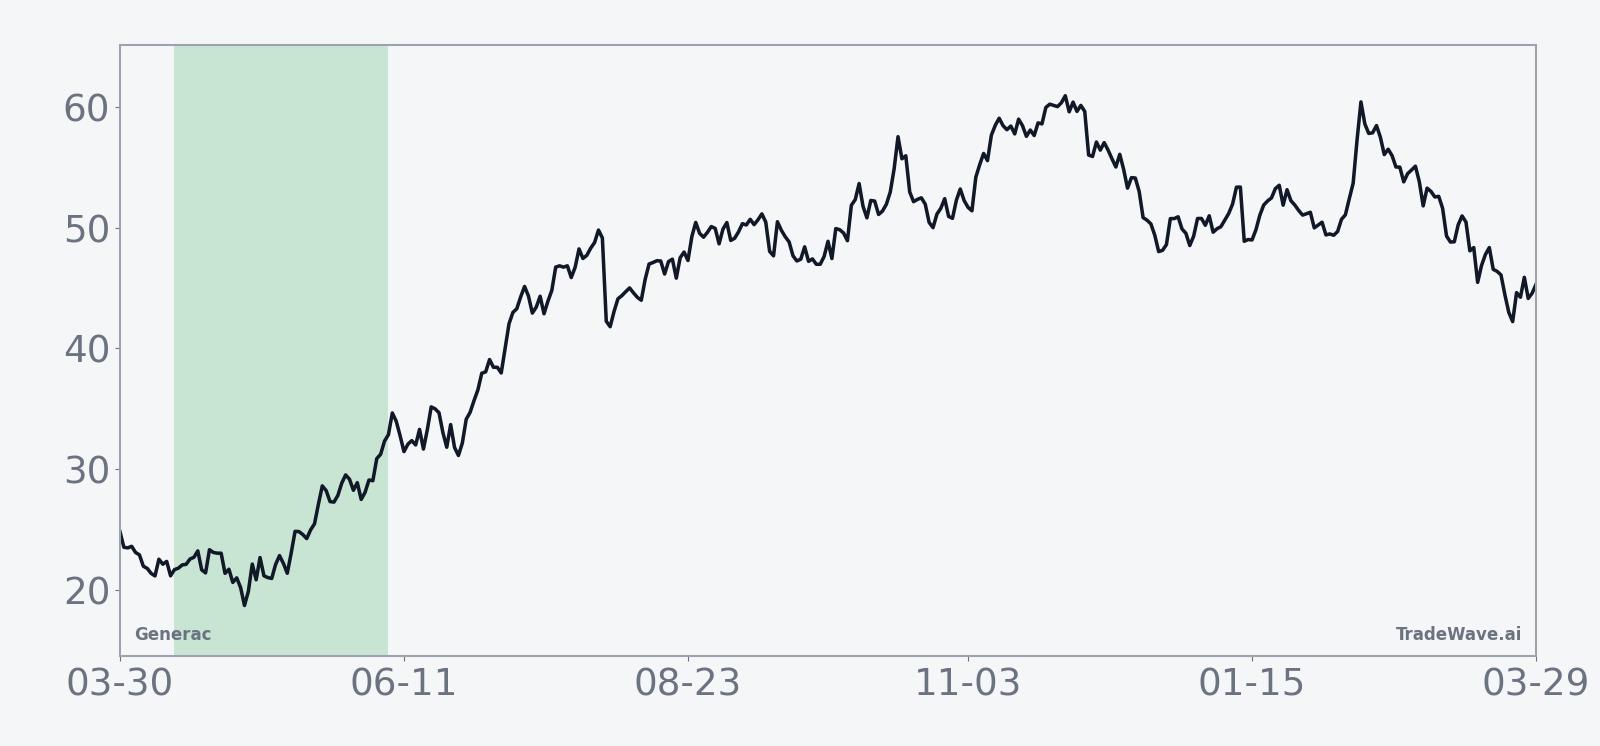
- The upcoming 56-day window starts on Apr 13 and has been a consistently bullish GNRC seasonal trend over the past decade.
- Percent Profitable sits at 100%, with 10 winners and 0 losers in this specific Generac trading window.
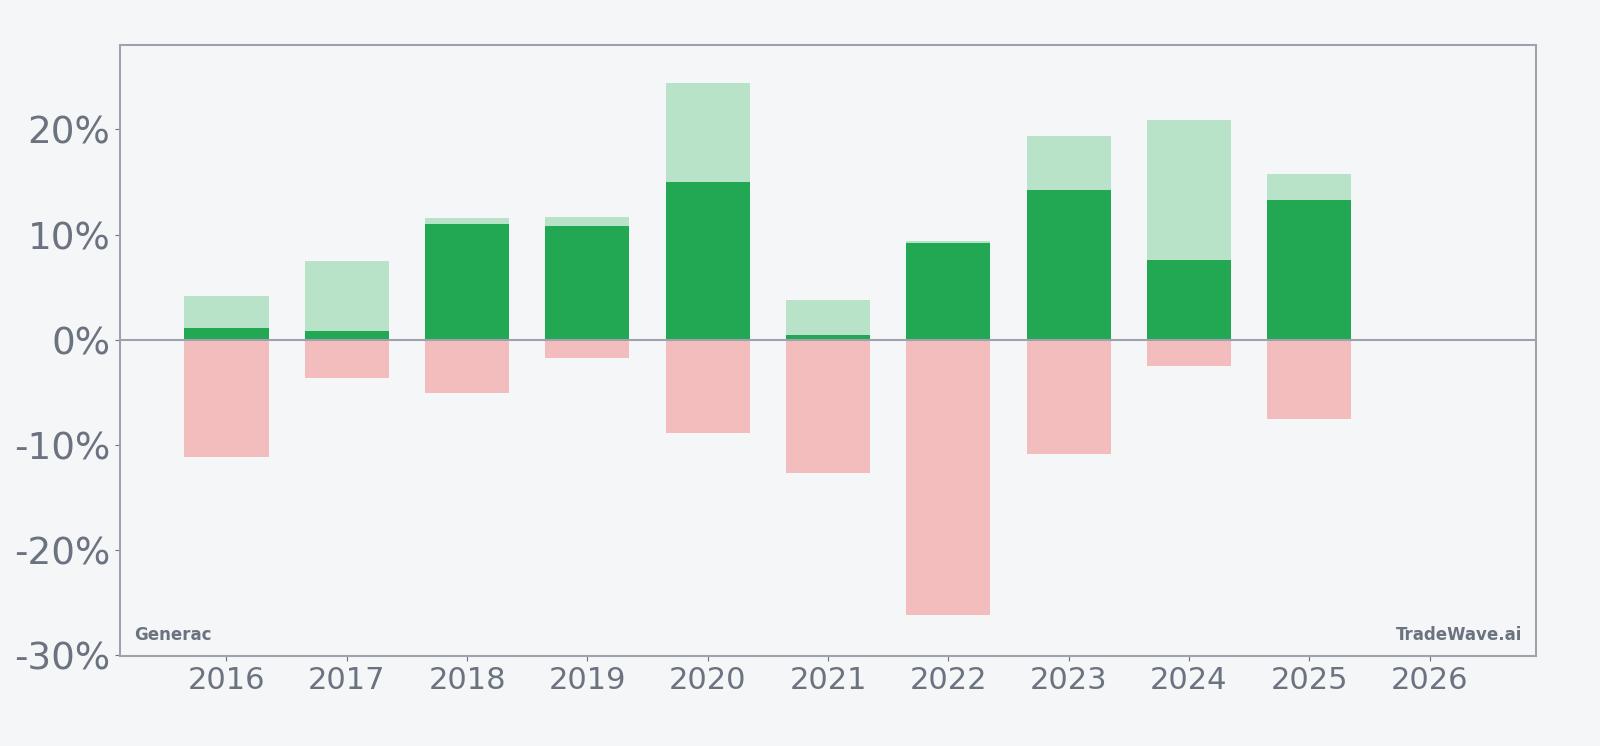
- Average gains mask real swings: some years saw maximum favorable moves above 20% and adverse drawdowns deeper than 10% before finishing higher.
- Cumulative return across the last ten iterations totals 120%, underscoring how powerful this slice of the calendar has been for long exposure.
- Trade Direction is long, with a TradeWave Ratio of 1.73 and a Sharpe ratio of 1.37, pointing to historically strong risk‑adjusted performance.
According to historical data from TradeWave.ai, this mid‑April window has behaved very differently from an average month on the calendar for Generac. The next section looks at how that pattern has played out and what it could mean as the 2026 iteration approaches.
How has Generac (GNRC) traded in this April–June window?
Generac has posted gains in every single iteration of this 56‑day mid‑April window for the past decade, averaging 8.35% across those runs. The next window begins on Apr 13, with the stock last closing at 191.10, down 2.3% on the day and off 11.6% year to date.[1] That combination of a soft start to 2026 and a historically strong spring stretch is why this year’s setup stands out on the GNRC seasonal pattern radar.
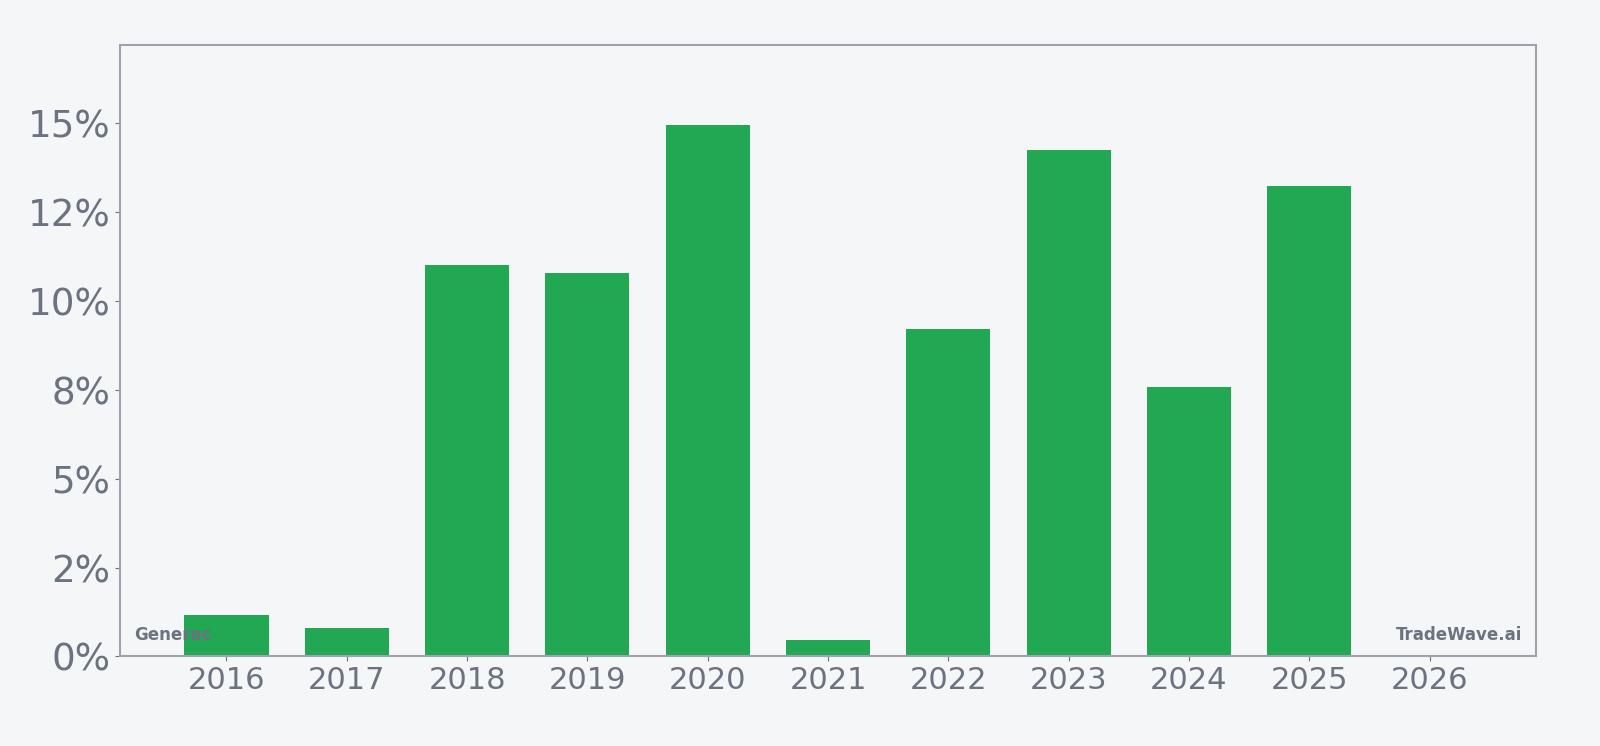
Across the ten‑year sample, the strongest years in this Generac trading window came in 2020, 2023 and 2025, with net gains of 14.97%, 14.24% and 13.25% respectively. The weakest outcomes were still positive, such as 0.45% in 2021 and 0.80% in 2017, which kept the Percent Profitable metric pinned at 100% despite some choppy paths.
The intraperiod swings are where the GNRC seasonal trend gets more nuanced. In 2024, for example, Generac’s best point‑to‑peak move inside the window reached 20.89%, while the worst drawdown from entry was only 2.45%. By contrast, 2016 and 2021 both finished higher but saw adverse excursions of 11.15% and 12.68% respectively before recovering, a reminder that even “all‑green” windows can feel rough in real time.
Looking at the typical path, the historical seasonal average suggests gains tend to build gradually rather than in a single burst. Trend metrics show more days with the stock closing higher than lower in the trade direction, with “Trend Long” days outnumbering “Trend Short” days over the 56‑session span, and the cumulative return curve climbing in a relatively steady stair‑step pattern rather than a straight line.
Year‑by‑year bars with peak rallies and worst drawdowns fill in the risk‑reward picture for this window.
Put together, the record is striking: ten for ten, 120% cumulative gains across the decade, and a long‑biased TradeWave Ratio of 1.73 that reflects meaningful travel in the trade direction inside the window. The catch is that several of those years also carried double‑digit downside swings along the way, so the path has rarely been smooth even when the finish line was green.
History does not guarantee future results; adverse excursions (MAE) can be large even in winning windows.
Why does Generac (GNRC) follow this seasonal pattern?
One likely driver is the way Generac’s demand cycle lines up with spring and early summer, when utilities, data centers and homeowners prepare for peak power and storm seasons. Analysts have also pointed to institutional portfolio repositioning around the company’s earnings calendar, which often clusters guidance and order commentary in the first half of the year. The pattern may also reflect broader sector rotation into industrial and power‑related names as investors position for summer energy usage and weather‑related volatility.
What is driving Generac (GNRC) today?
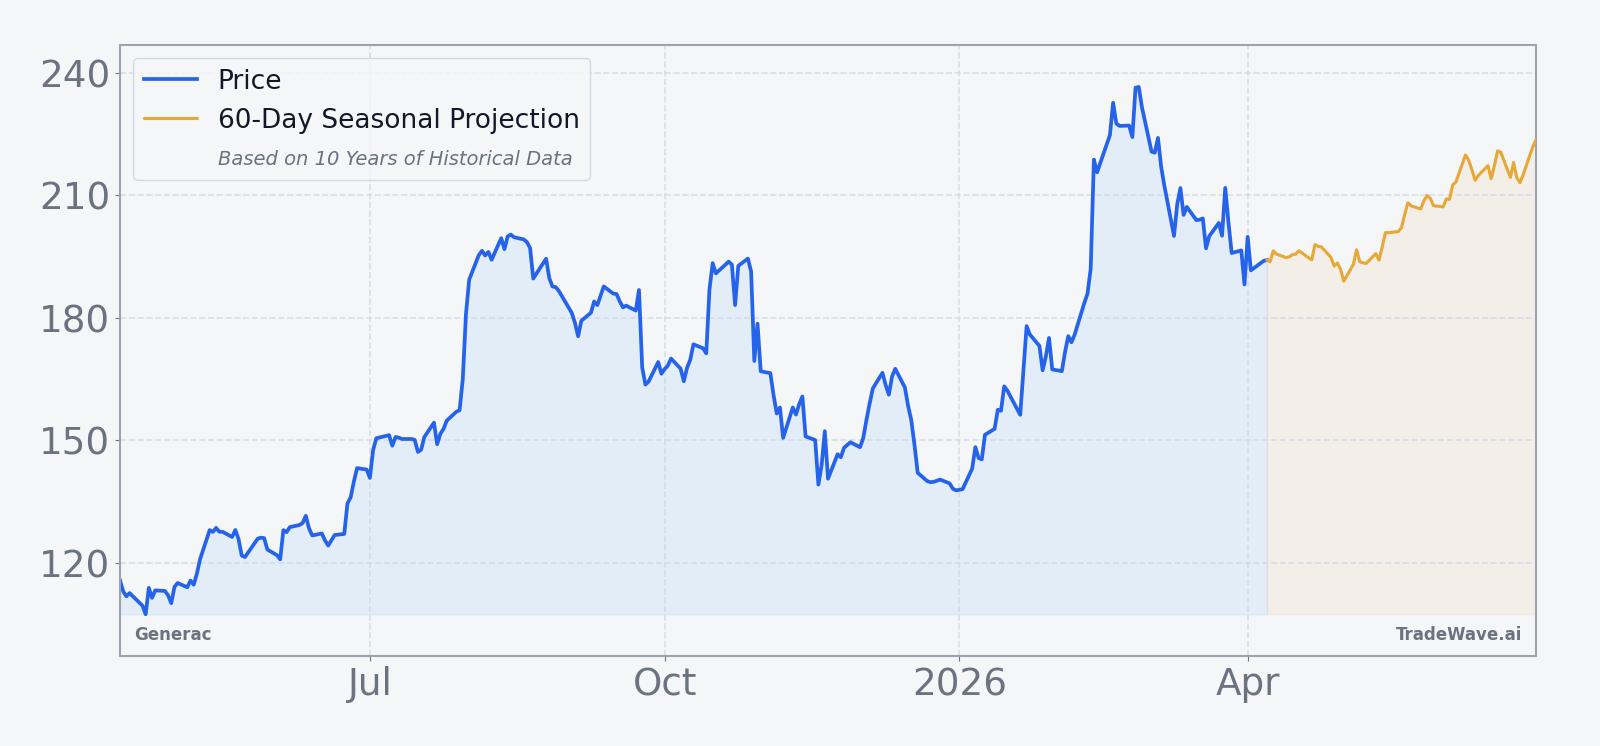
Generac closed at 191.10 on Apr 8, down 2.3% on the session and 11.6% lower for 2026 so far, even as the stock trades well above its 52‑week low of 99.50 and below its 241.09 high.[1] The pullback has come after a sharp rebound from last year’s levels and leaves GNRC about 20‑day average volume of 1,033,628 shares, with the stock also sitting under its 50‑day moving average of 202.71, a sign that momentum has cooled in the near term.[1]
On the fundamental side, the most recent major data point in the background was a weaker‑than‑expected third‑quarter earnings report that triggered a nearly 28% single‑day drop in the stock, resetting expectations around growth and margins.[1] Since then, the narrative has shifted toward how much Generac can benefit from rising power needs tied to artificial intelligence data centers, with analysts highlighting potential orders from hyperscalers such as Amazon and Alphabet as a new leg of demand for backup generation and grid‑support equipment.[1]
Wall Street’s stance has turned more constructive, with both Wells Fargo and Citigroup upgrading Generac to overweight or buy after a prior pullback, arguing that AI‑driven power demand and data center spending could support multi‑year growth and that the stock’s reset created a more attractive entry point.[1] A consensus price target of 195 from Wells Fargo via CNBC sits only modestly above the current quote, reflecting a market that has already repriced some of that optimism but is still debating how quickly AI‑related orders will translate into revenue.[1]
The chart below situates the latest move in its recent multi‑month context alongside a 60‑day seasonal projection.
What should traders watch in this Generac seasonal window?
First, the calendar: the 56‑day window starting Apr 13 has been one of the most reliable bullish stretches for GNRC over the past decade, so how the stock behaves in the opening weeks will be an early tell on whether 2026 tracks the historical script. A firm hold above recent lows near the 188 intraday trough from Apr 8, followed by a push back toward the 50‑day moving average around 203, would be consistent with prior years where gains built steadily from a soft base.[1]
Second, earnings and guidance will matter even without a firm date on the calendar yet. Any update on data center orders, AI‑related power projects or utility‑scale deals could either reinforce or undercut the bullish industrial and power‑generators sector seasonal outlook that has been building around Generac’s story.[1] Traders will be watching whether management leans into AI demand as a concrete revenue driver or keeps it framed as a longer‑term opportunity.
Third, watch how analyst commentary evolves relative to price. With the consensus rating at Buy and a target only slightly above spot, fresh upgrades or target hikes would signal that the Street is growing more confident in the AI and grid‑resilience thesis, while any downgrades or cautious notes could weigh more heavily if they arrive during a window that has historically favored the long side.[1]
Finally, the behavior of intraperiod swings will be key. In past years, even winning windows often included double‑digit drawdowns before finishing higher, so traders may focus less on day‑to‑day noise and more on whether GNRC can sustain a series of higher highs and higher lows across the full 56‑day stretch. If the stock instead spends the bulk of the window grinding sideways or making lower lows, that would mark a clear break from the historical seasonality and suggest that the AI‑power narrative and post‑earnings reset are dominating the calendar pattern.
Sources
About this seasonal analysis
Seasonal pattern data is sourced from TradeWave.ai, which analyzes historical price behavior across annual calendar windows going back up to 30 years. Read the full data methodology or the book The 100-Year Pattern by Afshin Moshrefi (2026 edition). Past performance of seasonal patterns does not guarantee future results. This article is for informational purposes only and does not constitute investment advice.