Expedia Group (EXPE) Has Rallied in 10 of 10 Mid-April Windows, Averaging 2.83% Gains
Expedia Group is heading into a 13-day April trading window that has never been negative in the past decade, just as the stock trades well below last year’s peak and analysts stay constructive.

What is the seasonal pattern for Expedia Group (EXPE)?
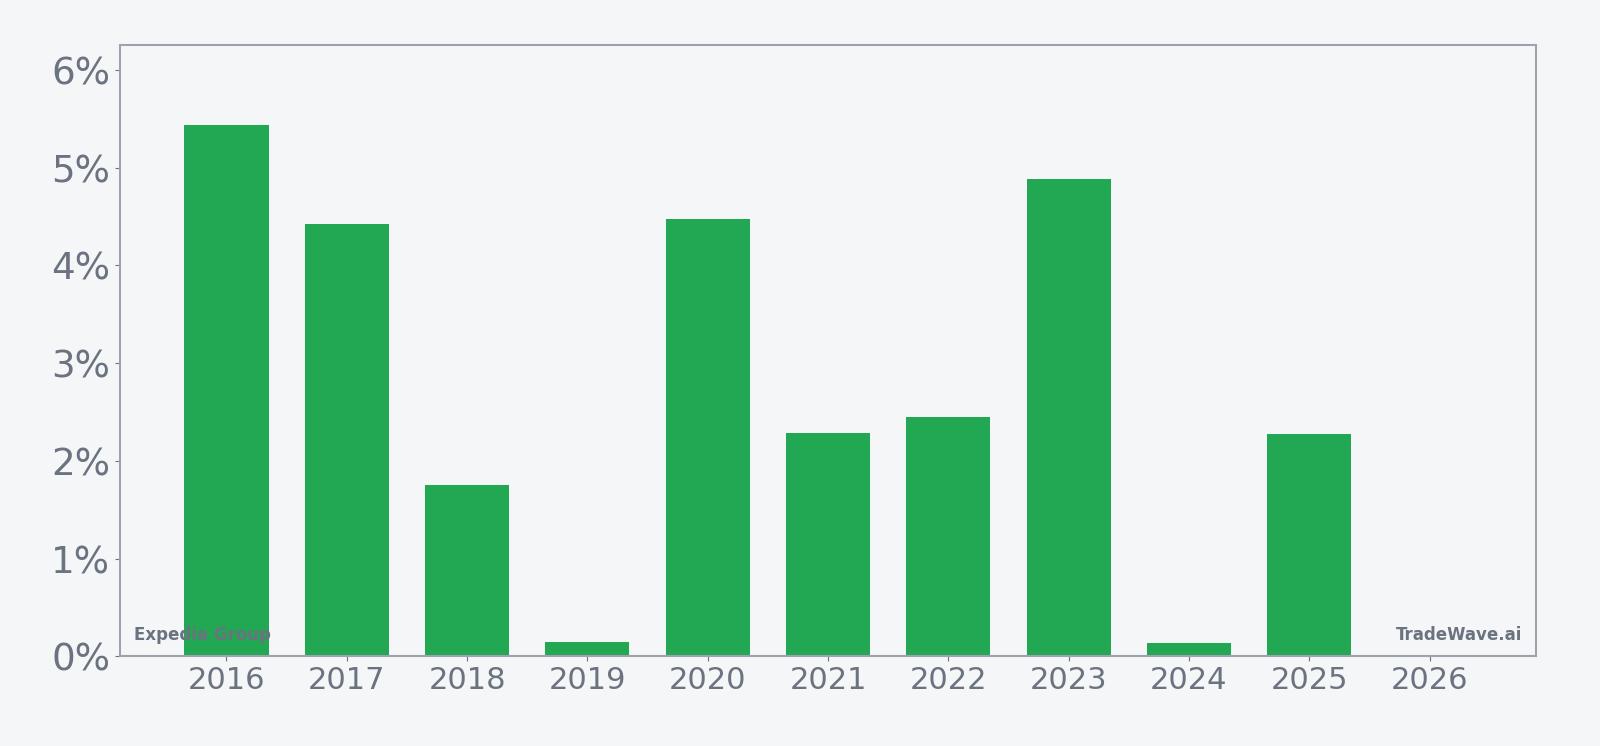
Expedia Group has risen in 10 of 10 years during this mid-April 13-day window, with an average gain of 2.83% in winning years.
- 10 for 10 in this window, with Expedia Group averaging 2.83% gains across all winning years.
- The upcoming 13-day window begins on Apr 10, 2026 and has been a consistently bullish EXPE seasonal trend over the past decade.
- Percent Profitable is 100%, with 10 winners and 0 losers in this Expedia Group trading window.
- Individual years have seen net returns as high as 5.44%, with several mid-single-digit gains clustered in strong travel seasons.
- Intraperiod swings have included meaningful drawdowns in some years, even when the final result was positive, underscoring the need to respect volatility.
- The TradeWave Ratio of 1.94 and Sharpe ratio of 1.42 point to a historically favorable risk-reward profile for long exposure in this specific stretch.
According to historical data from TradeWave.ai, this mid-April window has behaved differently from an average month for Expedia Group, and the next iteration is about to open again.
How has Expedia Group (EXPE) traded in this mid-April window?
Expedia Group has posted gains in every one of the past 10 years during the 13-day window that starts on Apr 10, averaging a 2.83% rise for long positions. The stock closed Tuesday at $224.30, down 2.1% on the day and about 26.2% below its 52-week high of $303.80.[2] That combination of a clean 10-for-10 historical record and a stock trading well off last year’s peak gives this year’s setup unusual focus for traders watching the EXPE seasonal pattern.
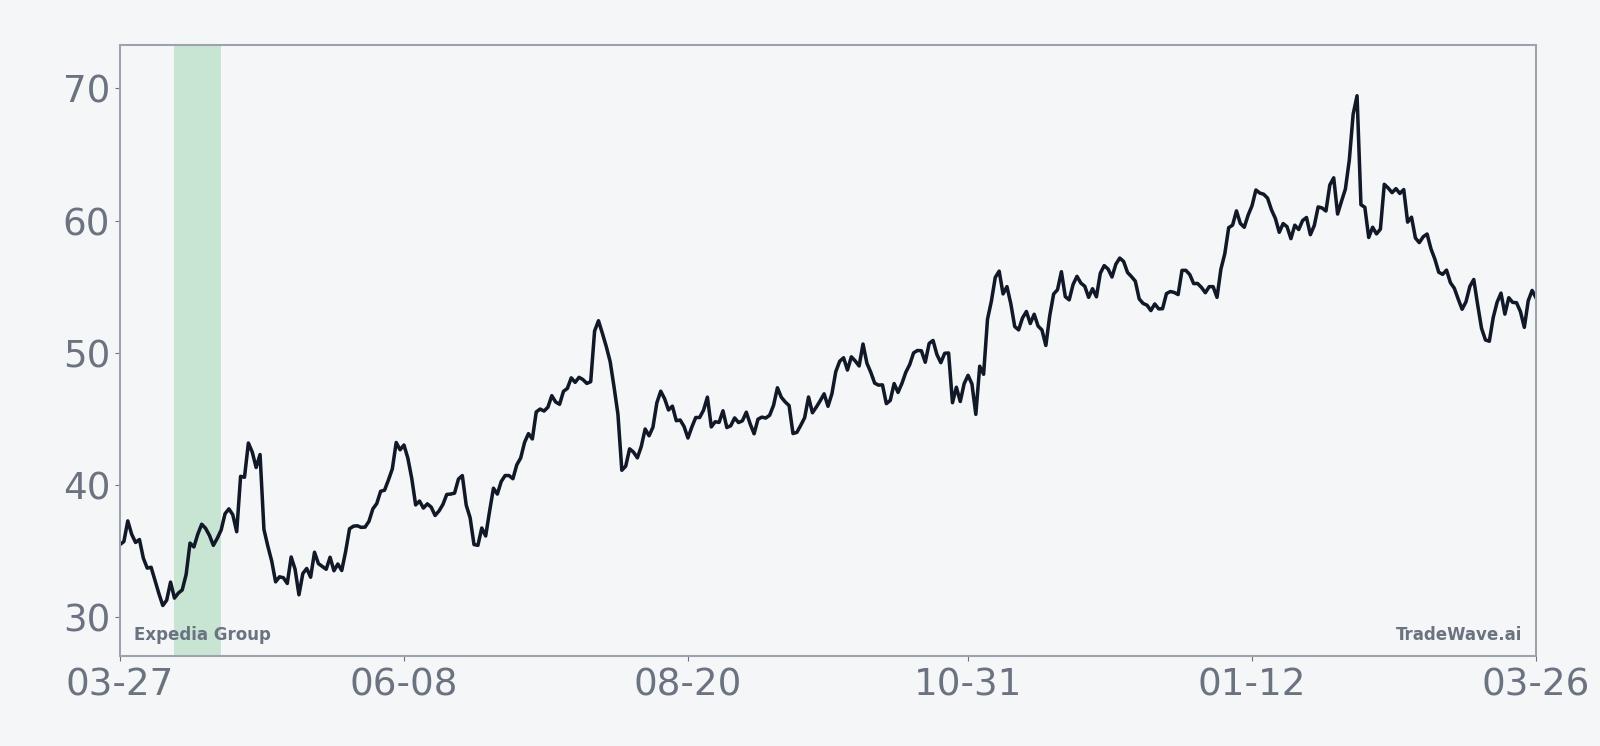
A second view that layers in both peak rallies and worst drawdowns helps frame how bumpy that path has been year by year.
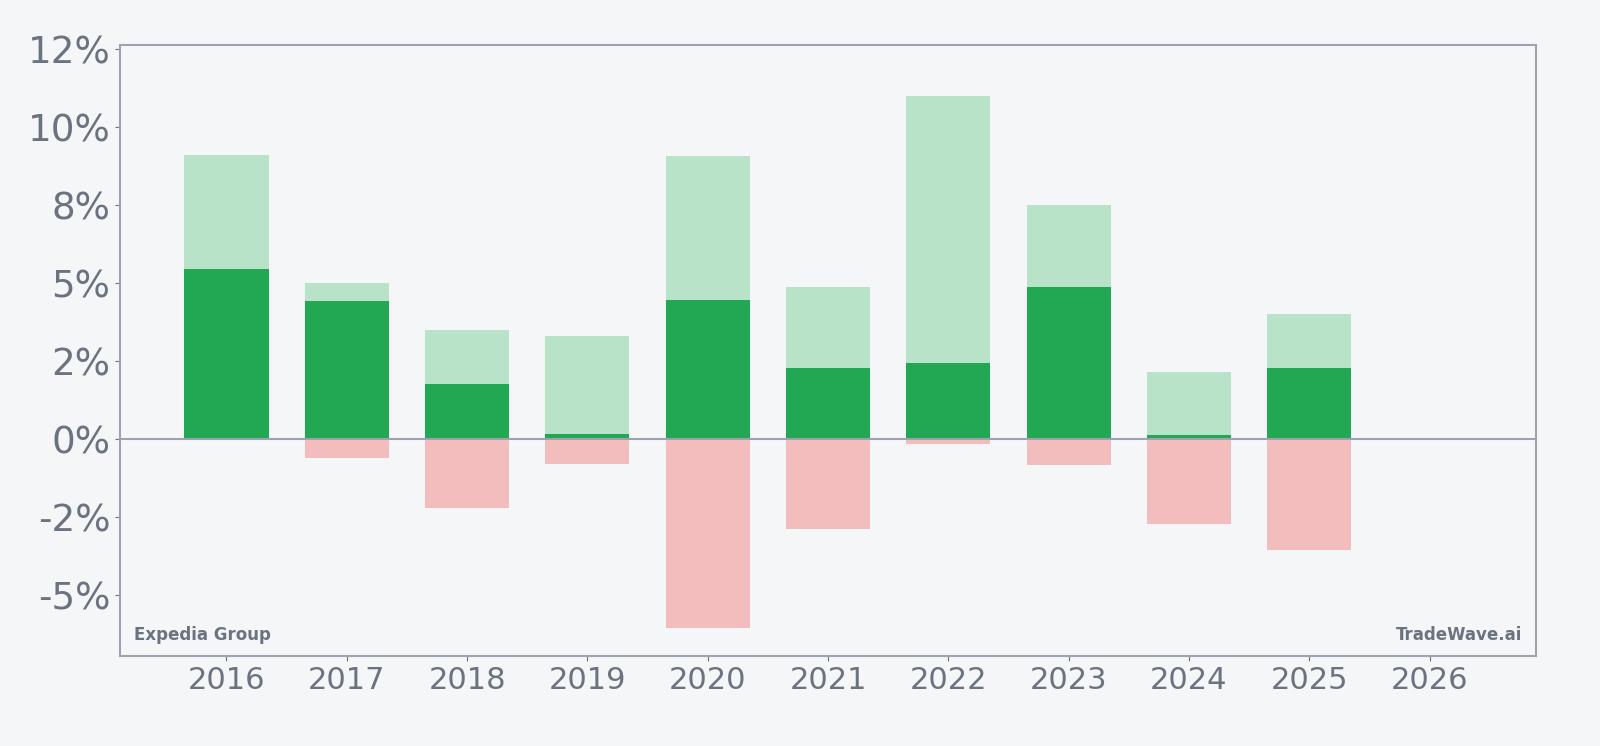
Across the 10-year lookback, the strongest year in this window was 2016, when EXPE gained 5.44% between entry and exit while its best intraperiod move reached 9.11% from the starting price. At the other end of the spectrum, 2019 barely cleared the bar with a 0.15% net gain, even though the stock still managed a 3.29% peak run-up before giving most of it back. That spread between modest closes and larger intraday or intra-window swings is what the TradeWave Ratio of 1.94 is capturing: price has tended to travel meaningfully in the long direction inside the window, even when the final print is smaller.
Drawdown history is just as important. In 2020, for example, the window finished with a 4.47% gain but saw a worst adverse move of 6.06% from entry at one point, reflecting how volatile travel stocks were in that period. Other years, such as 2018 and 2024, also show the pattern of a positive finish after a 2% to 3% dip early in the window. That MAE profile means the historical setup has rewarded patience for longs but has not been a straight line higher.
The cumulative return view across all years adds up to a 31% gain for this specific slice of the calendar, which is notable for a 13-day stretch repeated only once a year. The Sharpe ratio of 1.42, based on end-of-window outcomes, suggests that the average reward has historically outweighed the volatility traders had to sit through. Put simply, this has been a short, punchy window where upside has tended to dominate, but with enough noise inside the band to shake out weak hands.
History does not guarantee future results; adverse excursions can still be large even in windows that have always finished positive.
Why does Expedia Group (EXPE) follow this seasonal pattern?
One likely driver is the way travel bookings ramp into the late-spring and early-summer season, which can support sentiment for online travel platforms as investors look ahead to peak demand.[8] Analysts have also pointed to Expedia’s product enhancements and margin expansion efforts, which may cluster around earnings and investor updates that often fall near this part of the calendar.[2][8] The pattern may also reflect institutional portfolio positioning into the main vacation season, when exposure to travel and leisure names tends to be reset.
What is driving Expedia Group (EXPE) today?
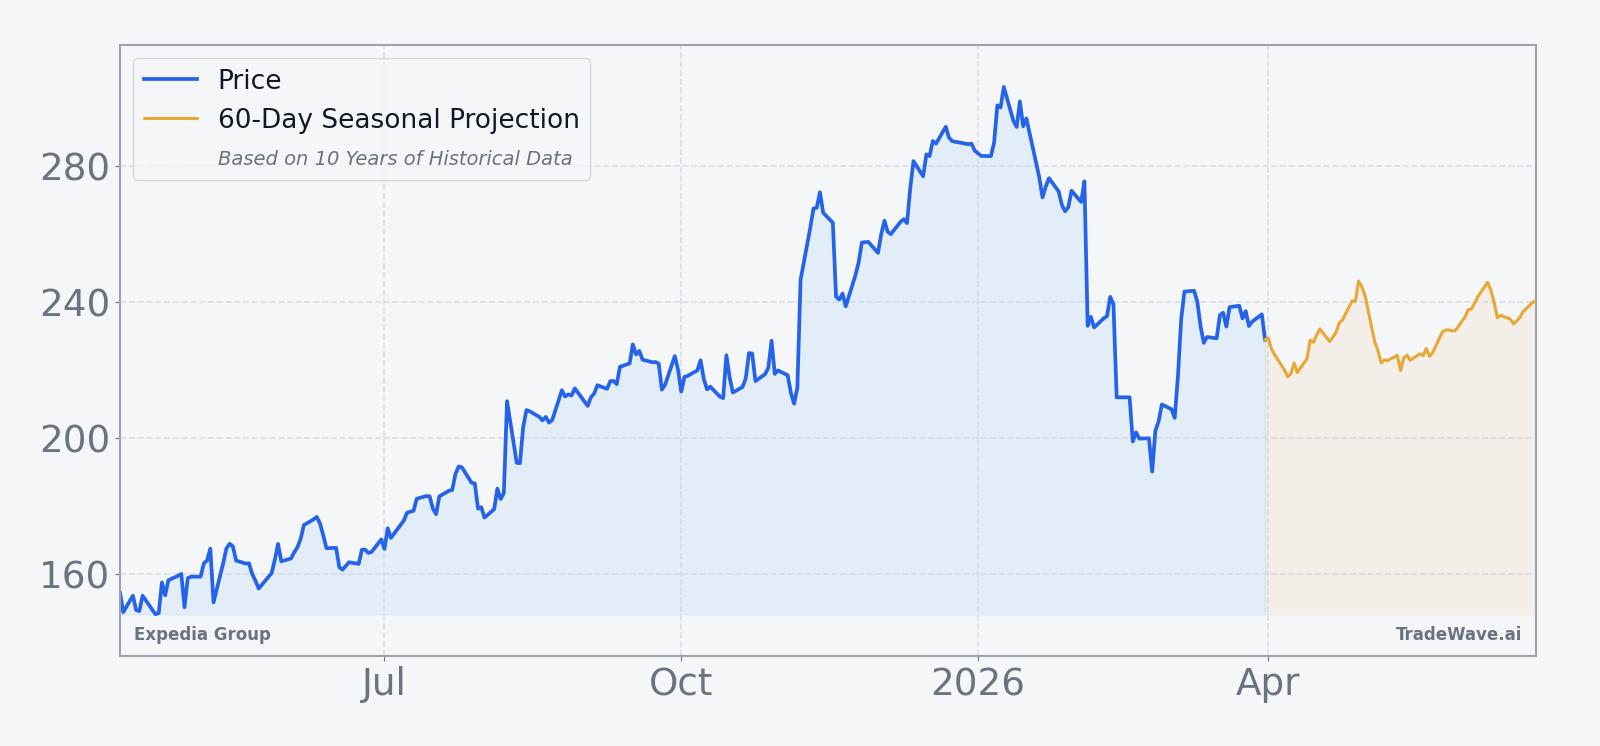
Expedia Group slipped 2.1% Tuesday to $224.30 on above-average volume, leaving the stock roughly 26.2% below its 52-week high of $303.80 and well above its 52-week low near $128.47.[2] The pullback comes after a powerful run over the past year that has been fueled by resilient global travel demand and a rebound in U.S. leisure and business trips, even as macro uncertainty lingers.[2] Analysts at Forbes, citing Trefis data, still carry a Buy rating with a $258 price target, arguing that a travel rebound and Expedia’s execution on cost discipline and product upgrades are not fully priced in.[2]
The chart below situates the latest move in its recent multi-month context, alongside a 60-day seasonal projection path.
How do earnings and guidance shape the backdrop for EXPE?
Expedia’s recent earnings track record has been solid. In 2025, the company reported second-quarter revenue of $3.79 billion, topping consensus estimates of $3.71 billion and prompting a raise to its full-year gross bookings outlook.[3] Third-quarter revenue reached $4.4 billion, up 9% year-on-year, with earnings per share of $7.33 and a 40% surge in net income, underscoring the operating leverage in the model as travel volumes scale.[5] Management has guided for 2025 gross bookings growth of 3% to 5%, with full-year revenue growth expected to stabilize in the high single digits, a pace that supports the current Buy consensus but leaves less room for error if demand softens.[1][3][5]
Those fundamentals matter for the seasonal setup because the mid-April window sits between major earnings events rather than directly on top of them. That can reduce headline risk while still allowing the stock pattern analysis to reflect how investors position ahead of the next update. If the company continues to deliver on its bookings and margin targets, the historical seasonality could be operating against a constructive fundamental backdrop.
What is the macro and sector backdrop for Expedia Group?
On the macro side, global travel demand has remained resilient despite higher rates and patchy economic data, supported by steady consumer spending and a continued recovery in international travel.[2] That has helped online travel agencies like Expedia maintain pricing power and volume, even as competition from peers and direct airline and hotel channels stays intense.[8] Within the online travel industry, Expedia has been leaning on product enhancements, tighter cost control and margin expansion to defend share and profitability, while also investing in artificial intelligence to improve search, recommendations and customer service.[8][10]
Sector positioning also matters. In February 2026, Forbes highlighted Expedia’s battle for the “booking throne” against peers, noting that relative performance has swung back and forth as each platform leans into technology and loyalty programs.[8] For traders, that means EXPE’s seasonal window does not exist in a vacuum: flows into or out of travel and leisure as a group can amplify or mute the historical pattern in any given year.
How does valuation frame the upcoming seasonal window?
Forbes’ February 2026 analysis pegged fair value for Expedia around $258 per share, implying upside from current levels and supporting the Buy stance.[2] That target was set when the stock was trading closer to that level, so some of the implied discount today reflects the recent pullback rather than a wholesale reset in expectations. With the shares still well above last year’s lows but meaningfully below the 52-week high, the valuation backdrop heading into the mid-April seasonal window looks more balanced than stretched.
In practical terms, that means the 10-for-10 historical pattern is meeting a stock that is neither in a euphoric blow-off nor a deep value hole. If travel demand and earnings momentum hold, the seasonal bias could align with a still-supportive fundamental and valuation story. If macro or competitive pressures surprise to the downside, the same window could instead become a period where investors reassess how much growth they are willing to pay for.
Sources
- Forbes, "Will Q1 Results Move Expedia Stock Down?", May 6, 2025
- Forbes, "Expedia’s Road To $258: Is A Travel Rebound Priced In?", Feb 25, 2026
- Reuters, "Expedia shares soar on upbeat forecast, US travel rebound", Aug 8, 2025
- Forbes, "Expedia Stock Surges 18% After Blowout Third Quarter Earnings Call", Nov 7, 2025
- CNBC, "Stocks making the biggest moves after hours: Sweetgreen, Block, Expedia, Pinterest and more", Aug 7, 2025
- Forbes, "Expedia Vs. Peers: Who Claims The Booking Throne?", Feb 18, 2026
About this seasonal analysis
Seasonal pattern data is sourced from TradeWave.ai, which analyzes historical price behavior across annual calendar windows going back up to 30 years. Read the full data methodology or the book The 100-Year Pattern by Afshin Moshrefi (2026 edition). Past performance of seasonal patterns does not guarantee future results. This article is for informational purposes only and does not constitute investment advice.