Honeywell (HON) Has Rallied in 10 of 10 April 9 Windows, Averaging 7.02% Gains
Honeywell is stepping into a historically strong 60-day spring window just as the stock trades near record territory after a powerful year-to-date run.

What is the seasonal pattern for Honeywell (HON)?
Honeywell has risen in 10 of 10 years during this April 9 start 60-day window, with an average gain of 7.02% in winning years.
- 10 for 10 in this window, averaging 7.02% gains in winning years across the past decade.
- Seasonal window runs 60 trading days from Apr 9, covering much of the spring and early summer trading period.
- Percent Profitable is 100%, with 10 winners and 0 losers in the historical sample.
- Trade Direction is long, with a Sharpe ratio of 1.44 and a TradeWave Ratio of 1.78 indicating strong risk-adjusted upside travel.
- Intraperiod swings have included sharp drawdowns, with adverse moves as deep as about 17.75% in one year despite finishing positive.
- Cumulative return across all ten windows totals 95%, underscoring how consistently this Honeywell trading window has favored the upside.
According to historical data from TradeWave.ai, this specific 60-day stretch has behaved very differently from an average month on the calendar for Honeywell. The next section breaks down how that pattern has played out over the past decade and what it means for the current setup.
How has Honeywell (HON) traded in the April 9 seasonal window?
Honeywell has posted gains in every single April 9 start 60-day window for the past 10 years, averaging a 7.02% rise with a long bias. The latest iteration begins today with the stock at $232.47, up 3.9% on the session and roughly 16% higher year to date, leaving it not far from its 52-week high of $248.18. That combination of a clean 10-for-10 historical record and a strong current trend makes this Honeywell seasonal pattern hard for traders to ignore.
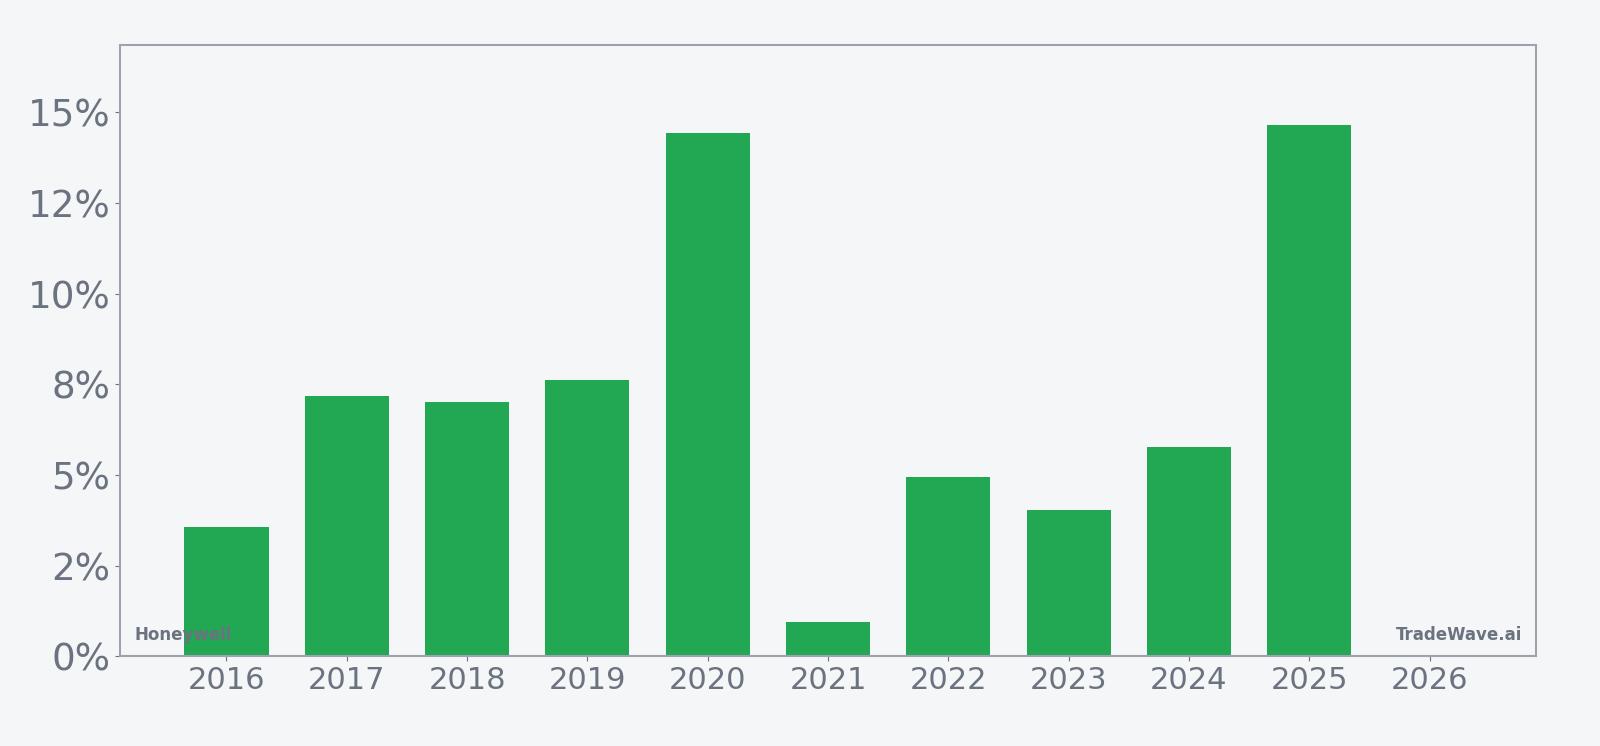
A second view of the pattern highlights how yearly net results line up with the best and worst intraperiod swings.
Across the 10-year lookback, every April 9 start window has favored the long side, with 10 winners and no losing years. Average gains of 7.02% mask a wide range of outcomes, from a modest 0.96% advance in 2021 to double-digit moves of 14.43% in 2020 and 14.66% in 2025. Those bigger years show that when Honeywell’s seasonal trend clicks, it can add a sizable leg higher over just two months.
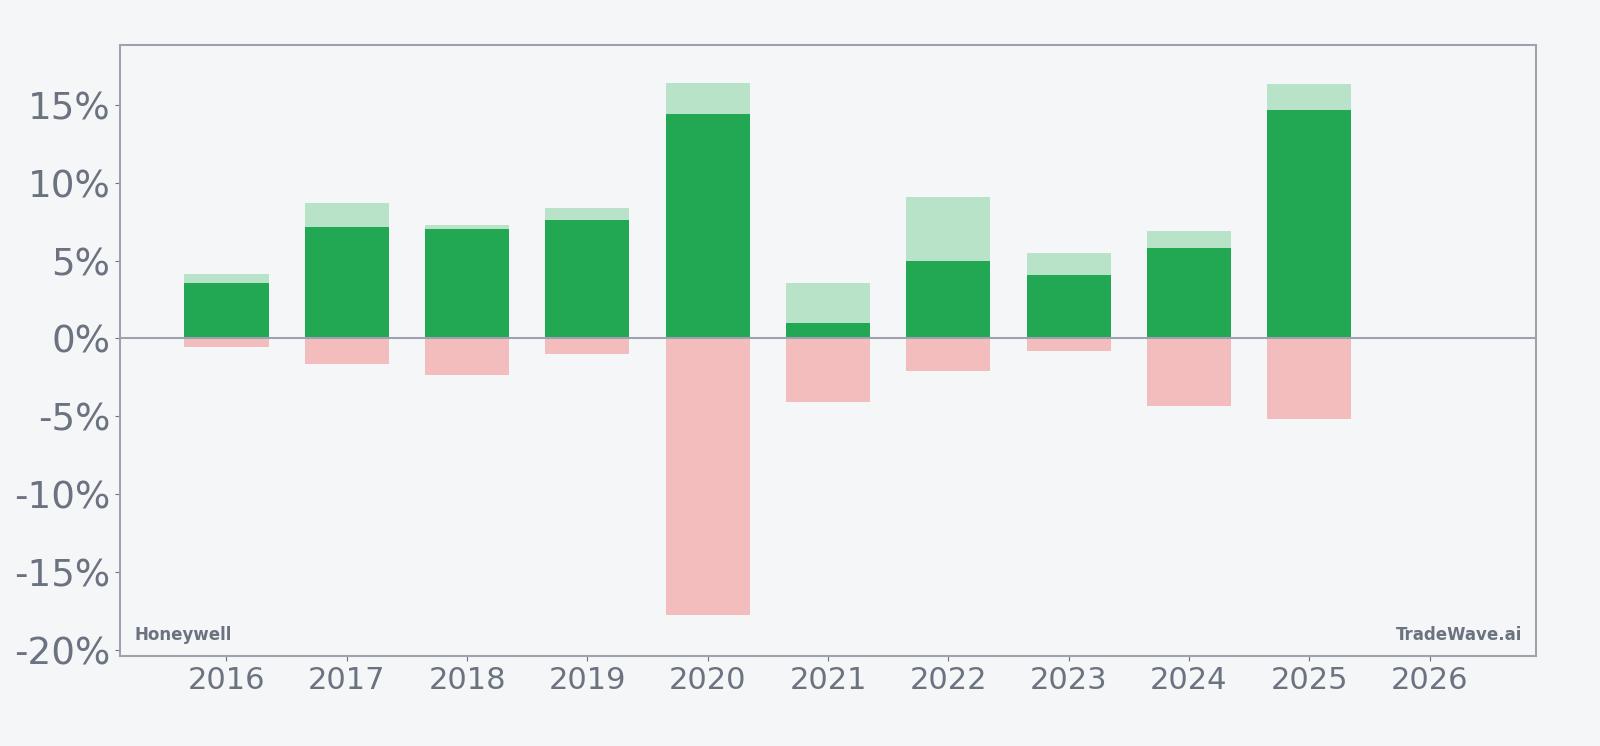
The intraperiod profile is more volatile than the clean win rate suggests. In 2020, for example, Honeywell ultimately gained 14.43% in the window, but at one point it was down as much as 17.75% from the entry before recovering. Other years show smaller but still meaningful adverse moves, with several windows experiencing drawdowns of 4% to 5% even as they finished in the green. That mix of strong maximum favorable excursions and sometimes deep maximum adverse excursions fits a pattern where pullbacks inside the window have often been buying opportunities rather than trend breaks.
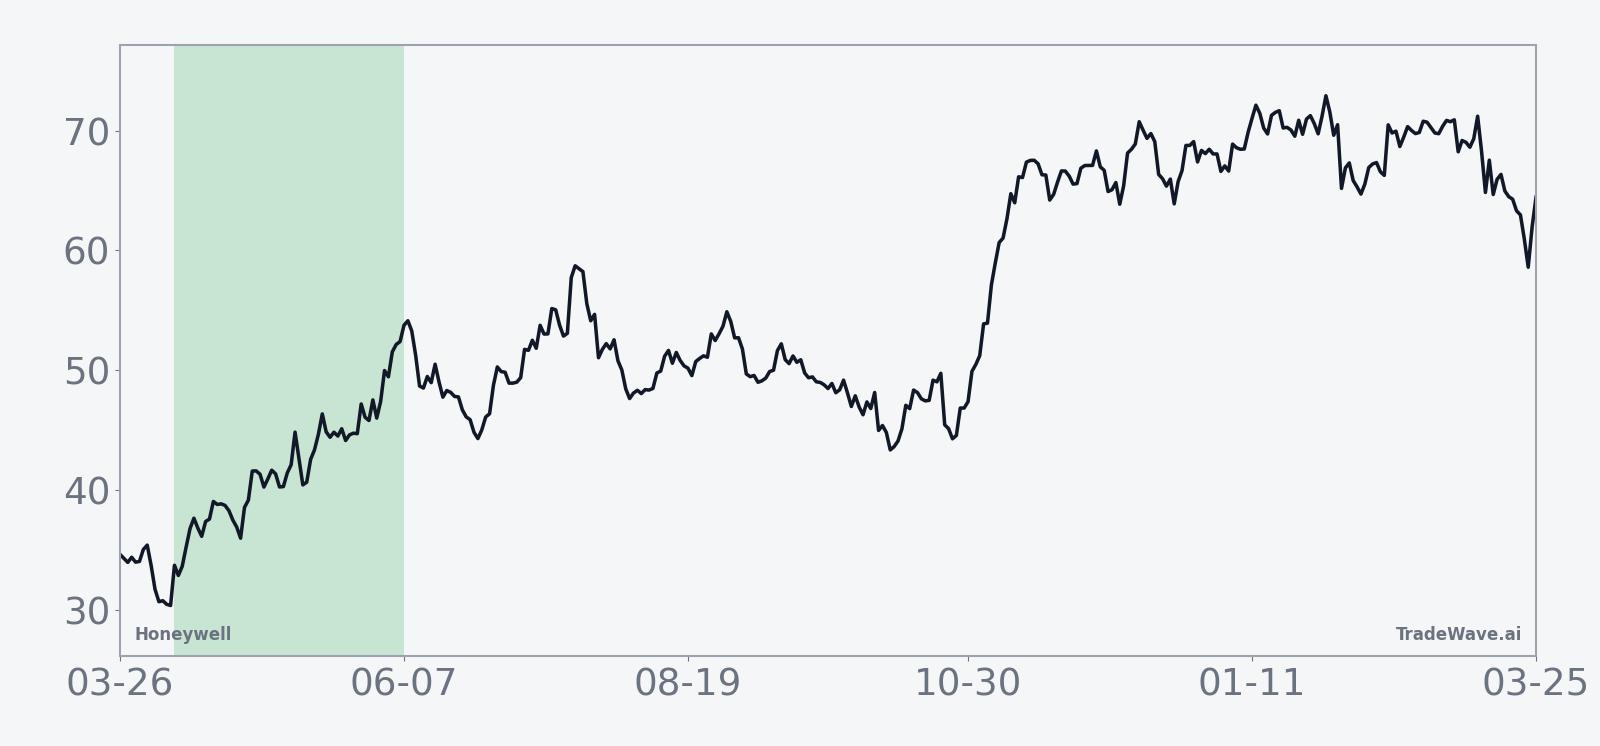
The 10-year seasonal trend chart shows gains tending to build steadily rather than in a single burst. The average path slopes higher through much of the 60-day span, with only brief pauses, which lines up with the pattern’s 95% cumulative return across the decade. There is no single “all or nothing” week; instead, Honeywell’s seasonal trend has usually rewarded patience across the full window.
Year-by-year bars with maximum favorable and adverse excursions underline that point. Even the softer years, such as 2021’s sub-1% net gain, saw intraperiod rallies of several percent before fading, while the strongest years combined double-digit peak run-ups with mid-single-digit drawdowns. For traders, that means this Honeywell trading window has historically offered both upside potential and enough volatility to shake out weak hands along the way.
Put simply, the record is clean: 10 for 10, with solid average gains and a history of rewarding long exposure in this specific slice of the calendar.
Why does Honeywell (HON) follow this seasonal pattern?
One likely driver is Honeywell’s earnings and guidance cadence, with first-half updates and aerospace order commentary often landing around this part of the year and shaping expectations for the rest of the calendar. The company’s exposure to aerospace, industrial automation and building technologies also ties it to capital spending and travel demand that tend to firm into spring and early summer. Institutional portfolio repositioning around these catalysts may help reinforce the historical seasonality that has shown up so consistently in this April 9 window.
History does not guarantee future results; even in a 100% winning sample, adverse excursions within the window can be large and require careful risk management.
What is driving Honeywell (HON) today?
Honeywell shares closed at $232.47, up 3.9% on the day, extending a strong start to 2026 that has the stock up about 16% year to date and within sight of its 52-week high at $248.18. The move builds on a powerful run that followed Honeywell’s fourth-quarter 2025 earnings report, which showed adjusted EPS of $2.59 on $9.8 billion in revenue, both higher year over year and supported by robust aerospace demand.[2][3][6]
In January 2026, Honeywell reported that full-year 2025 net revenues reached $37.4 billion, an 8% increase from the prior year, while adjusted earnings per share climbed 12%, underscoring the company’s ability to grow profits faster than sales.[3] Management guided 2026 adjusted EPS to a range of $10.35 to $10.65 and projected sales between $38.8 billion and $39.8 billion, signaling confidence that aerospace and other core segments can keep delivering despite macro uncertainty.[2][3][6]
Sector-wise, Honeywell continues to benefit from strong aftermarket demand in aerospace, as airlines and operators work through delayed aircraft deliveries and extend the life of existing fleets.[6] That dynamic has supported higher-margin service work, which has been a key profit driver for Honeywell’s aerospace technologies business and a major reason the stock has held a premium multiple within the industrials and aerospace sector.[2][6]
Strategically, Honeywell is also advancing an aerospace spin-off that aims to sharpen the company’s portfolio and unlock value by separating faster-growing, higher-margin assets from more cyclical operations.[4] In January 2026, JPMorgan reiterated a “Buy” view on Honeywell and highlighted the planned break-up as a catalyst, with a consensus price target around $255 that sits modestly above current levels and reflects expectations for continued earnings growth and portfolio optimization.[4]
Investors are still digesting the impact of a $470 million charge tied to a potential settlement with Flexjet, which Honeywell flagged in late 2025 as a drag on fourth-quarter results.[5] That one-off hit did not derail the broader earnings trajectory, but it did remind investors that legal and regulatory issues can periodically cut into reported profits even when underlying demand is strong.[5]
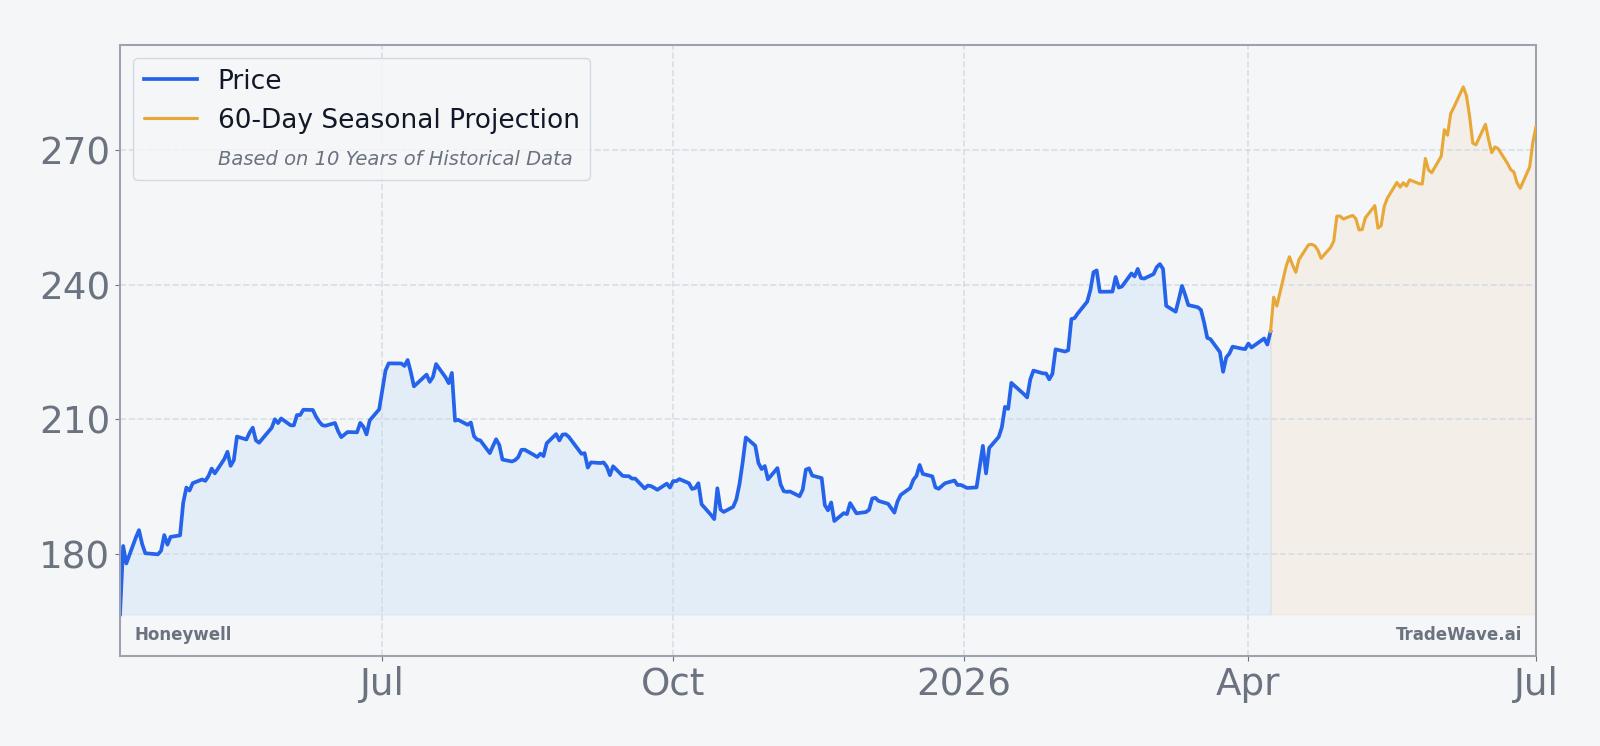
The chart below situates the latest move in its recent multi-month context and overlays the 60-day seasonal projection on Honeywell’s price path.
What should traders watch in this Honeywell (HON) window?
For the next 60 trading days, the key question is whether Honeywell’s strong historical seasonality can keep working from a starting point near the upper end of its recent range. The 10-for-10 record and 7.02% average gain suggest a bullish seasonal bias, but the history of sizable intraperiod drawdowns means traders should be prepared for volatility even if the window ultimately finishes higher.
On the fundamental side, watch for any updates on the aerospace spin-off timeline and additional color on aftermarket demand, which have been central to the bullish thesis and could reinforce or challenge the current premium valuation.[4][6] Any shift in guidance around the 2026 EPS range of $10.35 to $10.65 or the $38.8 billion to $39.8 billion sales outlook would also matter for how much room the stock has to run in this seasonal window.[2][3]
From a levels perspective, the 52-week high near $248.18 is the obvious upside reference, while the 50-day moving average around $233 acts as a nearby gauge of trend strength. A sustained push above the prior high during the window would be consistent with the historical pattern of spring strength, while a break below the 50-day average with heavy volume would be an early sign that this year’s window may diverge from the past.
Finally, traders should monitor how intraday and multi-day pullbacks behave relative to the historical maximum adverse excursions. In prior years, even deep drawdowns inside the window have often reversed into higher closes by day 60, but there is no guarantee that will repeat. If Honeywell sells off sharply and fails to recover in the way past windows have, that would be a clear signal that this year’s pattern is breaking script and that the usual seasonal tailwind may be fading.
Sources
- Forbes: "Why Smart Money Should Buy Honeywell Stock" (Jan 30, 2026)
- Zacks Investment Research: "HON's Q4 Earnings Top Estimates, Aerospace Technologies Sales Up Y/Y" (Jan 29, 2026)
- Yahoo Finance: "HON's Q4 Earnings Top Estimates, Aerospace Technologies Sales Up Y/Y" (Jan 29, 2026)
- CNBC: "Honeywell is a buy as planned break-up continues, JPMorgan says" (Jan 16, 2026)
- Yahoo Finance: "Honeywell expects $470 million charge from Flexjet settlement" (Dec 22, 2025)
- Reuters: "Honeywell's revenue, profit rise as aerospace aftermarket demand stays strong" (Jan 29, 2026)
- CNBC: "Stocks making the biggest moves premarket: Honeywell, Strategy, Oracle & more" (Dec 22, 2025)
About this seasonal analysis
Seasonal pattern data is sourced from TradeWave.ai, which analyzes historical price behavior across annual calendar windows going back up to 30 years. Read the full data methodology or the book The 100-Year Pattern by Afshin Moshrefi (2026 edition). Past performance of seasonal patterns does not guarantee future results. This article is for informational purposes only and does not constitute investment advice.