Teradyne (TER) Has Dropped in 8 of 10 Midterm Springs in This 23-Day Weak Window
Teradyne is trading near record highs just days before a historically weak 23-day midterm-year window that has often rewarded short sellers and brought sharp swings.

What is the seasonal pattern for Teradyne (TER)?
Teradyne has fallen in 8 of 10 midterm-year spring windows during this 23-day stretch, with an average gain of 5.79% in winning short years.
- 8 for 10 in this window, with short-side winners averaging 5.79% moves in Teradyne over 23 trading days.
- Percent Profitable is 80%, with 8 winning short years and 2 losing years across the last 10 midterm election cycles.
- Including every year, Avg Profit - All is 5%, showing that losses in the two squeeze years have not erased the pattern.
- The window runs from Apr 21 for 23 trading days, lining up with the early part of the midterm election year in the presidential cycle.
- Historical intraperiod swings have been wide, with several years showing double-digit adverse moves even when the short ultimately worked.
- TradeWave Ratio of 1.44 and a Sharpe ratio of 0.88 point to a historically efficient but volatile short window for TER.
According to historical data from TradeWave.ai, this specific midterm-year stretch has behaved very differently from an average month for Teradyne, and the next iteration is about to open.
How has Teradyne (TER) traded in this midterm-year spring window?
Teradyne has delivered profitable short trades in 8 of the last 10 midterm election years during the 23 trading days starting Apr 21, with winning years averaging 5.79% moves in the trade direction. Shares finished Monday at $370.13, up 0.6% on the day and about 7.3% above their 52-week high of $344.92, leaving the stock stretched into this historically weak patch for longs.
The presidential election cycle matters here because this pattern is built only from the last 10 midterm election years, not from every calendar year. Midterm years often bring policy uncertainty, tighter financial conditions and choppier trading in cyclical tech, which can amplify swings in semiconductor equipment names like Teradyne.
This seasonal window begins on Apr 21 and spans 23 trading days. Historically, during this period Teradyne has tended to drift lower, consistent with a short trade direction, even as the broader AI and semiconductor narrative has often remained constructive.
Across the 10 midterm-year samples, the Percent Profitable figure of 80% means short positions would have finished in the green in eight years, with only two losing squeezes. Average profit in those winning years is 5.79%, while including all years trims the average to 5%, showing that the losing years were meaningful but not catastrophic for the pattern.
The per-year table shows how uneven the path can be. In 2002, for example, the short finished with a 12.31% gain as Teradyne slid from an entry around $32.14 to an exit near $28.18, but the worst intraperiod drawdown from entry reached 17.84% against the trade before the decline took hold. In 2018, the short ended up 9.42% as the stock fell from roughly $38.86 to $35.20, yet the maximum adverse move during the window still stretched to 20.74% before rolling over.
Those swings highlight the role of MFE and MAE. Maximum favorable excursion, or MFE, captures the best point-to-peak move in the trade direction during the window, while maximum adverse excursion, or MAE, tracks the worst drawdown from the entry. Several years show MFE in the high single digits or low teens alongside double-digit MAE, a profile that points to high-variance trading where both rallies and selloffs can be sharp before the final outcome is set.
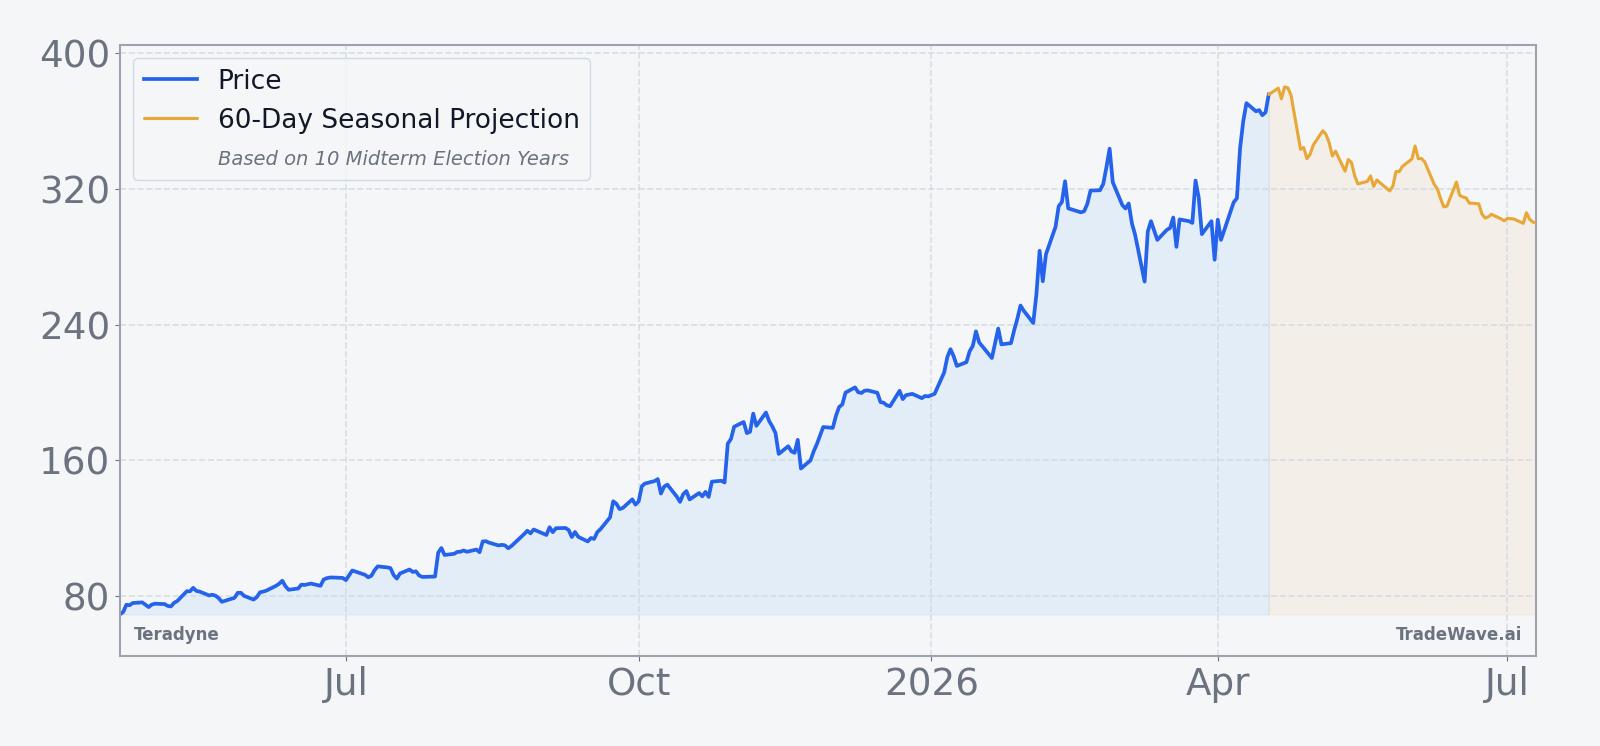
The historical seasonal trend chart shows that, on average, the short-friendly drift tends to build gradually rather than in a single air pocket. The typical path features early choppiness, followed by a more consistent move in the trade direction into the back half of the window, which is where many of the larger net returns have accrued.
The bars with MFE and MAE put those average tendencies into concrete yearly ranges.
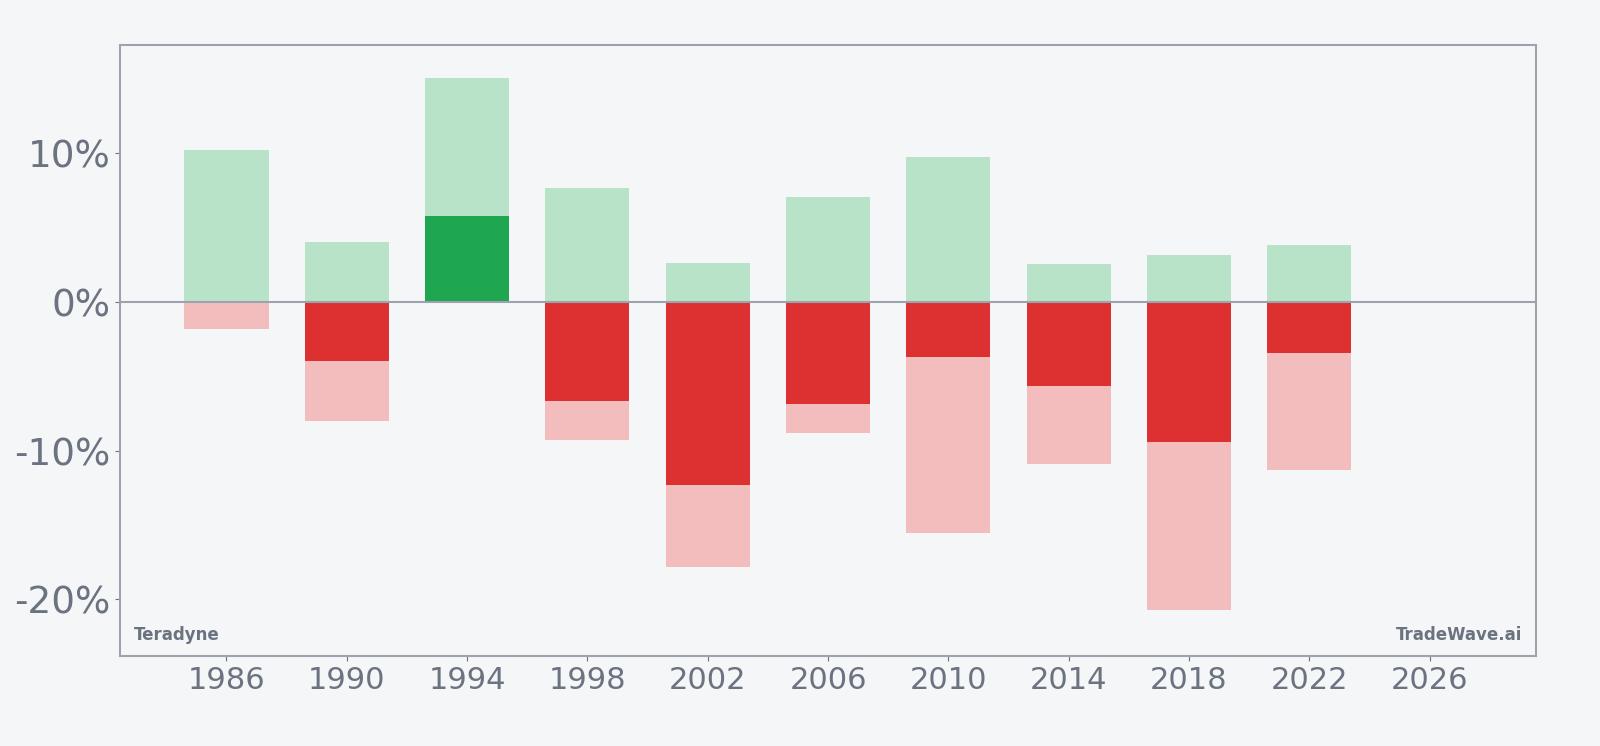
The stacked net, MFE and MAE bars make the trade-off clear: when the short works, it has often delivered mid-single to low-double-digit gains, but the worst years have seen sizable squeezes against the position before resolving. Add it up: 55% cumulative return across the 10 midterm-year windows, annualized at 4.52%, with a TradeWave Ratio of 1.44 that reflects meaningful travel in the trade direction relative to the holding period.
History does not guarantee future results, and adverse excursions can be large even in winning windows, so position sizing and risk controls matter as much as the seasonal edge.
Why does Teradyne (TER) follow this seasonal pattern?
One likely driver is the way semiconductor capital spending and test-equipment orders bunch around midyear, which can leave April and May as digestion periods after strong booking cycles. Analysts have also pointed to institutional portfolio rebalancing in the early part of midterm election years, when investors often trim high-beta AI and chip exposure ahead of policy and rate surprises. For a stock like Teradyne that sits at the intersection of AI infrastructure and cyclical capex, that combination can translate into a repeatable midterm-year soft spot on the calendar.
What is driving Teradyne (TER) today?
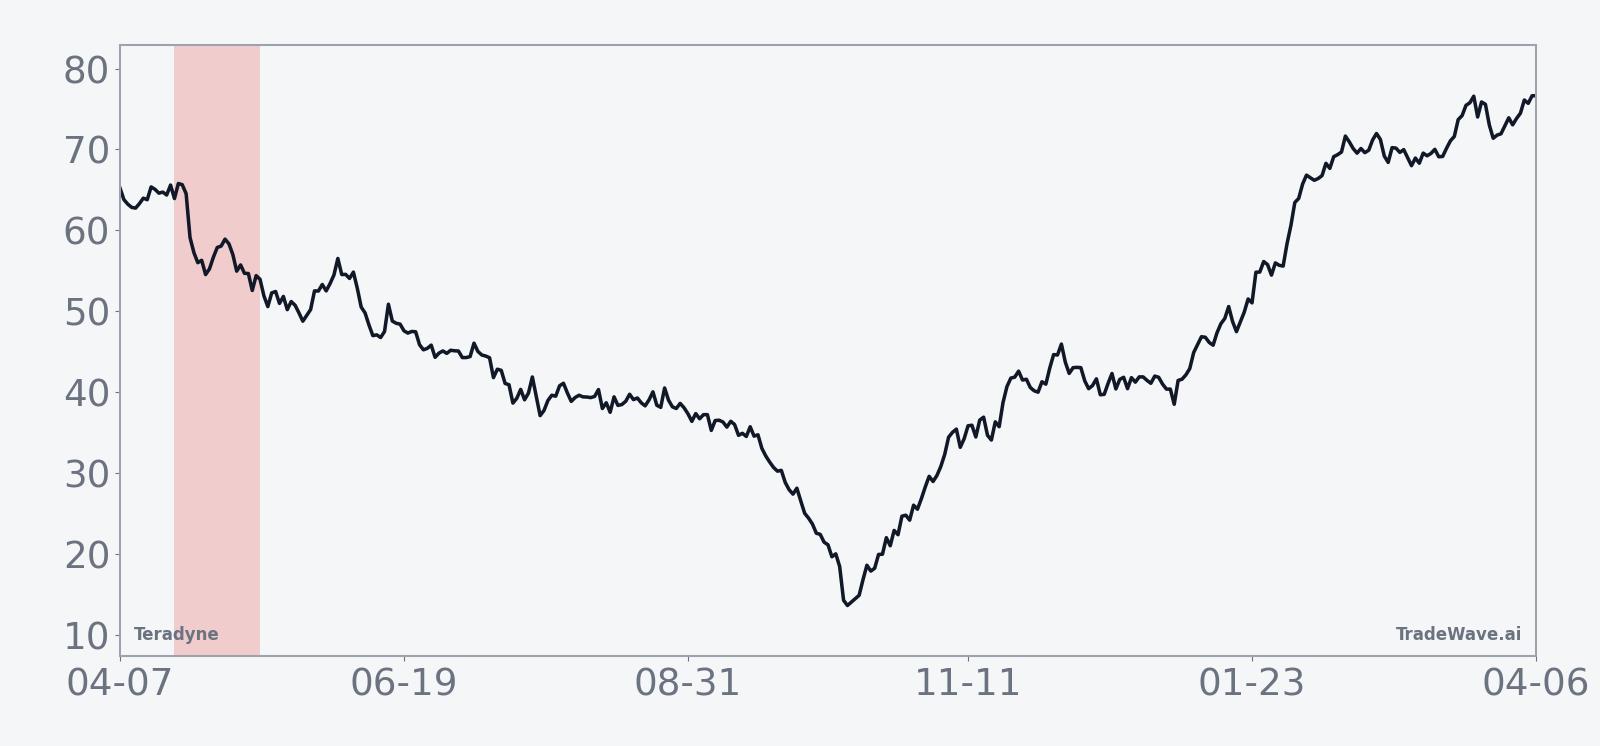
Teradyne closed at $370.13 on Apr 14, up 0.6% on the session, extending a powerful run that has carried the stock about 467.1% above its 52-week low of $65.29 and roughly 7.3% beyond its 52-week high of $344.92. The move caps a stretch that included a 51% jump and a 20% single-session pop around its February earnings beat, when the company reported Q4 2025 revenue of $1.08 billion and adjusted EPS of $1.80, both ahead of expectations, and guided Q1 revenue to a range of $1.15 billion to $1.25 billion on strong AI-related demand.[2][3][4]
In February 2026, coverage from CNBC and The Wall Street Journal highlighted how AI infrastructure buildout has turned Teradyne into a key beneficiary of semiconductor testing demand, with Q4 profit rising to $257.2 million from $146.3 million a year earlier and revenue up 44% to $1.08 billion.[2][4] In October 2025, Forbes and Business Insider similarly framed the stock as an under-the-radar AI play tied to robust demand for system-on-a-chip test solutions, even before the latest leg of the rally.[1][5] That backdrop helps explain why average 20-day volume sits above 3.1 million shares and why the stock has been able to power through prior resistance levels.
The chart below situates the latest surge against its 12-month path and overlays the upcoming 60-day seasonal projection.
What should traders watch as this seasonal window approaches?
The first marker is timing. The 23-day window opens on Apr 21, so price action in the next few sessions will determine whether Teradyne enters the stretch extended above its 50-day moving average of about $296.13 or after some consolidation. A sustained perch far above that trend line would leave more room for mean reversion if the historical midterm pattern reasserts itself.
Second, watch how the stock behaves around prior breakout zones near the old 52-week high around $344.92. A decisive break back below that level during the window would line up with the historical short bias, while a firm hold or further squeeze higher would look more like one of the two losing years in the sample.
Third, monitor liquidity and volatility. The earlier 51% jump and 20% post-earnings spike show how quickly sentiment can flip in this name when AI demand headlines hit the tape.[2][3] If similar volume surges appear during the window, they could either accelerate a downside move that fits the seasonal script or fuel another squeeze that cuts against it.
Finally, keep an eye on the broader policy and macro calendar typical of midterm election years, including rate decisions and any shifts in fiscal or regulatory tone toward AI and semiconductors. If those catalysts land inside the Apr 21 to late-May stretch, they could provide the spark that decides whether this iteration of the Teradyne trading window looks like the eight profitable short years or one of the two outliers.
Sources
- [1] Forbes, "What Is Happening With Teradyne Stock?", Oct 30, 2025
- [2] CNBC, "Teradyne stock pops on earnings beat driven by AI demand", Feb 3, 2026
- [3] CNBC, "Stocks making the biggest moves after hours", Feb 2, 2026
- [4] The Wall Street Journal, "Teradyne Profit Rises as Sales Surge on AI-Related Demand", Feb 2, 2026
- [5] Business Insider, "3 Under-the-Radar AI Stocks for Investors to Watch, According to UBS", Oct 28, 2025
About this seasonal analysis
Seasonal pattern data is sourced from TradeWave.ai, which analyzes historical price behavior across annual calendar windows going back up to 30 years. Read the full data methodology or the book The 100-Year Pattern by Afshin Moshrefi (2026 edition). Past performance of seasonal patterns does not guarantee future results. This article is for informational purposes only and does not constitute investment advice.