Teradyne (TER) Has Fallen in 8 of 10 Midterm Windows Starting Apr 21 as 23-Day Weak Stretch Opens
Teradyne is heading into a historically weak 23-day midterm-election-year window just as the stock trades near record highs on AI-fueled momentum.

What is the seasonal pattern for Teradyne (TER)?
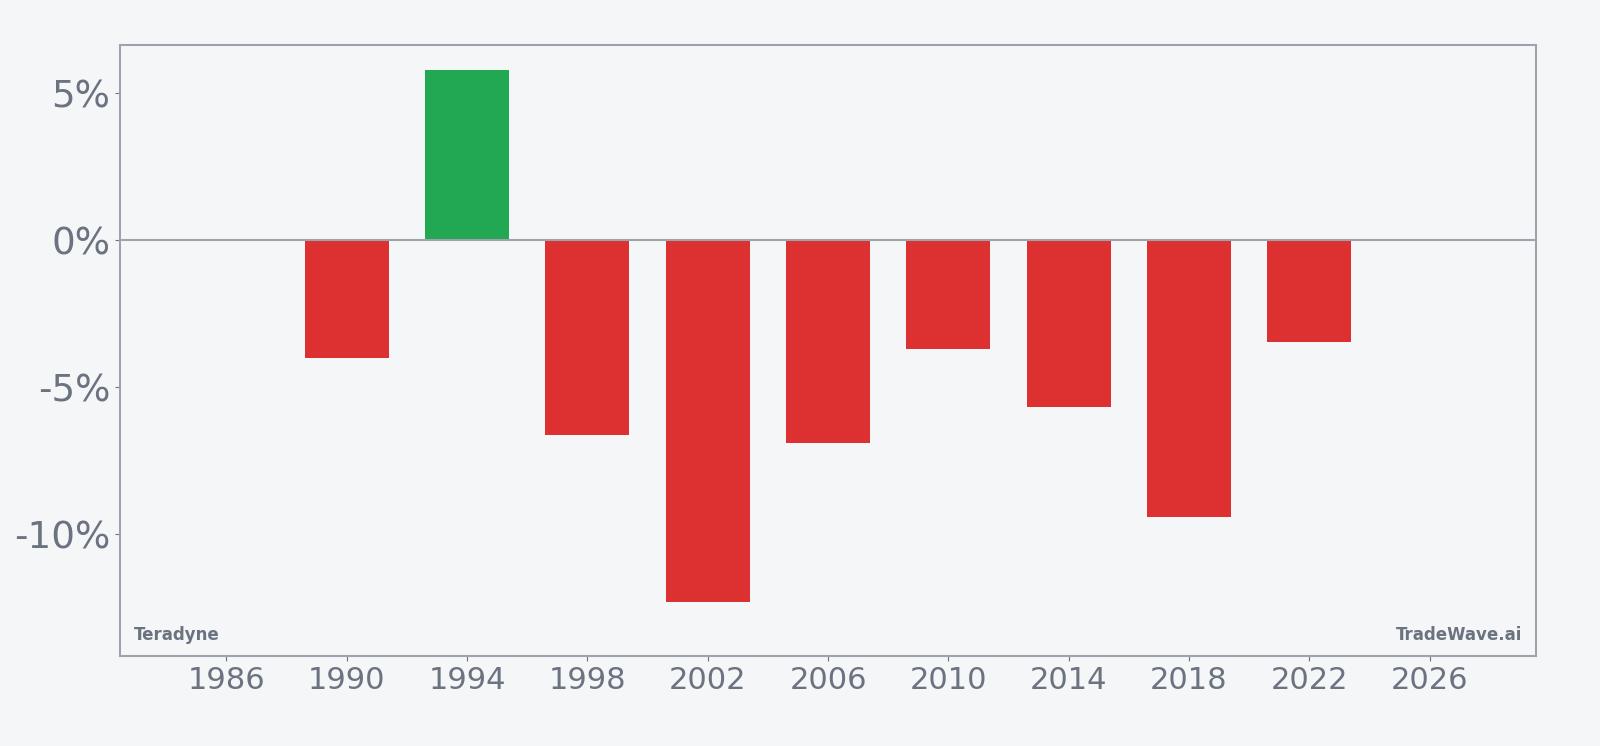
Teradyne has fallen in 8 of 10 midterm-election-year windows starting around Apr 21, with an average 5.79% gain in winning years for the short setup.
- 8 for 10 in this window for the short side, with winners averaging a 5.79% move in the trade direction.
- The upcoming 23-day window begins on Apr 21 and is grouped across the last 10 midterm election years.
- Percent Profitable is 80%, with 8 winning years and 2 losing years for the short pattern.
- Average outcome across all years is a 5% move in the short direction, showing that down years have outweighed the squeezes.
- Individual years have seen adverse excursions as deep as about 20% against the short, underscoring meaningful drawdown risk.
- The TradeWave Ratio of 1.44 and a Sharpe ratio of 0.88 point to a historically efficient but volatile short window.
According to historical data from TradeWave.ai, this specific slice of the midterm-election calendar has behaved very differently from an average month for Teradyne.
How has Teradyne (TER) traded in this midterm-year April–May window?
Teradyne has dropped in 8 of the last 10 midterm-election-year windows that start around Apr 21 and run for 23 trading days, making this a historically bearish stretch for the stock. Shares finished Monday at $380.38, up 3.95% on the day and roughly 0.3% below their 52-week high of $381.47, after a powerful run that has left the stock up about 16% year to date.
Because this pattern is grouped by the presidential election cycle, it only looks at midterm election years, which tend to feature heavier policy uncertainty and more choppy trading in cyclical names. The calendar today is in the midterm election year, early in the year, so the upcoming window lines up directly with that phase rather than averaging across calmer pre-election or post-election environments.
For this setup the trade direction is short, so negative returns and drifting-lower behavior have been the “good” years for the pattern. Across the last 10 midterm-election-year samples, 8 of those windows ended with profits for the short side and 2 finished as losing shorts, giving a Percent Profitable reading of 80%. Average profit in the winning short years is 5.79%, while the average across all years, including the squeezes, is still a 5% move in favor of the short.
The per-year table shows how uneven those outcomes can be. In 2002, for example, the short trade finished with a 12.31% gain as Teradyne slid during the window, while 2014 delivered a 5.67% loss for shorts as the stock pushed higher into the close of the pattern. Add it up across the decade of midterm samples and the cumulative return for the short side is 55%, which is a meaningful edge for a 23-day window that repeats only once every four years.
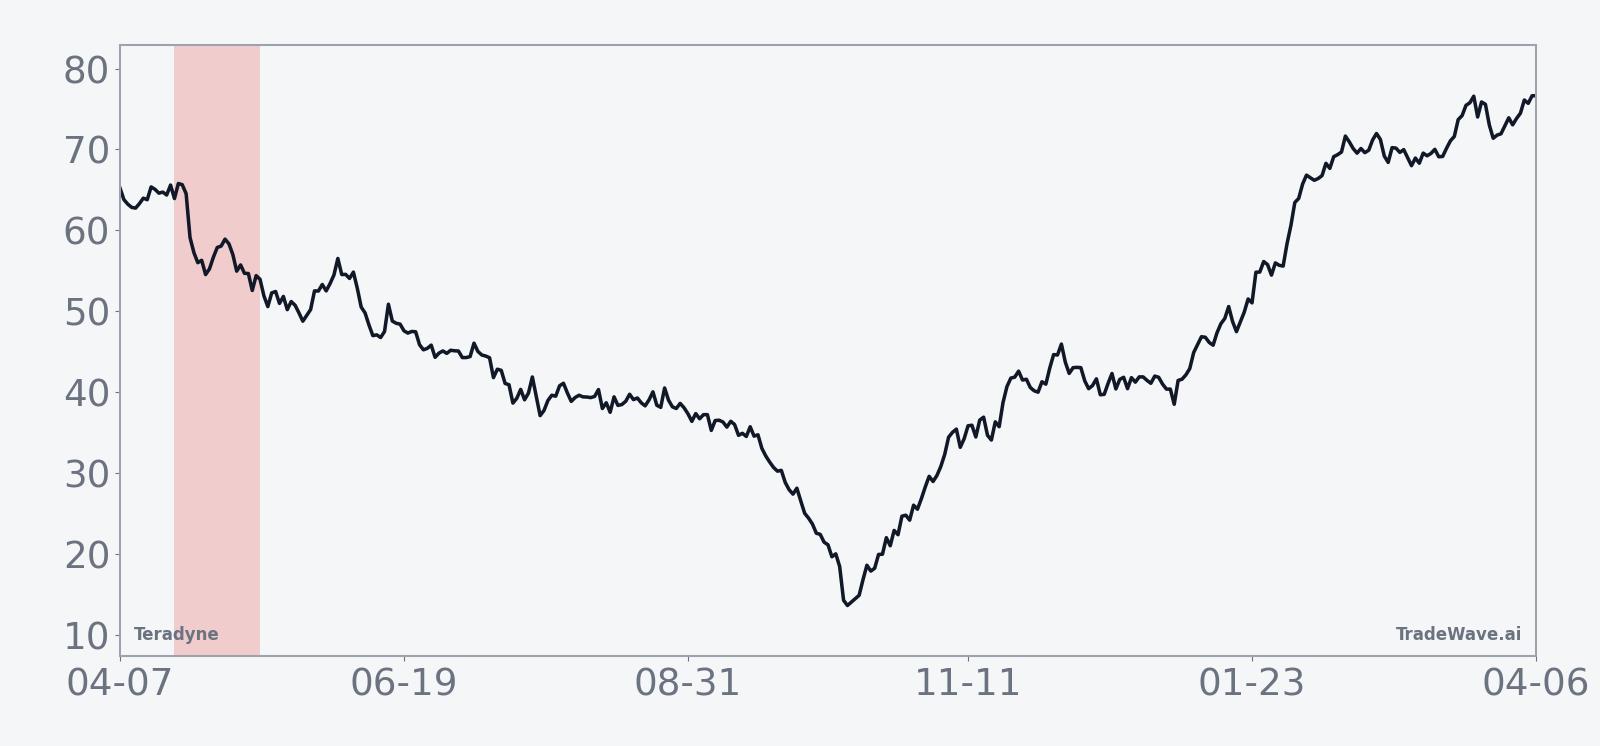
The historical seasonal average suggests that, in the typical midterm year, most of the downside for Teradyne in this window has tended to build gradually rather than in a single air pocket. The trend line slopes lower across the 23 days, with only brief countertrend rallies, which fits a pattern of steady pressure on the stock rather than a one-off shock.
The bar chart with maximum favorable and adverse excursions shows how far Teradyne has swung inside the window before settling at the final result.
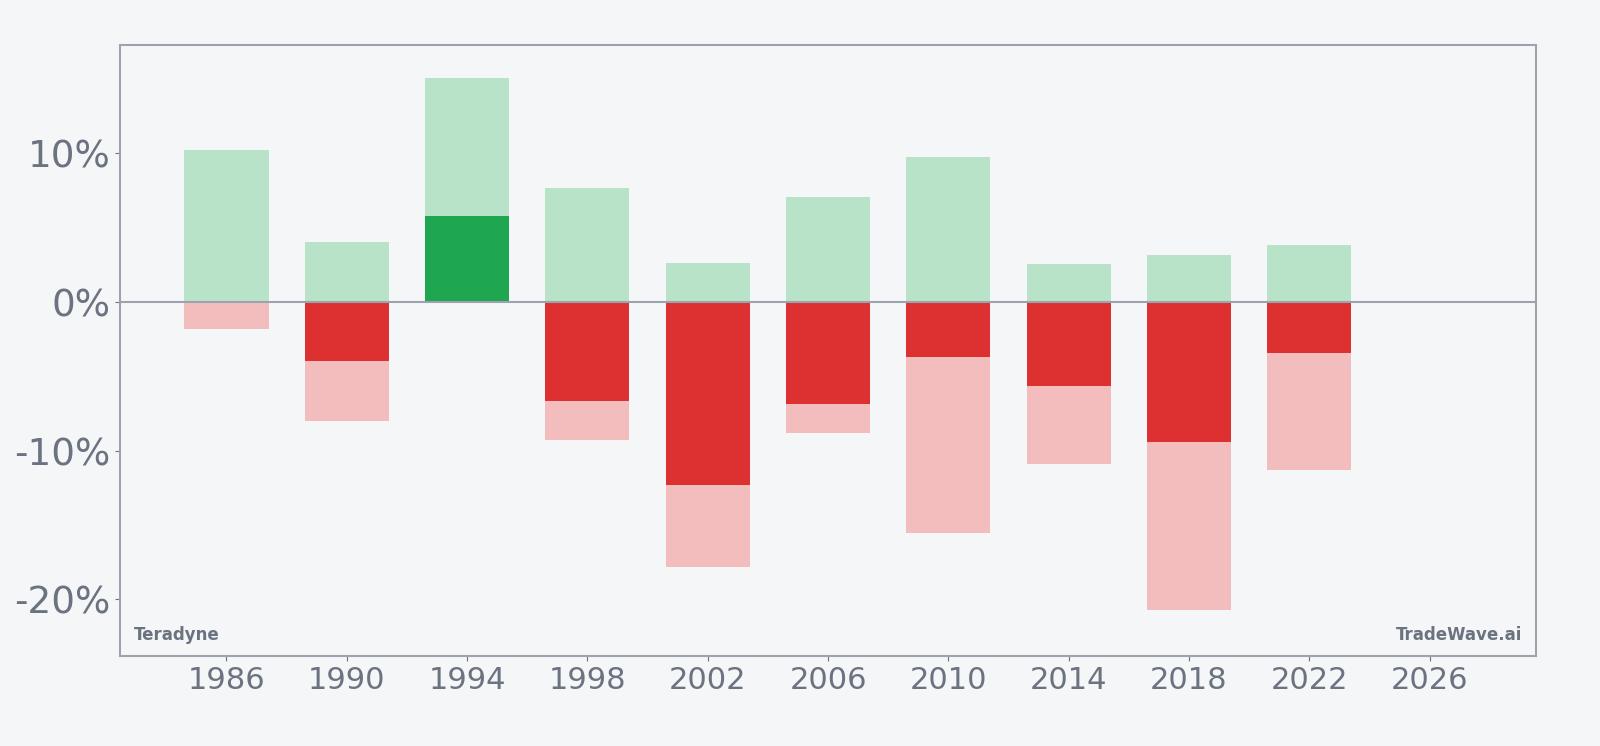
Maximum favorable excursions for the short side have been sizable, with several years showing intraperiod moves of 7% to more than 15% in the trade direction before the window closed. At the same time, maximum adverse excursions have been large in some cycles, including an intraperiod drawdown of about 20.74% against the short in 2018, which illustrates how painful a squeeze can be even in a window that ultimately leans bearish. The TradeWave Ratio of 1.44 captures that, indicating that price has typically traveled meaningfully in the short direction during the window, while the Sharpe ratio of 0.88 reflects a solid risk-adjusted profile based on end-of-window outcomes.
Eight winners out of ten and a 5% all-years average move in the short direction make this one of the more consistent bearish midterm-year windows in Teradyne’s seasonal playbook.
Why does Teradyne (TER) follow this seasonal pattern?
One likely driver is the way midterm-election-year uncertainty intersects with Teradyne’s position in the semiconductor capital equipment cycle. Analysts have pointed to periods of order digestion and cautious spending by chipmakers in the middle of the political cycle, which can weigh on test-equipment names even when long-term AI demand is strong.[1] This window may also capture portfolio rebalancing around early-year earnings and guidance, when investors reassess how much cyclical exposure they want to carry into the rest of the midterm year.[2]
History does not guarantee future results, and maximum adverse excursions inside the window have been large in some years even when the short pattern ultimately finished profitable.
What is driving Teradyne (TER) today?
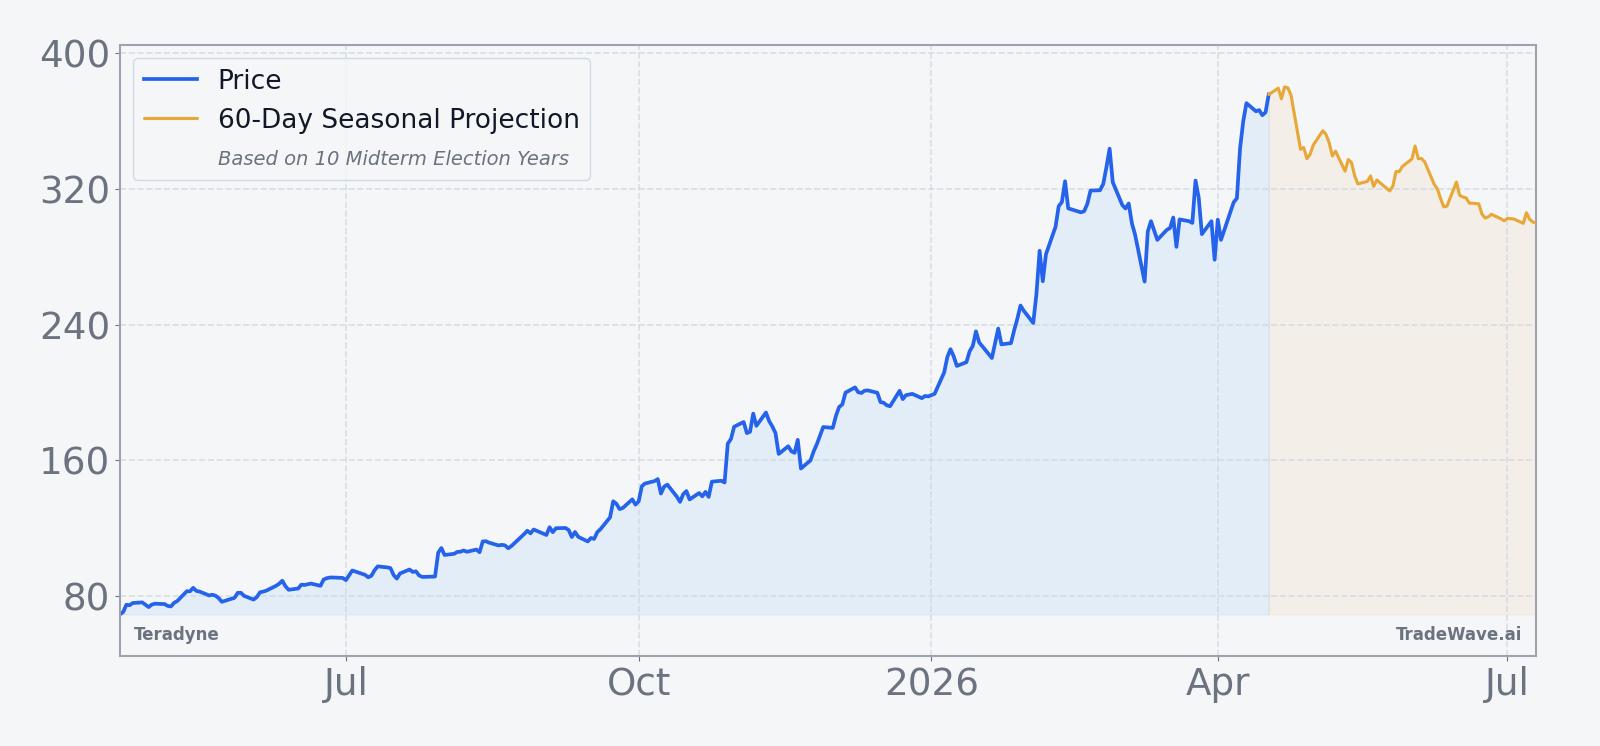
Teradyne closed Monday at $380.38, up 3.95% on the session, extending a sharp run that has left the stock about 16% higher since the start of 2026 and within about 0.3% of its 52-week high of $381.47. Trading volume of roughly 2.4 million shares came in below the recent 20-day average of about 3.1 million, suggesting the latest push higher has not yet drawn in heavy incremental participation.
In February 2026, Teradyne reported Q4 revenue of $1.08 billion and adjusted EPS of $1.80, topping estimates as AI-related demand in Semiconductor Test drove stronger-than-expected growth.[2][3] Management also guided for Q1 revenue between $1.15 billion and $1.25 billion and adjusted EPS of $1.89 to $2.26, reinforcing the view that AI infrastructure spending is still in an early innings build-out phase for the company.[2] Earlier coverage in October 2025 highlighted Teradyne as a beneficiary of robust AI demand in semiconductor testing, and more recent commentary has continued to frame the stock as an under-the-radar AI play rather than a mainstream megacap chip name.[1][4]
The chart below shows how that AI-driven rally has unfolded over the past year, alongside a 60-day seasonal projection.
What should traders watch as this Teradyne seasonal window opens?
With the 23-day midterm-year window set to start on Apr 21, the key question is whether Teradyne’s current AI-fueled uptrend can shrug off a calendar stretch that has historically favored shorts. The first thing to watch is how the stock behaves if it revisits the $381 to $385 area, which roughly brackets the current 52-week high; sustained strength above that band would look more like one of the historical losing years for the short pattern, while a failure there would be more in line with the typical seasonal drift lower.
Second, traders will be focused on whether any macro or sector headlines interrupt the AI demand narrative that has supported Teradyne’s recent earnings beats and guidance.[2][3] A softer tone from large chipmakers on capex, or signs that data center build-outs are pacing more slowly, could provide the kind of catalyst that has historically lined up with weaker midterm-year windows for semiconductor equipment names.
Third, intraperiod volatility will matter as much as the final outcome. Past windows have seen maximum adverse moves against the short of more than 10% in several years, so even traders who lean into the historical pattern will be watching for sharp squeezes that push the stock well above its 50-day moving average around $316 and test risk limits before any seasonal weakness can play out.
Finally, behavior into the back half of the window will help confirm or contradict the historical seasonality. A pattern of lower highs and heavier selling on rallies would fit the 8-for-10 short record, while a clean breakout to new highs on moderate volatility would signal that Teradyne’s current AI cycle is overpowering the usual midterm-year drag, at least in this iteration of the April–May window.
Sources
- [1] Forbes, "What Is Happening With Teradyne Stock?", Oct 30, 2025.
- [2] CNBC, "Teradyne stock pops on earnings beat driven by AI demand", Feb 3, 2026.
- [3] The Wall Street Journal, "Teradyne Profit Rises as Sales Surge on AI-Related Demand", Feb 2, 2026.
- [4] Business Insider, "3 Under-the-Radar AI Stocks for Investors to Watch, According to UBS", Oct 28, 2025.
About this seasonal analysis
Seasonal pattern data is sourced from TradeWave.ai, which analyzes historical price behavior across annual calendar windows going back up to 30 years. Read the full data methodology or the book The 100-Year Pattern by Afshin Moshrefi (2026 edition). Past performance of seasonal patterns does not guarantee future results. This article is for informational purposes only and does not constitute investment advice.