Boyd Gaming (BYD) Has Dropped in 7 of 7 Midterm Windows, Shorts Averaged 20.29%
Boyd Gaming is stepping into a 197-day midterm-election-year stretch that has consistently rewarded short positions, just as the stock trades near a fresh 52-week high.

What is the seasonal pattern for Boyd Gaming (BYD)?
Boyd Gaming has fallen in 7 of 7 midterm-election-year windows starting around Apr 24, with an average short-side gain of 20.29% in winning years.
- 7 for 7 in this window, with short trades averaging 20.29% gains across winning years.
- The seasonal window begins on Apr 24 and runs for 197 trading days during midterm election years.
- Percent Profitable is 100%, with 7 winners and 0 losers for the short-side pattern.
- Average annualized return for the pattern is 19.85%, with a Sharpe ratio of 1.6 based on end-of-window outcomes.
- The TradeWave Ratio of 2.74 indicates that price has typically traveled meaningfully in the short direction within the window.
- Individual years have seen deep intraperiod drawdowns, with adverse moves as large as 63.64% before the trade ultimately finished in the money.
According to historical data from TradeWave.ai, this midterm-election-year stretch has behaved very differently from an average calendar period for Boyd Gaming. The next section walks through how that pattern has played out across the last seven midterm cycles.
How has Boyd Gaming (BYD) traded in this midterm-year seasonal window?
Boyd Gaming has declined in every one of the last seven midterm election years during the 197 trading days starting on Apr 24, delivering a perfect record for short positions with an average gain of 20.29%. Today the stock closed at 89.15, up 3.5% on the session and sitting about 0.9% below its 52-week high of 89.96. That combination of a strong tape and a historically bearish Boyd Gaming trading window is what has seasonal specialists paying attention.
Because this pattern is grouped by the presidential election cycle, it only looks at midterm election years, which often feature policy uncertainty, shifting fiscal priorities and choppy risk appetite. For a regional gaming operator like Boyd, that backdrop can intersect with consumer spending cycles and regulatory headlines in ways that repeat from one midterm year to the next.
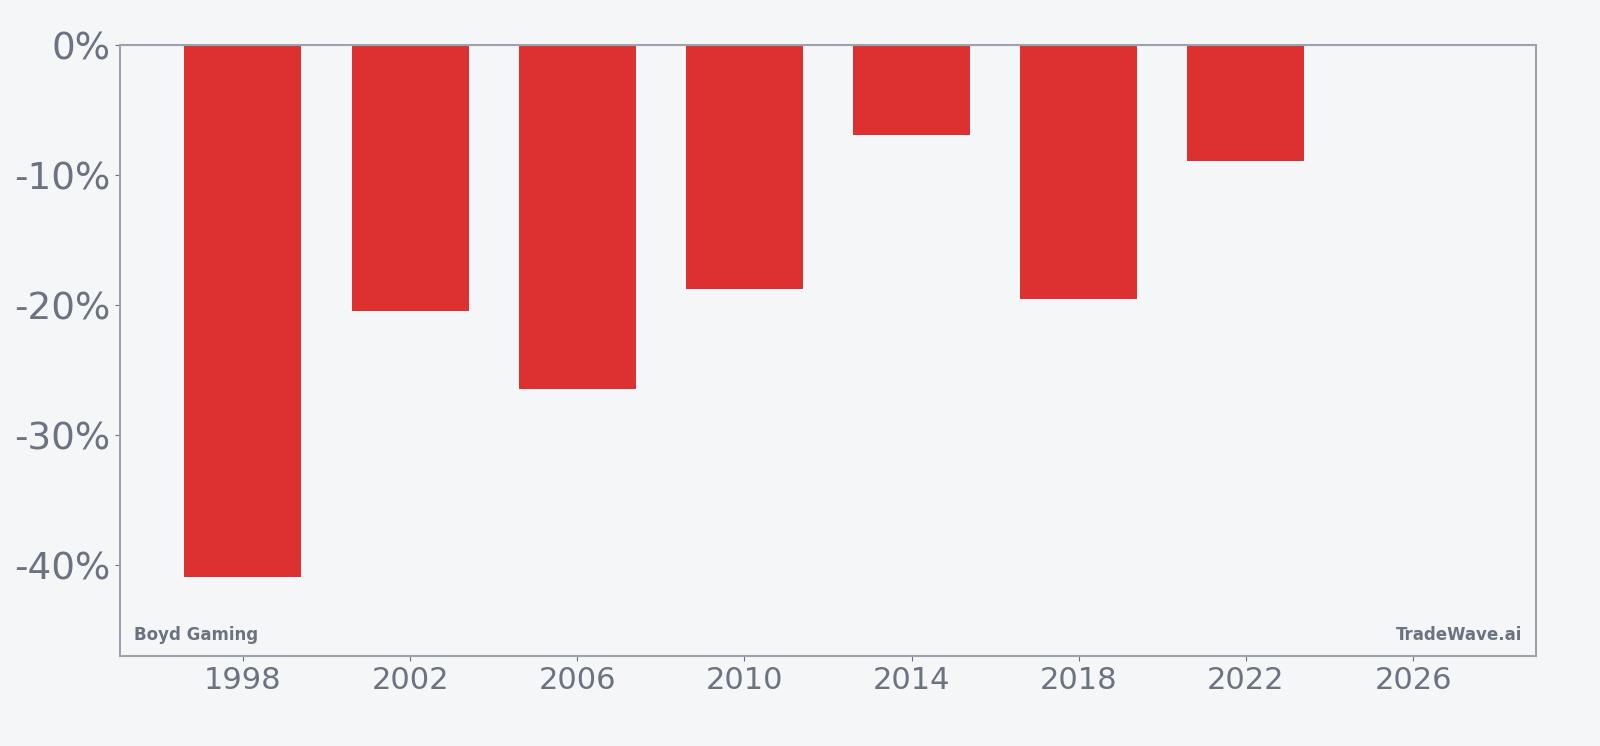
The trade direction for this Boyd Gaming seasonal pattern is explicitly short. In other words, the historical “wins” are years when the stock finished the 197-day window lower than it started, which is favorable for traders positioned for downside. Across the seven midterm years in the sample, the average profit for those short trades is 20.29%, with a cumulative return of 255% and an annualized return of 19.85% for the strategy.
Every year in the lookback has been a winner for the short side, so the all-years average and the average winner are the same. The strongest year in the sample was 1998, when a short entered around 5.98 and exited near 3.54, a net move of about 40.91% in favor of the trade. The softest outcome was 2014, which still delivered a 6.92% gain for shorts over the window.
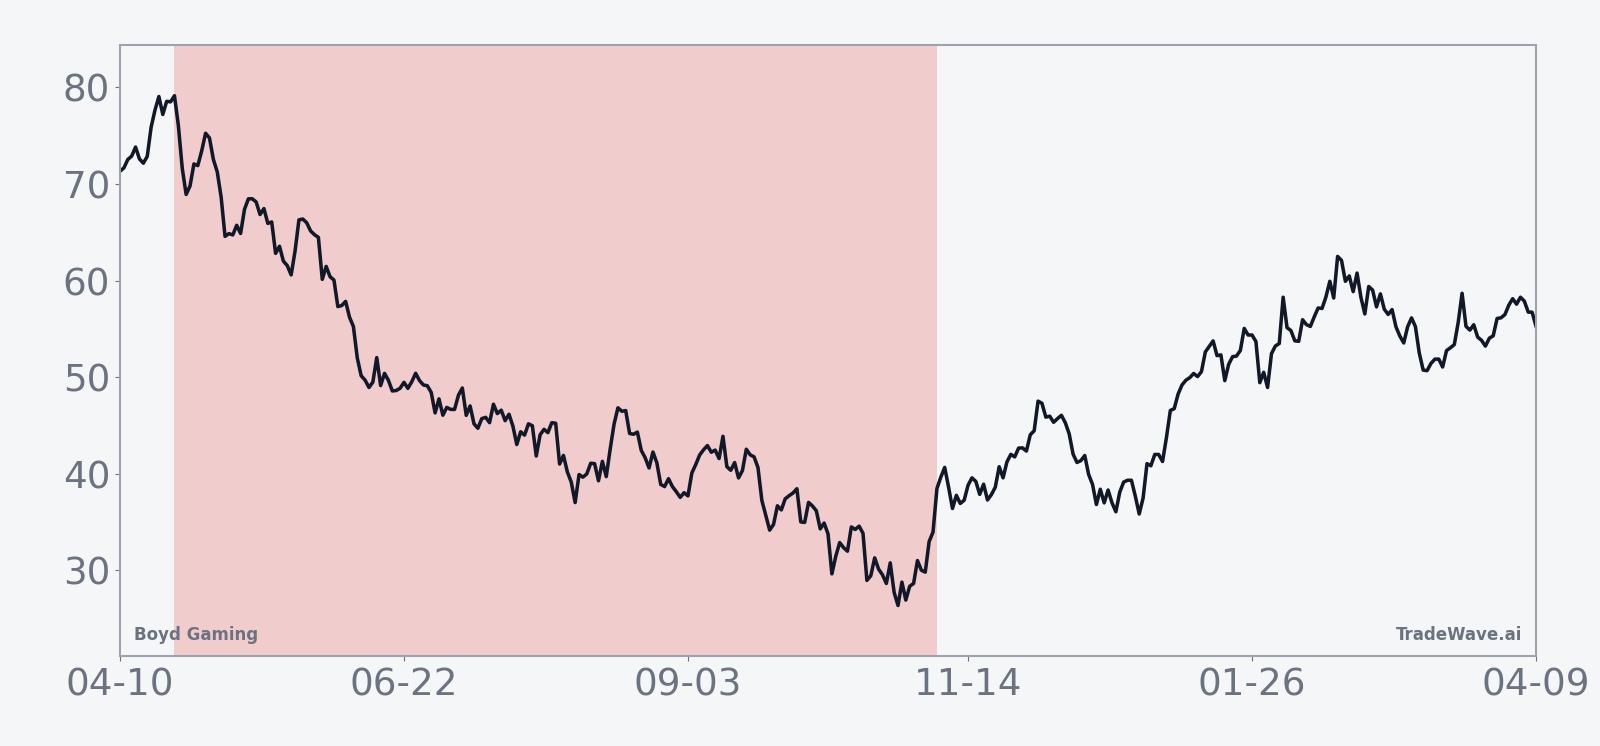
The historical seasonal average trend line slopes steadily lower across the window, with much of the downside accruing in the middle third of the period. That suggests the typical pattern has not been a single crash but a grind lower, punctuated by rallies that ultimately faded in favor of the short-side bias.
The combined net, best-case and worst-case moves by year show how much Boyd Gaming has swung inside this window before settling at the final outcome.
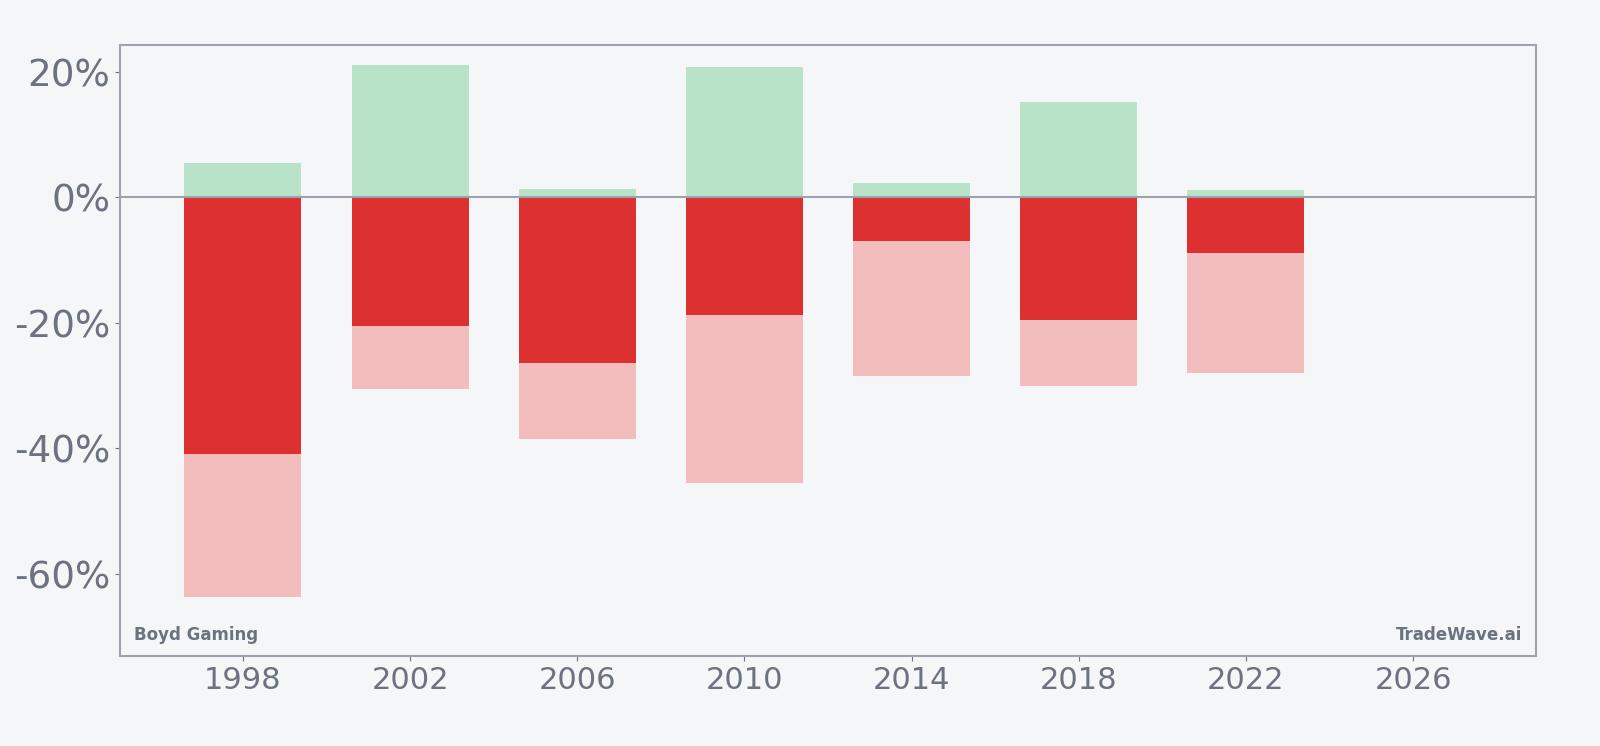
The bars with maximum favorable excursion and maximum adverse excursion tell a more volatile story beneath the smooth average. In 1998, for example, the trade ultimately finished 40.91% in the money for shorts, but the stock first rallied as much as 5.45% against the position and at one point traded 63.64% below the entry before rebounding into the exit. Other years such as 2002 and 2018 show similar patterns, with intraperiod rallies of 15% to 21.14% and drawdowns against the short of roughly 28% to 30.6% before the trade closed profitably.
Put together, the pattern is clear: in the last seven midterm election years, this late-April-to-year-end window has consistently favored short exposure in Boyd Gaming, but it has often done so through a jagged path that includes sharp countertrend moves.
History does not guarantee future results; adverse excursions can be large even in winning windows, and traders using this seasonal pattern still face the risk of sharp rallies and timing error.
Why does Boyd Gaming (BYD) follow this seasonal pattern?
One likely driver is the way midterm election years cluster policy and regulatory uncertainty in the middle of the cycle, which can weigh on discretionary spending and gaming sentiment. Analysts also point to the timing of earnings and guidance resets, which often fall inside this 197-day span and can trigger repricing when expectations get ahead of fundamentals. The pattern may also reflect institutional portfolio repositioning around the policy calendar, as investors rotate exposure within consumer and leisure stocks while they wait for clearer signals on growth and rates.
What is driving Boyd Gaming (BYD) today?
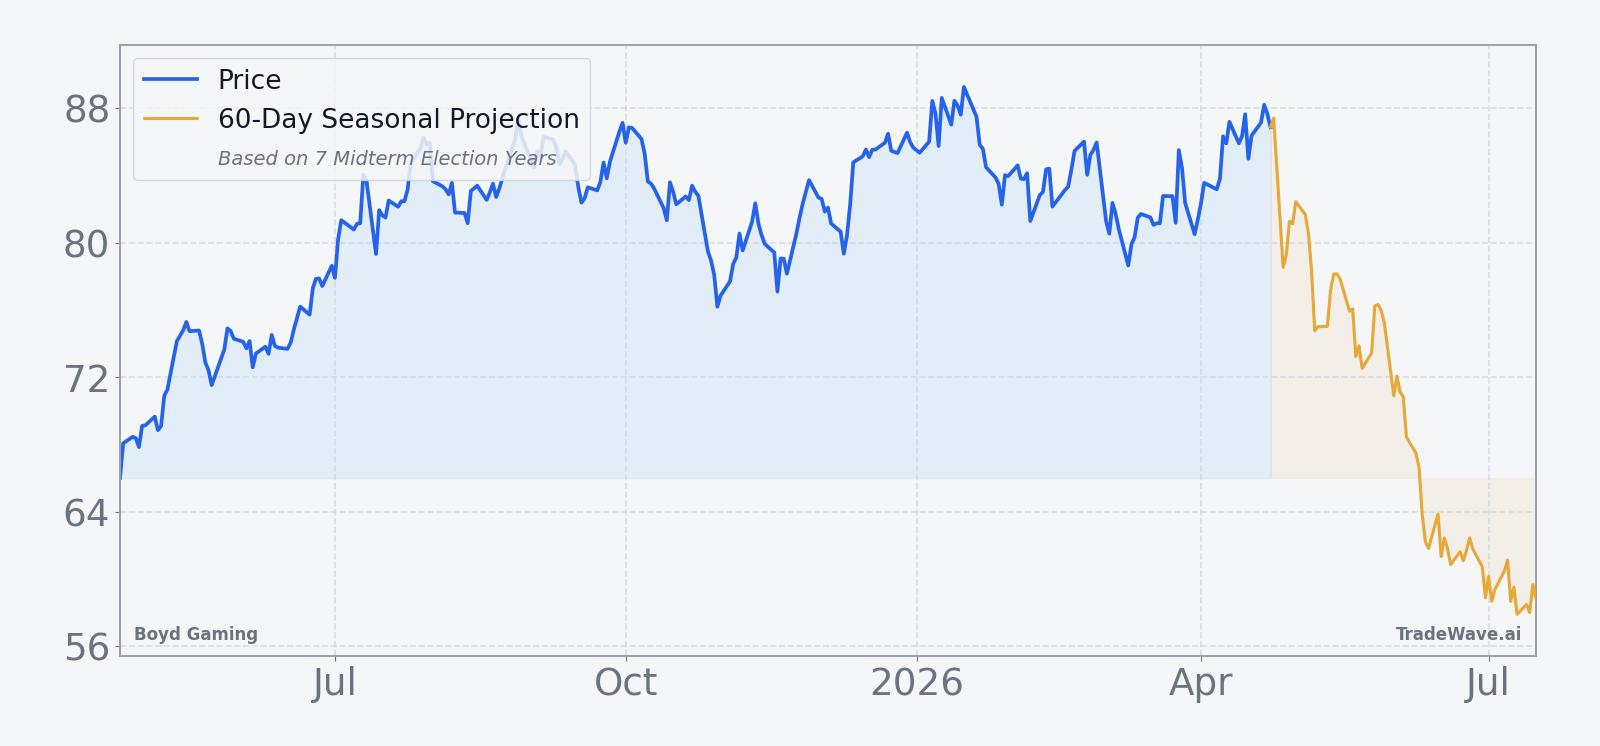
Boyd Gaming shares closed Friday at 89.15, up 3.0 points or 3.5% on the day, after trading between 86.74 and 89.42 on volume of about 1.42 million shares, more than double the 20-day average of 648,248. The stock is pressing against its 52-week high of 89.96 and sits comfortably above its 50-day moving average of 83.79, underscoring how strong the tape has been heading into this historically weak seasonal stretch for the name.
Fundamentally, the near-term calendar is relatively light for Boyd itself, but the broader gaming and real estate complex has a potential catalyst in mid-May, when Gaming and Leisure Properties is projected to announce its second-quarter distribution, an event that can ripple through related casino and regional gaming stocks. That kind of income-focused news can matter for a company like Boyd, which often trades in tandem with yield-sensitive gaming real estate peers when investors recalibrate their views on cash returns and balance sheet flexibility.
The chart below situates the latest move in its recent multi-month context and overlays a short-term seasonal projection.
What should traders watch in this Boyd Gaming (BYD) seasonal window?
First, the key reference point is the 52-week high near 89.96. How Boyd behaves around that level in the coming weeks will signal whether the current breakout can overpower the historical midterm-year seasonal pattern or whether the stock starts to roll over in line with prior cycles.
Second, watch how price reacts around the 50-day moving average near 83.79 if there is any pullback. In past midterm-year windows, some of the biggest short-side gains have come after an initial break of intermediate support, followed by failed rallies that never quite reclaim the prior highs.
Third, keep an eye on sector and policy headlines as the midterm election year progresses. Shifts in consumer confidence, regional economic data and any regulatory noise around gaming or sports betting can all act as catalysts that either reinforce or disrupt the historical Boyd Gaming seasonal trend.
Finally, volatility inside the window matters as much as direction. The historical record shows that even in years that ultimately rewarded shorts, Boyd has often staged double-digit rallies before resuming its downtrend. Traders who track both the magnitude of countertrend moves and the timing of news around them will be better positioned to judge whether this cycle is tracking the historical script or breaking away from it.
Sources
About this seasonal analysis
Seasonal pattern data is sourced from TradeWave.ai, which analyzes historical price behavior across annual calendar windows going back up to 30 years. Read the full data methodology or the book The 100-Year Pattern by Afshin Moshrefi (2026 edition). Past performance of seasonal patterns does not guarantee future results. This article is for informational purposes only and does not constitute investment advice.