Digital Push at Tractor Supply (TSCO) Meets Historically Strong Midterm-Year Stretch
Tractor Supply is sitting near its 52-week low just weeks before a historically strong midterm-year seasonal window that has often rewarded long positions.

What is the seasonal pattern for Tractor Supply (TSCO)?
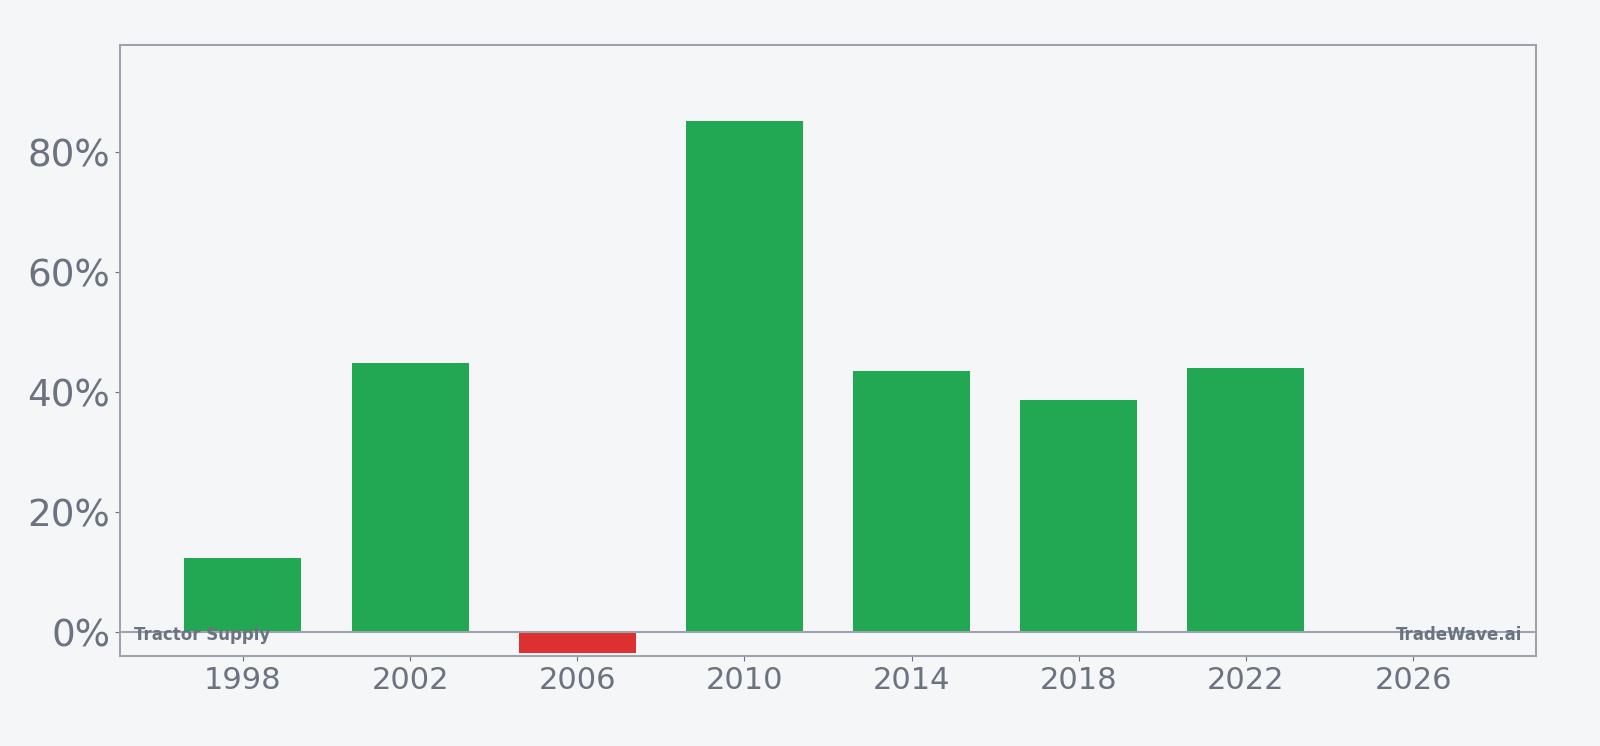
Tractor Supply has risen in 6 of 7 midterm-election-year windows starting around late May, with an average gain of 44.73% in winning years.
- 6 wins and 1 loss in this window, with winning years averaging 44.73% gains and a 38% average when all years are included.
- The upcoming window begins on May 23, 2026 and runs for 335 trading days, covering the late midterm year into the pre-election year.
- Percent Profitable stands at 86%, with 6 winners and 1 loser across the last 7 midterm-election-year cycles.
- Avg Profit reflects only the strong up years, while Avg Profit - All shows the impact of the single losing year.
- Historical drawdowns inside the window have been meaningful at times, with adverse moves exceeding 30% in the weakest years.
- The TradeWave Ratio of 1.36 and a Sharpe ratio of 1.22 point to a historically favorable long setup, albeit with volatility.
According to historical data from TradeWave.ai, this midterm-election-year stretch for Tractor Supply has behaved very differently from an average calendar year, and the next iteration is only weeks away.
How has Tractor Supply (TSCO) traded in this midterm-year seasonal window?
Tractor Supply has risen in 6 of the last 7 midterm-election-year windows that start around May 23 and run for roughly a year, with winning years averaging 44.73% gains. Shares finished Thursday at $38.96, down 1.5% on the day and hovering just above a 52-week low of $38.30, leaving the stock about 38.1% below its 52-week high of $62.96.[1]
Grouping the data by the presidential election cycle matters here because this window spans the heart of the midterm election year into the start of the year before the presidential election, a phase when policy uncertainty often peaks and then fades. For Tractor Supply, that backdrop has historically lined up with a constructive stretch for the stock pattern analysis, even when the broader market has been choppy.
The trade direction for this pattern is long, and the historical record is skewed toward gains. Percent Profitable is 86%, with 6 winners and just 1 loser across the last seven midterm-election-year windows. In the winning years, Tractor Supply’s average gain in this 335-day window was 44.73%, while including the lone losing year pulls the all-years average down to 38%.
The per-year table shows how wide the range has been. The weakest outcome came in 2006, when the stock lost 3.6% over the window despite a maximum favorable move of 4.12% and a maximum adverse excursion of 33.25% from the entry. On the other side, 2010 delivered an 85.19% net gain, with the best intraperiod rally reaching 98.51% before the window closed.
Those maximum favorable and adverse excursions, often shortened to MFE and MAE, highlight the volatility inside the window. In 1998, for example, Tractor Supply finished the period up 12.27%, but at one point it had rallied 18.61% and at another it had been down 31.37% from the starting level. Even in the more recent 2022 window, the stock’s 43.98% net gain came with a 44.67% peak run-up and a 5.36% drawdown along the way.
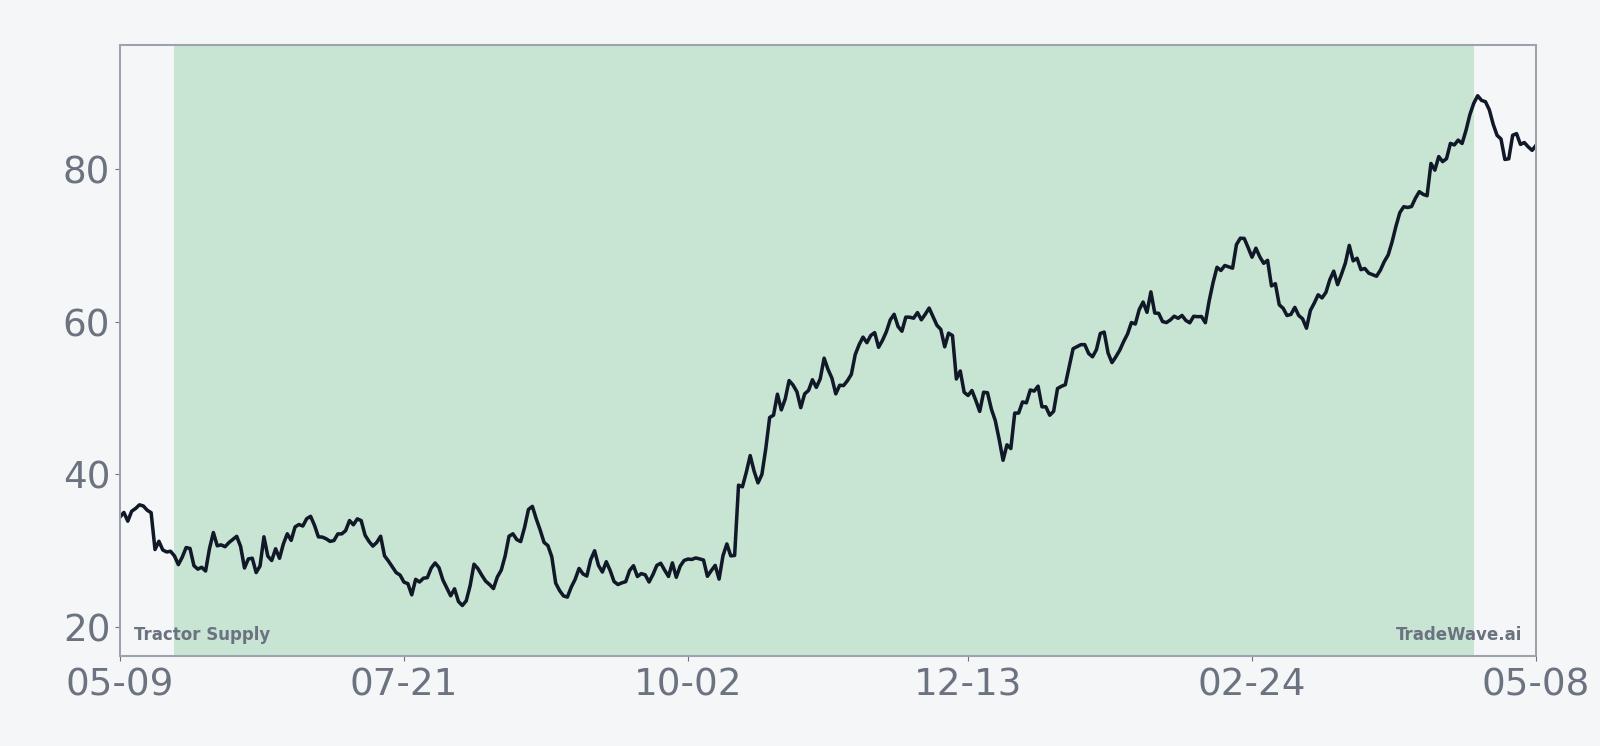
The historical seasonal trend chart shows a pattern that tends to build over time rather than spike early. Returns in the first third of the window have often been choppy, with the bulk of the average gain accruing in the middle and later portions as the calendar transitions from the midterm election year into the year before the presidential election.
A closer look at yearly net results alongside peak rallies and worst drawdowns shows how that upside has come with real risk.
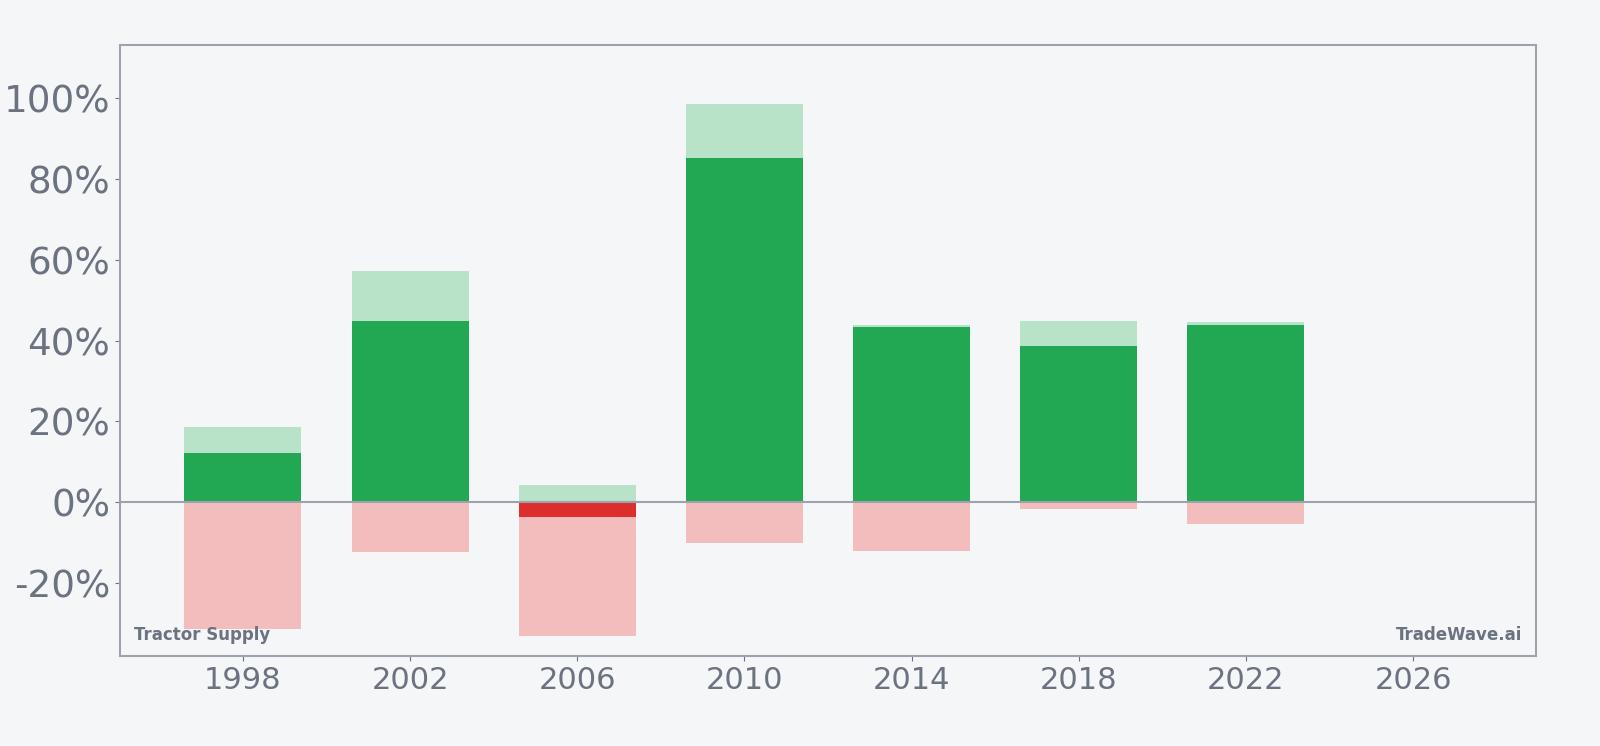
The combined net/MFE/MAE bars show that even the strongest years featured meaningful downside stretches before finishing higher. Large maximum favorable moves paired with sizable maximum adverse excursions point to a high-variance window where both sharp rallies and deep pullbacks have been common. For long traders, the pattern has historically rewarded patience, but it has not been a smooth ride.
History does not guarantee future results; adverse excursions (MAE) can be large even in winning windows.
Why does Tractor Supply (TSCO) follow this seasonal pattern?
One likely driver is the way Tractor Supply’s earnings calendar and capital spending plans line up with the midterm and pre-election policy cycle. Analysts have pointed to consumer spending cycles in rural and suburban markets, where demand for seasonal goods, equipment and home projects tends to build from late spring through the following spring. The pattern may also reflect institutional portfolio repositioning around perceived policy shifts in agriculture, infrastructure and small-business regulation that often cluster around midterm elections.
What is driving Tractor Supply (TSCO) today?
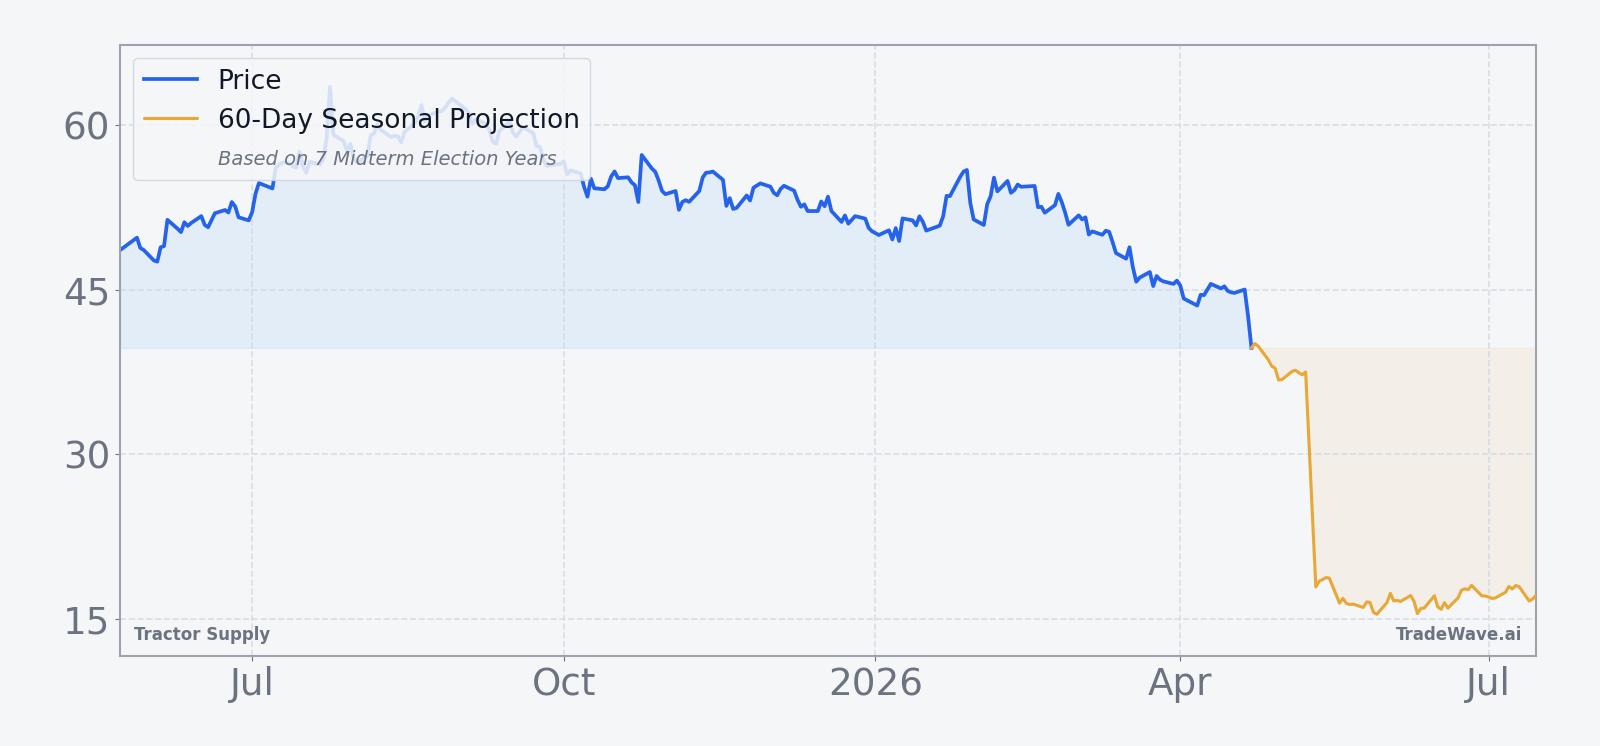
Tractor Supply closed at $38.96 on Apr 23, down 1.5% on the session, after trading between an intraday low of $38.30 and a high of $40.14 on volume of about 14.1 million shares.[1] That leaves the stock roughly 38.1% below its 52-week high of $62.96 and just above its 52-week low, with the 50-day moving average up at $48.10 and 20-day average volume near 7.6 million shares, underscoring how far the name has slipped from its recent trend.[1]
In Aug 2025, Tractor Supply outlined plans to beef up last-mile delivery for bulky goods as part of a push to lift digital sales to 10% to 12% of revenue by 2029 from about 8% at the time, signaling a longer-term shift in its omnichannel strategy.[2] That initiative sits in the background as investors weigh how a softer share price and a historically strong TSCO seasonal trend might intersect with execution on logistics and e-commerce growth.
The chart below situates the latest move in its recent multi-month context alongside a short-term seasonal projection.
What should traders watch as this Tractor Supply seasonal window approaches?
First, the calendar. The next 335-day Tractor Supply trading window tied to the midterm-election-year pattern begins on May 23, 2026, so price action in the weeks leading up to that date will shape how the setup looks as it activates. A firming of the stock back toward the 50-day moving average would signal that buyers are starting to lean into the historical seasonality, while a decisive break below the recent 52-week low would show that current fundamentals are overpowering the pattern.
Second, watch how the stock behaves around key policy and macro headlines as the midterm year progresses into the year before the presidential election. Historically, this phase has seen uncertainty give way to clearer fiscal and regulatory signals, which has often coincided with stronger performance for Tractor Supply in this specific window. If the stock can absorb policy noise without making fresh lows, that would be more consistent with the past midterm-year seasonal behavior.
Third, monitor volume and volatility as the window opens. The historical MFE and MAE profile suggests that when Tractor Supply moves in this regime, it can move quickly in both directions before settling on a final outcome. Elevated volume on up days as the window begins would align with prior strong years, while heavy selling on spikes could hint that this cycle may look more like the lone losing year in the sample.
Finally, traders should track how execution on initiatives like last-mile delivery and digital sales growth intersects with the seasonal backdrop.[2] Strong operational updates during a historically favorable TSCO seasonal trend could reinforce the pattern, while disappointments or guidance cuts would be a clear test of how much weight to put on history versus current fundamentals.
Sources
- [1] EODHD, "Tractor Supply (TSCO) daily quote and 52-week range," data as of Apr 23, 2026.
- [2] The Wall Street Journal, "Tractor Supply Beefs Up Last-Mile Delivery to Grow Sales," Aug 4, 2025.
About this seasonal analysis
Seasonal pattern data is sourced from TradeWave.ai, which analyzes historical price behavior across annual calendar windows going back up to 30 years. Read the full data methodology or the book The 100-Year Pattern by Afshin Moshrefi (2026 edition). Past performance of seasonal patterns does not guarantee future results. This article is for informational purposes only and does not constitute investment advice.