6-for-6 Midterm Run: MicroStrategy (MSTR) Faces a 311-Day Window With 34.53% Avg Gains
MicroStrategy is approaching a 311-day midterm-election seasonal window that has never been negative in this dataset, even as shares trade far below their 52-week high and swing with Bitcoin.

What is the seasonal pattern for MicroStrategy (MSTR)?
MicroStrategy has risen in 6 of 6 midterm-election-year windows starting around May 14, with an average gain of 34.53% in winning years.
- 6 for 6 in this window, with MicroStrategy averaging 34.53% gains across winning years over the last six midterm election cycles.
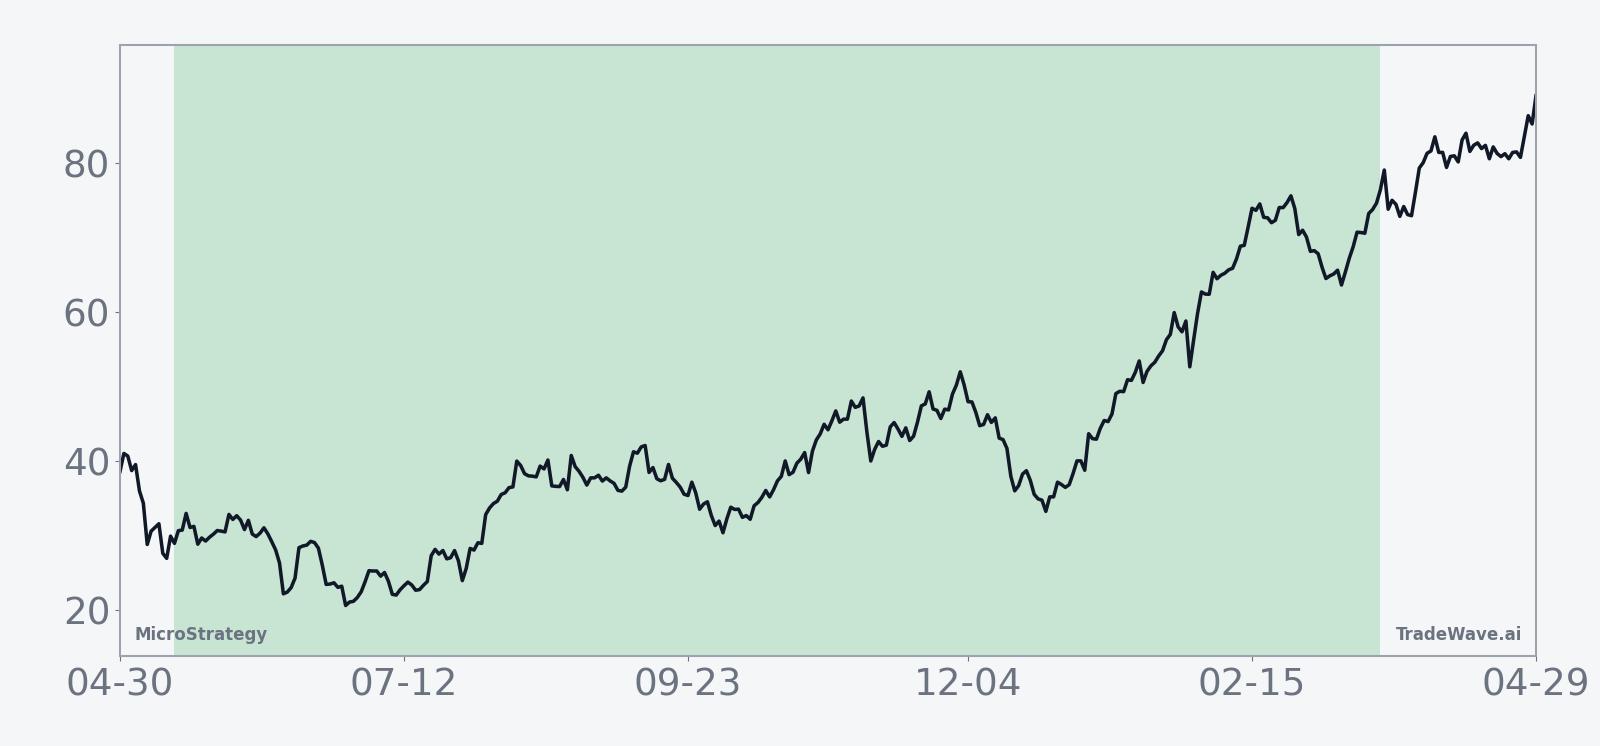
- The upcoming seasonal window begins May 14, 2026 and runs for 311 trading days, covering most of the midterm year into the following pre-election year.
- Percent Profitable is 100%, with 6 winners and 0 losers in this specific MicroStrategy trading window.
- Average winner gains of 34.53% come alongside a strong Sharpe ratio of 2.11 and a TradeWave Ratio of 1.96, pointing to historically favorable risk-adjusted returns.
- Intraperiod swings have been large, with some years showing deep adverse moves before finishing higher, so drawdown risk has been real even in winning seasons.
- This MSTR seasonal trend sits inside the crypto proxy trade, where Bitcoin volatility and policy headlines have often amplified the pattern.
According to historical data from TradeWave.ai, MicroStrategy’s behavior around midterm election years has followed a distinct seasonal script that differs from its performance in other parts of the presidential cycle.
How has MicroStrategy (MSTR) traded in past midterm-year windows?
MicroStrategy has risen in all six midterm-election-year windows that start around May 14 and last 311 trading days, averaging 34.53% gains with no losing seasons in this sample. Today the stock closed at 172.47, down 3.8% on the session and sitting about 62.3% below its 52-week high of 457.22, after a volatile year tied closely to Bitcoin’s swings.[4]
The pattern is built on the last six midterm election years, a phase of the presidential cycle that often brings policy uncertainty, shifting regulation and risk repricing across growth and crypto-linked names. Grouping by this cycle matters for MSTR because the company functions as a leveraged Bitcoin treasury play, so its stock pattern analysis tends to line up with how investors position around midterm-year policy risk and the following pre-election-year liquidity backdrop.[4]
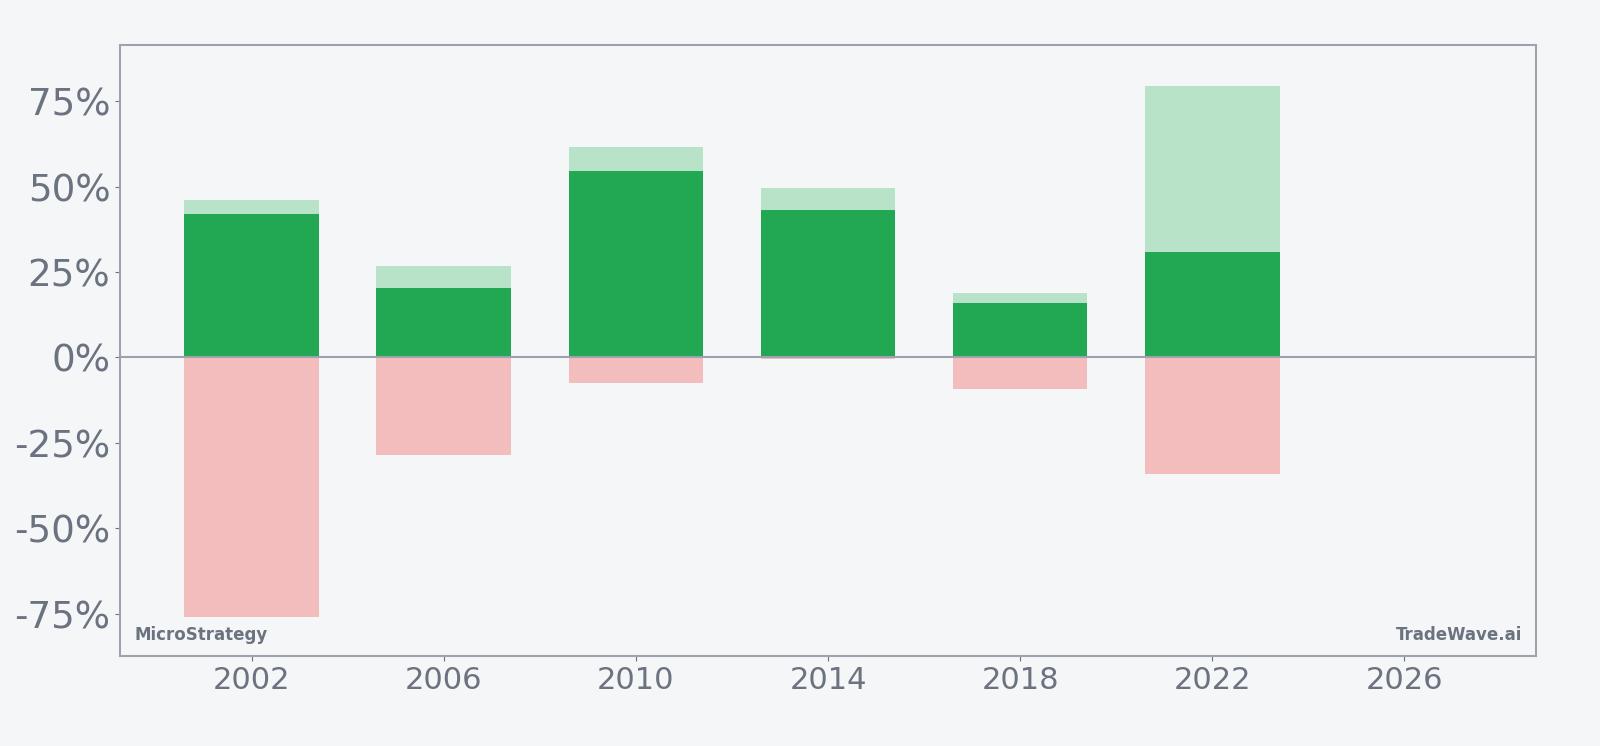
Across individual years, the strongest midterm window in this dataset came in 2010, when MSTR returned 54.53% from entry to exit, with a best intraperiod run-up of 61.77% and only a 7.52% worst drawdown from the starting point. The softest outcome was 2018, which still delivered a 16.05% net gain, with a maximum favorable move of 18.95% and a 9.15% adverse excursion before finishing higher.
Two years stand out for volatility. In 2002, the stock finished the window up 42.05% but experienced a maximum adverse move of 76.14% from the entry level at one point, underscoring how violent swings can be even in a winning season. In 2022, the net gain was 30.99%, yet the best intraperiod rally reached 79.63% while the worst drawdown hit 34.22%, a profile that fits MicroStrategy’s role as a high-beta proxy on Bitcoin’s boom-and-bust cycles.[4]
A second view layers yearly net results with their best and worst intraperiod swings to show how upside and downside have coexisted.
Put together, the pattern is simple and striking: six midterm-year windows, six positive outcomes, and a long bias that has historically rewarded investors who could tolerate sharp swings along the way.
History does not guarantee future results, and even in this all-winner sample, adverse excursions have at times been very large before the stock finished higher.
Why does MicroStrategy (MSTR) follow this seasonal pattern?
One likely driver is how crypto regulation and policy debates tend to cluster around midterm election years, which can amplify Bitcoin volatility and, by extension, MSTR’s moves. Analysts have also pointed to institutional portfolio repositioning between the midterm year and the following pre-election year, when risk appetite often rebuilds after policy uncertainty clears.[4] For a stock that functions as a leveraged Bitcoin treasury vehicle, those flows can translate into the kind of high-beta seasonal behavior this window captures.
What is driving MicroStrategy (MSTR) today?
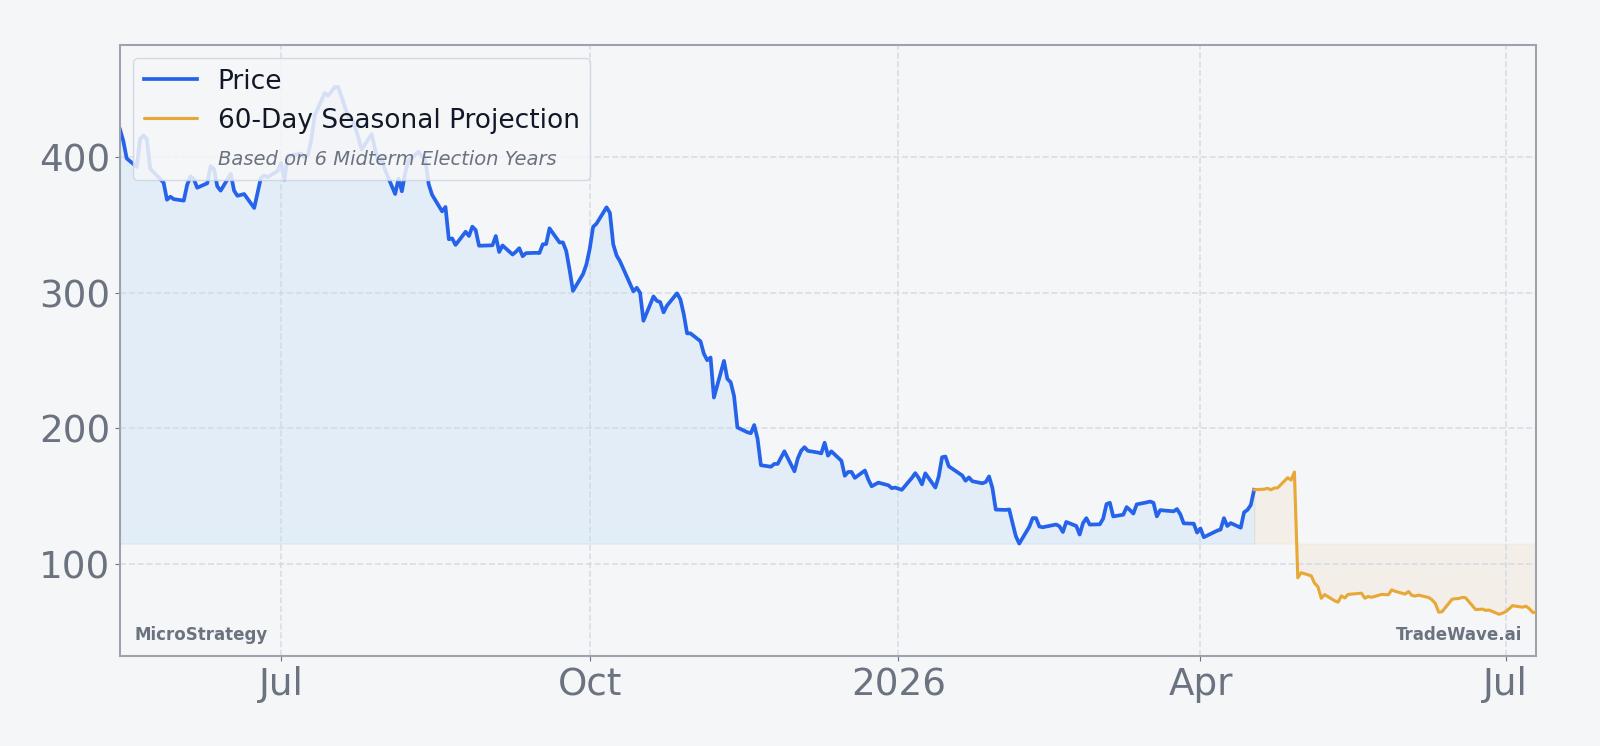
MicroStrategy closed Friday at 172.47, down 3.8% on the day, after trading between 171.54 and 180.92 on heavy volume of about 19.3 million shares, roughly in line with its 20-day average of 19.1 million.[4] The stock is well below its 52-week high of 457.22 and still comfortably above its 52-week low of 104.17, with the 50-day moving average sitting near 133.59, underscoring how wide the recent trading range has been.[4]
MicroStrategy’s near-term story remains tightly bound to Bitcoin. The company has built one of the world’s largest corporate Bitcoin treasuries, and swings in the cryptocurrency’s price have repeatedly driven sharp moves in the stock.[2] When Bitcoin slipped below the firm’s average purchase price earlier this year, analysts noted that the leverage in MicroStrategy’s balance sheet magnified pressure on the equity, even as long-term bulls framed the pullback as another high-volatility chapter in the crypto cycle.[4]
Policy and index decisions have also mattered. In January 2026, MSCI opted not to remove digital asset treasury companies from key benchmarks, a ruling that avoided potential forced selling and helped MSTR jump 6% in after-hours trading on the announcement.[1] That episode highlighted how index-provider decisions and regulatory tone can quickly change the demand picture for a stock that sits at the intersection of software, Bitcoin and thematic crypto exposure.
On the fundamental side, MicroStrategy continues to lean into its crypto treasury strategy, having added nearly $1 billion of Bitcoin in late 2025 and reinforcing its positioning as a de facto Bitcoin ETF alternative for some equity investors.[2] Wall Street coverage has generally stayed constructive on the long-term thesis, with one group of analysts cited by Forbes in January 2026 highlighting a Buy stance and a price target that reflected a much higher Bitcoin price regime than today’s level.[1]
The chart below situates the latest pullback against the past year of trading and a short-term seasonal projection.
What should traders watch as the next MSTR seasonal window opens?
The next iteration of this 311-day window begins on May 14, giving traders a few weeks to watch how MicroStrategy behaves into the turn. Key levels include the 50-day moving average near 133.59 on the downside and the 200s as a psychological band on the upside, given the stock’s prior acceleration zone around those levels.[4] How MSTR trades around those markers as Bitcoin reacts to macro data and regulatory headlines will help confirm whether the historical midterm-year pattern is reasserting itself or taking a breather this cycle.[4]
Policy and index decisions remain a second pillar to monitor. Any fresh signals from benchmark providers or regulators on the treatment of corporate Bitcoin treasuries could again trigger outsized moves, just as MSCI’s January 2026 decision did when it removed the threat of index-driven selling and sparked a 6% after-hours jump.[1] Add it up: a historically strong midterm-year seasonal window, a stock trading at a steep discount to its 52-week high, and a policy calendar that can flip sentiment quickly give this upcoming MicroStrategy trading window more than the usual amount of attention from volatility-focused traders.
Sources
- Forbes, "MicroStrategy: How MSTR Stock Rises 3x To $450?", Jan 07, 2026
- Yahoo Finance, "Strategy Inc. (MSTR) Bolsters Bitcoin Holdings as Analysts Stay Positive", Dec 29, 2025
- Yahoo Finance, "Michael Saylor’s MicroStrategy plunges on New Year’s Eve", Dec 31, 2025
- Seeking Alpha, "Bitcoin drop puts world's largest crypto treasury firm under pressure (MSTR:NASDAQ)", Feb 02, 2026
About this seasonal analysis
Seasonal pattern data is sourced from TradeWave.ai, which analyzes historical price behavior across annual calendar windows going back up to 30 years. Read the full data methodology or the book The 100-Year Pattern by Afshin Moshrefi (2026 edition). Past performance of seasonal patterns does not guarantee future results. This article is for informational purposes only and does not constitute investment advice.