Invesco (IVZ) Has Dropped in 7 of 7 Midterm Windows as a 28-Day Weak Stretch Opens
Invesco is stepping into a 28-day midterm-election seasonal window that has been consistently weak in past cycles, even as the stock trades just under $25.

What is the seasonal pattern for Invesco (IVZ)?
Invesco has fallen in 7 of 7 midterm-election-year windows starting around Apr 22, with an average loss of 7.88% in those years.
- 7 for 7 in this window, with average losses of 7.88% across the past seven midterm election years.
- The 28-day Invesco trading window begins on Apr 22 and has historically favored short exposure rather than longs.
- Percent Profitable is 100%, with 7 winners and 0 losers for the short-side pattern in this midterm-year slice.
- Average winner losses for the stock reach double digits in several years, including drops of 13.25% in 1998 and 11.75% in 2022.
- The TradeWave Ratio of 2.19 suggests price often travels meaningfully in the trade direction within the window, even before the final close.
- Intraperiod swings have been sharp, with worst-case drawdowns from entry (MAE) reaching as deep as 17.92% in 2022.
According to historical data from TradeWave.ai, this late-April stretch has behaved very differently for Invesco in midterm election years than in a typical month. The next section walks through how that pattern has played out and what it means for the current window.
How has Invesco (IVZ) traded in this midterm-year window?
Invesco has dropped in every single midterm-election-year window starting around Apr 22 across the last seven cycles, averaging losses of 7.88% over 28 trading days. The new window opens today with IVZ at $24.97, up 0.1% on the session and sitting about 15.7% below its 52-week high of $29.61.[1] That combination of a fresh seasonal stretch and a stock already well off its high gives this year’s setup a different feel than some of the prior midterm years where declines started from lower bases.
Because this pattern is grouped by the presidential election cycle, it compares only midterm election years, not a random mix of calendar periods. That matters for a financial stock like Invesco, since midterms often coincide with shifting expectations for regulation, fiscal policy and risk appetite that can hit asset managers in similar ways across cycles.
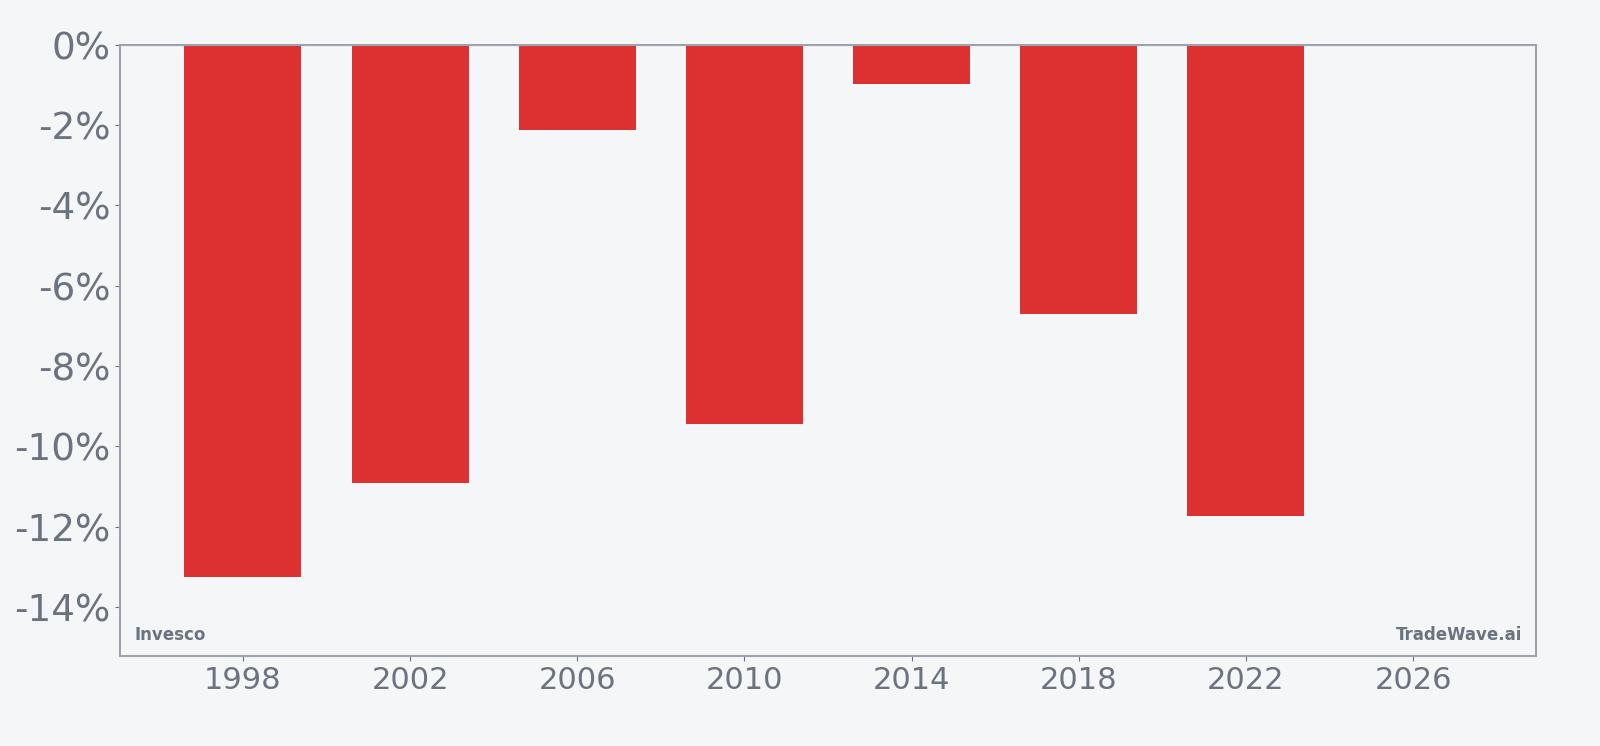
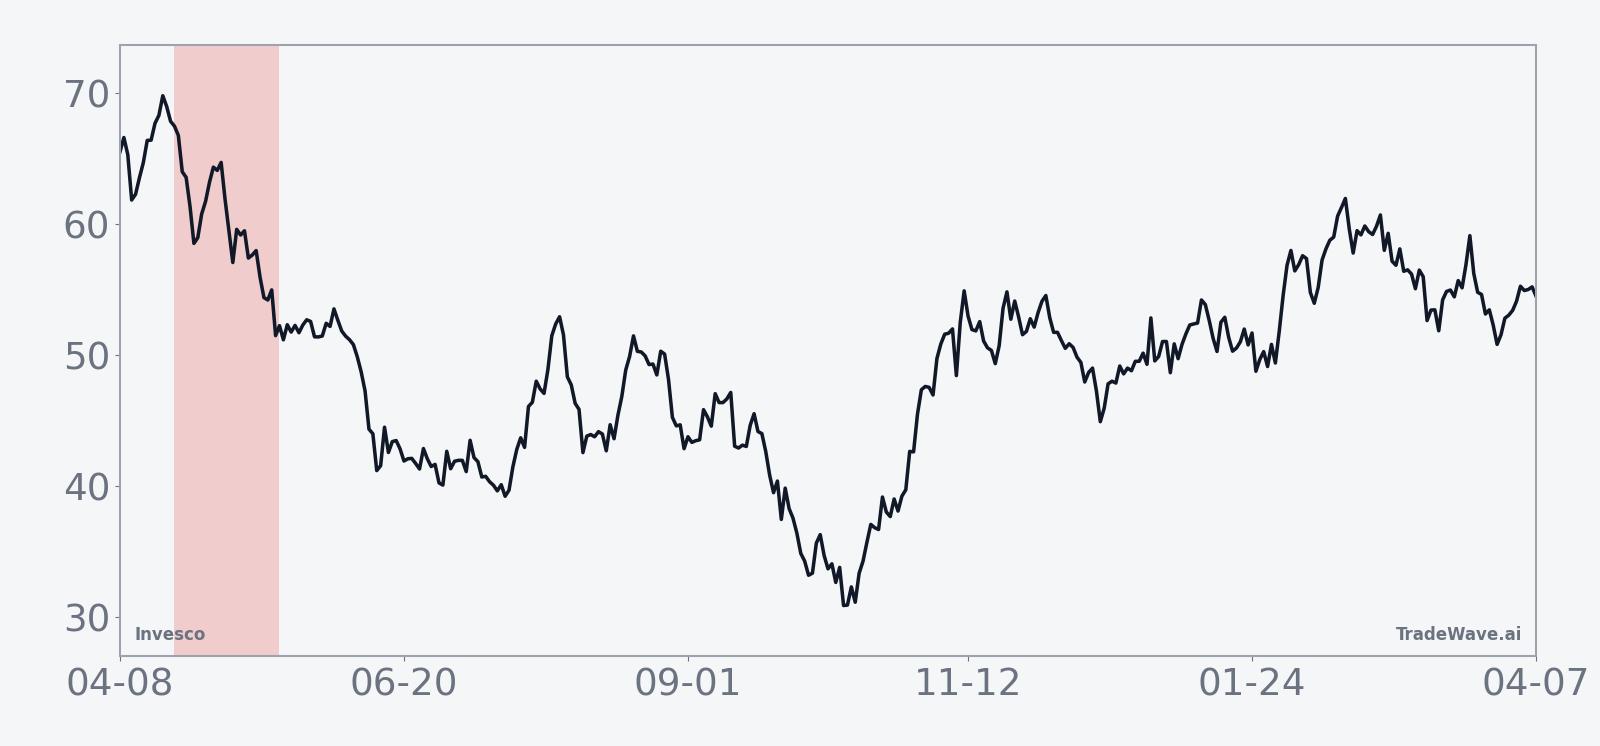
The historical seasonal average shows a fairly steady grind lower across the 28 days rather than a single crash point. For a short-side pattern, that means prior years often rewarded patience, with the stock tending to weaken over the full window instead of delivering all the downside in the first few sessions.
A second view combines net results with the best and worst intraperiod swings to show how far IVZ has tended to move inside the window.
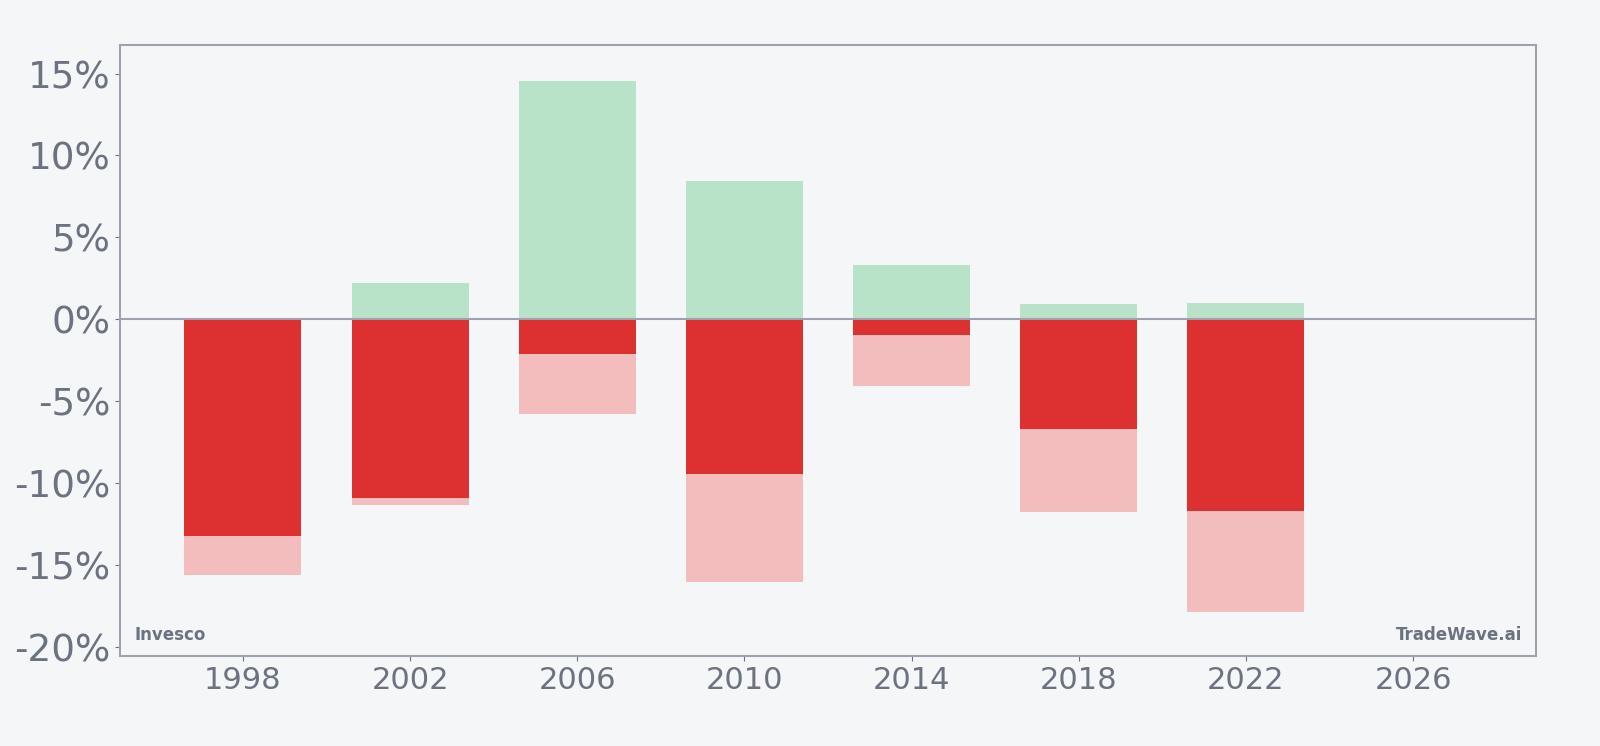
The combined net, best-case and worst-case bars show that even in winning years for the short pattern, Invesco often staged sizable countertrend rallies before rolling over. Maximum favorable moves for shorts, which correspond to the stock’s biggest drops, reached as much as 17.92% in 2022, while adverse moves against shorts, meaning rallies in the stock, ran as high as 14.57% in 2006. Add it up: this has been a consistently negative window for IVZ in midterm years, but one that has demanded a strong stomach for volatility.
History does not guarantee future results; adverse excursions can be large even in windows that have always finished in the trade direction.
Why does Invesco (IVZ) follow this seasonal pattern?
One likely driver is the way midterm election years concentrate policy uncertainty and regulatory debate around financial markets, which can weigh on asset managers as clients reassess risk. Analysts also point to institutional portfolio rebalancing in the second quarter, when investors often trim exposure to fee-sensitive managers after the first leg of the year. For a stock like Invesco that sits at the intersection of equity valuations and flows, those recurring midterm dynamics may help explain why this specific late-April window has leaned consistently negative.
What is driving Invesco (IVZ) today?
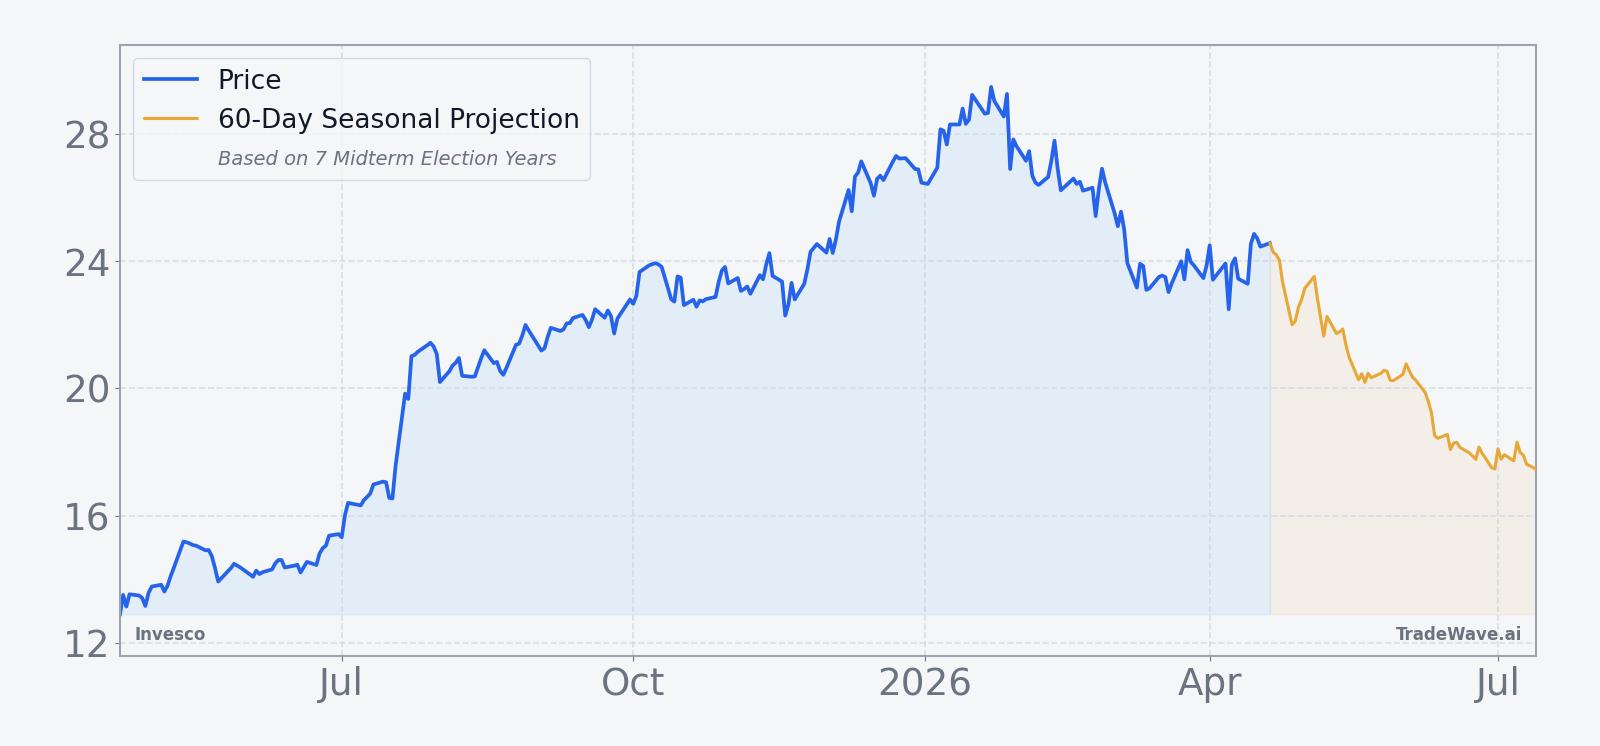
Invesco shares closed at $24.97 on Apr 22, up 0.1% on the day, extending a roughly 7.5% gain over the past month as the stock has climbed away from its 52-week low of about $11.51 and moved closer to its 50-day moving average of $24.74 on solid volume of 4.25 million shares, modestly below the 20-day average of 4.78 million.[1] With no fresh company-specific catalysts or earnings updates on the tape, the move fits a broader grind higher in financials as investors weigh the interest-rate path and risk appetite for active and passive products.
The chart below situates the latest move in its recent multi-month context alongside a 60-day seasonal projection.
What should traders watch in this Invesco seasonal window?
For the next 28 trading days, the key question is whether Invesco repeats its midterm-year habit of drifting lower or breaks the pattern. The first tell will be how the stock behaves around the $25 area, which has acted as a near-term pivot and sits close to the 50-day moving average.[1] A quick rejection from that zone and a move back toward the low $20s would rhyme with prior midterm windows, while a sustained push toward the 52-week high near $29.61 would mark a clear departure from the historical script.
Traders should also keep an eye on volume and volatility. Past midterm windows have featured sharp intraperiod swings, with rallies of more than 10% against the prevailing short-side pattern before the stock ultimately finished lower. If this year’s window sees rising volume on down days and fading interest on bounces, it would fit the historical seasonality. A pattern of strong, high-volume advances instead would signal that the midterm template is breaking down.
Finally, the policy calendar matters. As the midterm election year progresses and investors get more clarity on regulation, taxes and spending, flows into and out of asset managers can shift quickly. If headlines around market structure, fund regulation or retirement policy start to pick up during this window, the reaction in IVZ will offer a real-time test of whether the long-running midterm seasonal trend still has teeth.
Sources
About this seasonal analysis
Seasonal pattern data is sourced from TradeWave.ai, which analyzes historical price behavior across annual calendar windows going back up to 30 years. Read the full data methodology or the book The 100-Year Pattern by Afshin Moshrefi (2026 edition). Past performance of seasonal patterns does not guarantee future results. This article is for informational purposes only and does not constitute investment advice.