6 of 7 Midterm Windows Have Ended With Boyd Gaming (BYD) Sliding for Shorts
Boyd Gaming just stepped into a historically weak midterm-year seasonal window even as the stock trades near its 52-week high, putting a well-worn casino pattern back in play.

What is the seasonal pattern for Boyd Gaming (BYD)?
Boyd Gaming has fallen in 6 of 7 midterm-election-year windows starting around Apr 25, with an average 15.5% gain in winning short years.
- 6 winners and 1 loser for short trades in this 184-day window, with 86% of years profitable for the short side.
- Avg Profit for winning short years is 15.5%, while Avg Profit - All years, including the lone loser, is 16%.
- The current pattern window begins Apr 25 and runs roughly six months, covering the last 7 midterm election years.
- Trade Direction is short, so negative returns in prior years reflect favorable outcomes for this BYD seasonal trend.
- A TradeWave Ratio of 1.65 suggests price has typically traveled meaningfully in the trade direction within the window.
- Intraperiod swings have been sizable, with both strong favorable moves and deep drawdowns showing this is a high-volatility Boyd Gaming trading window.
According to historical data from TradeWave.ai, this midterm-election-year stretch in Boyd Gaming has behaved very differently from an average half-year on the calendar, and the latest iteration has just begun.
How does Boyd Gaming (BYD) usually trade in this midterm-year window?
Boyd Gaming has delivered profitable short trades in 6 of the last 7 midterm-election-year windows that start around Apr 25 and run for 184 trading days, with average winning years returning 15.5% for the short side. Shares finished Monday at 87.53, flat on the day and about 2.7% below the 52-week high of 89.96, leaving the stock near the top of its recent range as this historically weak stretch gets underway.
The pattern is grouped by the presidential election cycle, focusing only on midterm election years rather than consecutive calendar years. That matters because policy uncertainty, rate paths and fiscal debates often cluster in similar ways at this point in the four-year cycle, and casino operators like Boyd Gaming can feel those shifts in discretionary spending and regional gaming demand.
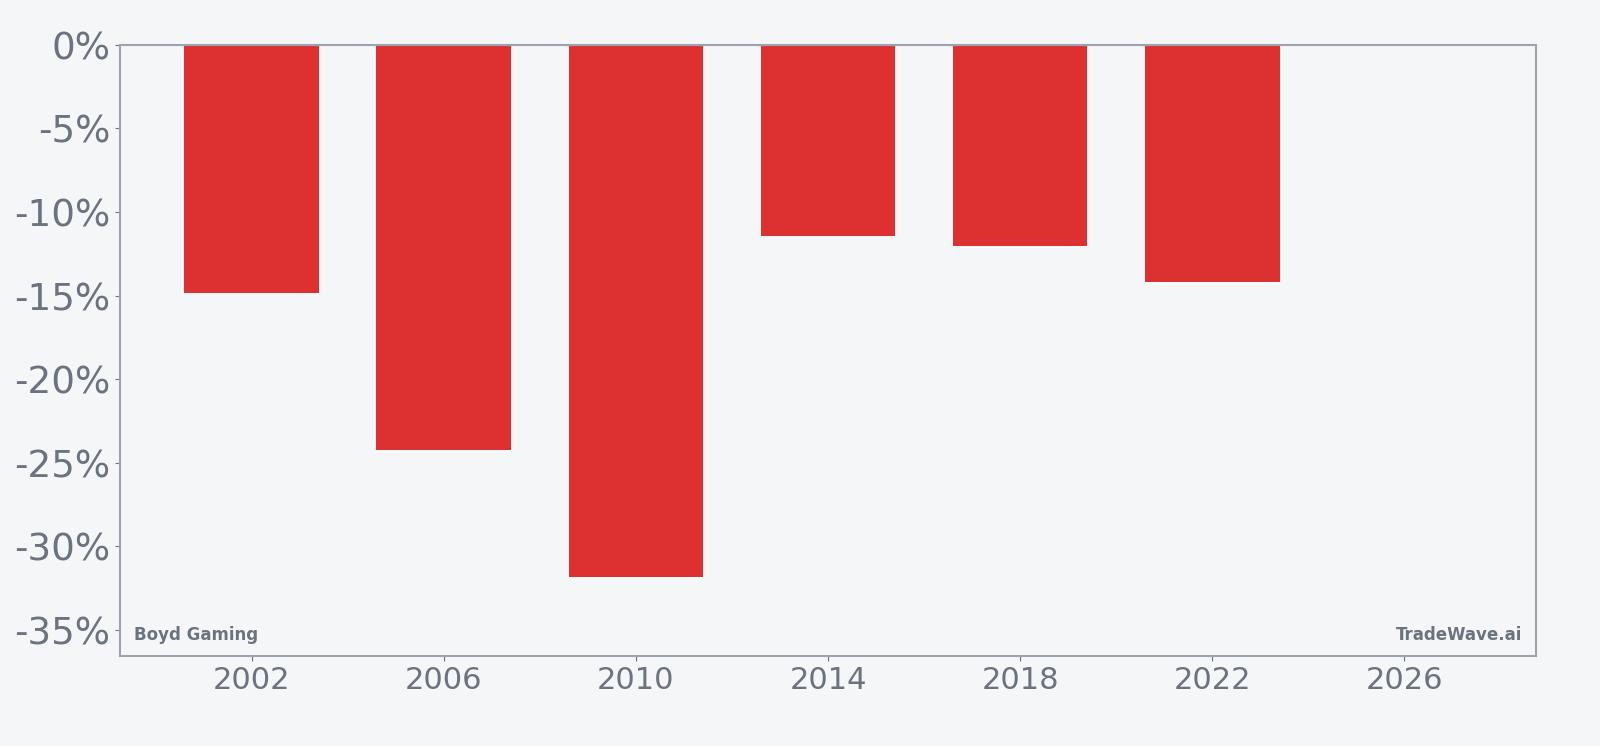
Trade Direction for this setup is short, so the negative net returns in prior windows represent favorable outcomes for the strategy. Percent Profitable sits at 86%, with 6 winning short years and just 1 losing year across the sample. Avg Profit of 15.5% reflects only those winning short years, while Avg Profit - All of 16% folds in the lone losing year and still leaves the overall record skewed toward sizable downside moves in BYD during this stretch.
The per-year breakdown shows how consistent that bias has been. In 2006, a short entered around this window would have finished the period with a 24.23% gain as the stock slid from 47.57 to 36.04. In 2010, the short side saw its strongest outcome, with a 31.81% net return as Boyd Gaming dropped from 11.50 to 7.84 over the 184 trading days. Even the softer years, such as 2014 and 2018, still produced double-digit percentage declines that lined up with the historical BYD seasonal trend.
Intraperiod swings have been large. Maximum favorable moves, the best point-to-peak gains for the short side within each window, have reached as high as 21.14% in 2002 and 20.83% in 2010. At the same time, maximum adverse moves, the worst drawdowns against the short, have stretched to 45.48% in 2010 and 37.15% in 2006, showing that even winning years often forced shorts to sit through sharp rallies before the pattern reasserted itself.
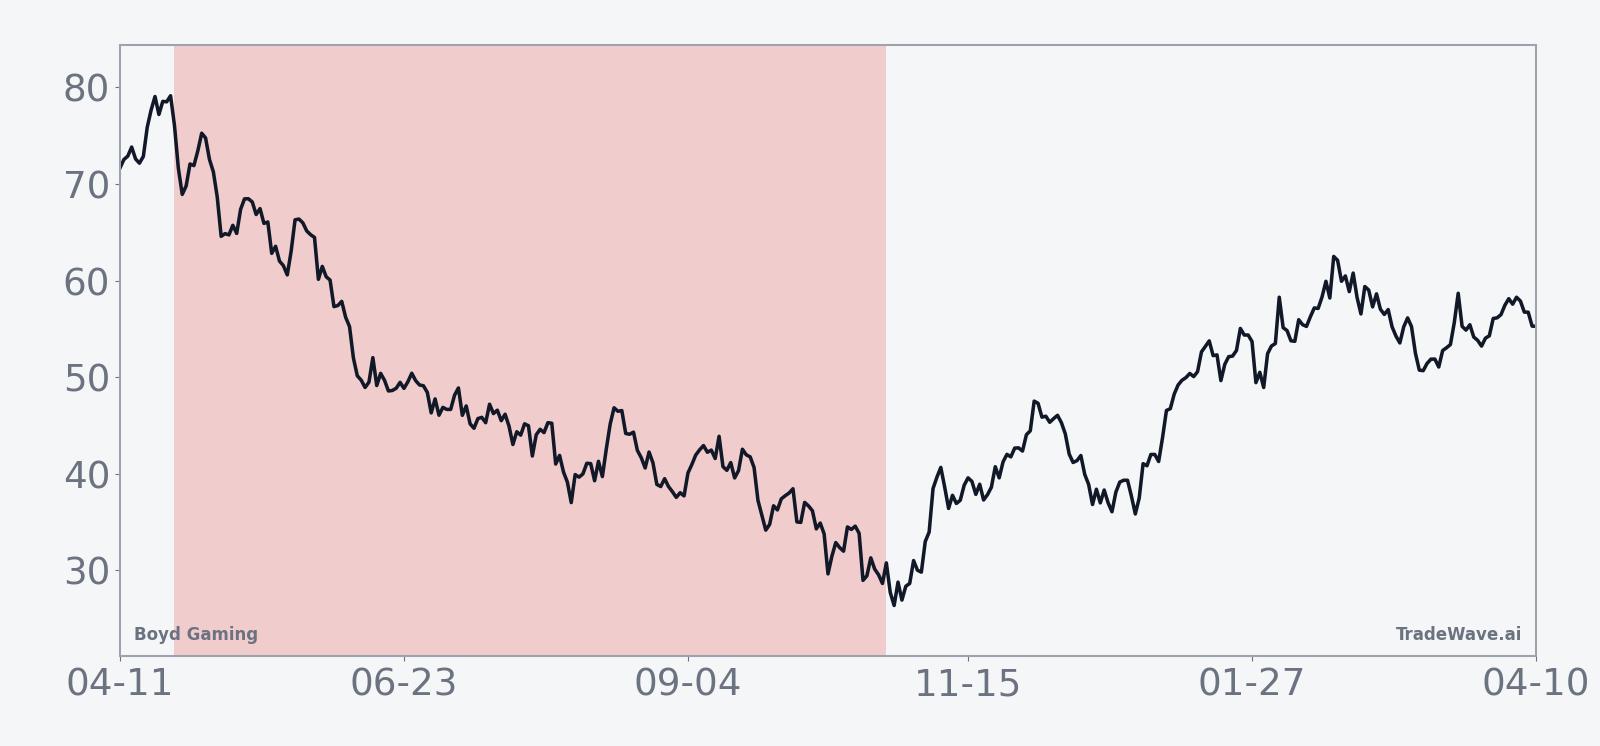
The historical seasonal trend chart for this window shows a tendency for pressure on Boyd Gaming to build gradually rather than in a single air pocket. Returns for the short side often improve as the window progresses, with several years showing choppy early action followed by more persistent downside later in the period. That fits a profile where macro or policy headlines accumulate over the midterm year and eventually weigh on gaming and leisure names.
A second view that layers net results with best and worst intraperiod swings shows how far Boyd Gaming has tended to travel in both directions during this stretch.
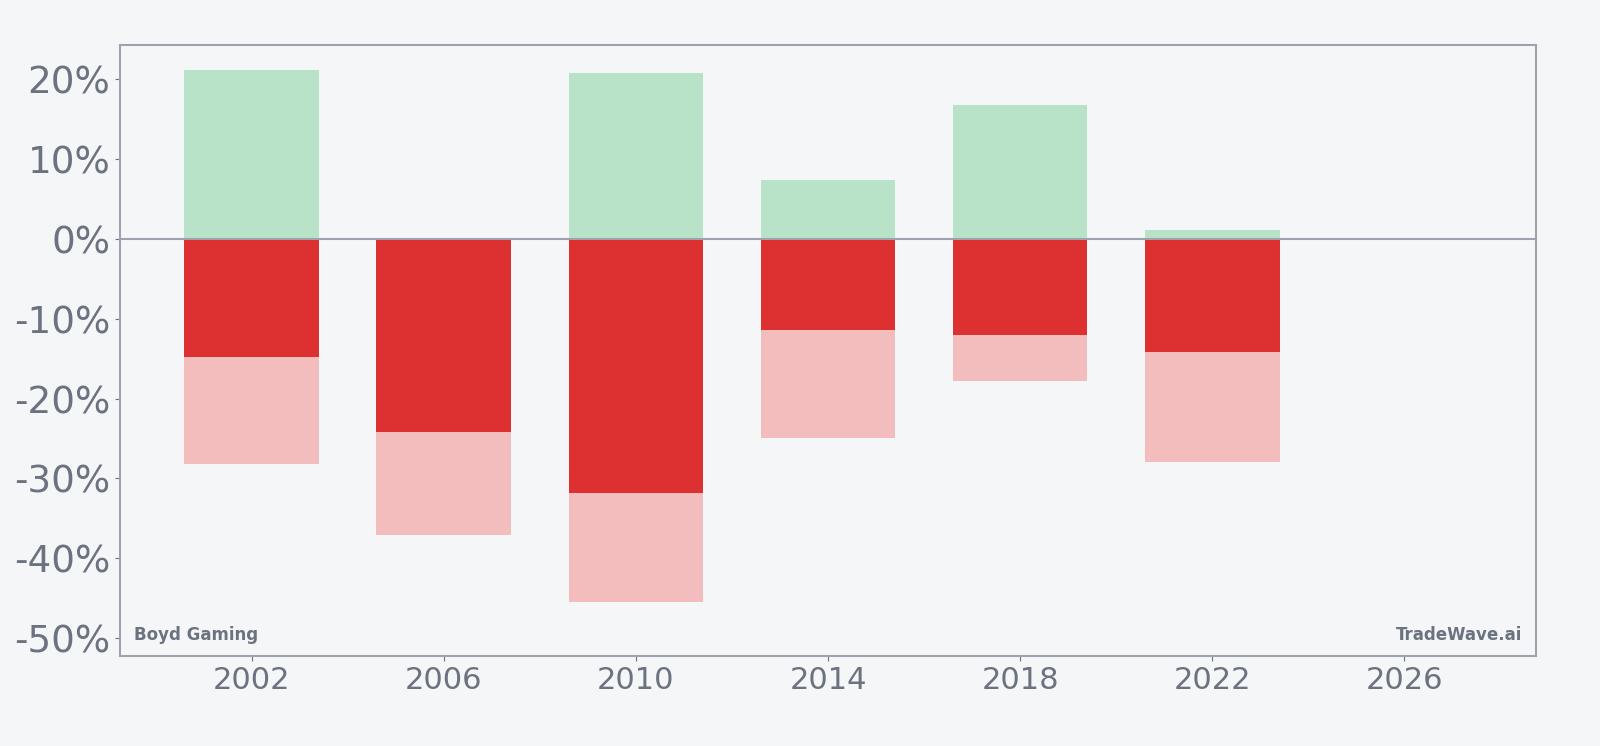
History does not guarantee future results; adverse excursions (MAE) can be large even in winning windows.
Why does Boyd Gaming (BYD) follow this seasonal pattern?
One likely driver is the way midterm election years concentrate policy and rate uncertainty in the middle of the cycle, which can hit discretionary spending and regional gaming demand at the same time. Analysts often point to earnings season timing and budget debates in Washington that land in this part of the year, creating a tougher backdrop for casino operators that rely on steady consumer confidence. This Boyd Gaming seasonal pattern may also reflect institutional portfolio repositioning around midterm-year volatility, with investors trimming cyclical leisure exposure as macro risk builds.
What is driving Boyd Gaming (BYD) today?
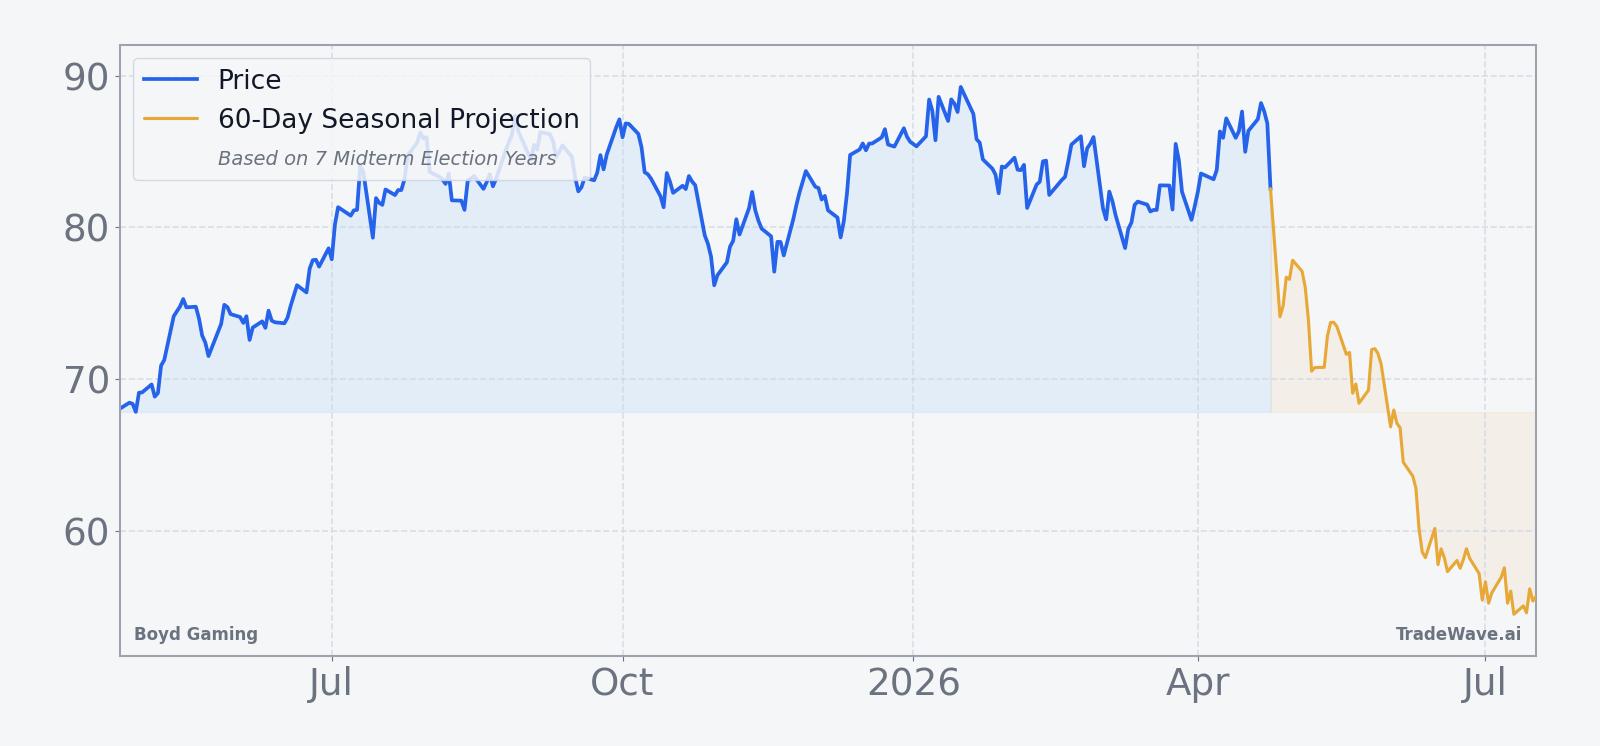
Boyd Gaming closed Monday at 87.53 on the US market, unchanged on the session after trading between 83.77 and 87.74 on volume of about 1.3 million shares, versus a 20-day average near 796,000. That leaves the stock roughly 2.7% below its 52-week high of 89.96 and well above its 50-day moving average of 83.90, a setup that keeps the tape firmly in an uptrend even as the historical midterm-year seasonal window has just turned negative for the short side.
The chart below situates the latest move in its recent multi-month context alongside a short-term seasonal projection.
What should traders watch in this Boyd Gaming seasonal window?
First, the key reference is the 52-week high near 89.96. If Boyd Gaming pushes decisively through that level and holds above it while this midterm-year window is active, it would mark a clear break from the historical pattern that has usually favored the short side. A failure to sustain new highs, especially if rallies fade on rising volume, would be more in line with the past six winning short years.
Second, intraperiod swings matter as much as the final outcome. Prior windows have seen maximum adverse moves against the short side reach into the 30% to 45% range, so even a seasonally weak stretch has not been a straight line. Traders watching this BYD seasonal trend will want to track whether any sharp upside spikes resemble those earlier drawdowns or instead signal a regime change where buyers stay in control.
Third, the policy and macro calendar for the midterm election year will be important. Budget negotiations, rate expectations and consumer-spending data can all shift sentiment toward regional casinos, and the historical seasonality suggests that when those forces line up, Boyd Gaming has often trended lower over this half-year window. If macro data stay resilient and policy risk remains contained, that would be a key test of whether this long-running pattern still carries weight.
Finally, price behavior relative to the 50-day moving average around 83.90 offers a simple gauge. In prior midterm-year windows, sustained breaks below intermediate support have often coincided with the stronger short outcomes. Holding above that band, or quickly reclaiming it after any dips, would argue that this cycle may diverge from the 6-for-7 record that has defined Boyd Gaming’s midterm-year seasonal outlook so far.
Sources
About this seasonal analysis
Seasonal pattern data is sourced from TradeWave.ai, which analyzes historical price behavior across annual calendar windows going back up to 30 years. Read the full data methodology or the book The 100-Year Pattern by Afshin Moshrefi (2026 edition). Past performance of seasonal patterns does not guarantee future results. This article is for informational purposes only and does not constitute investment advice.