Procter & Gamble (PG) Has Rallied in 10 of 10 Midterm Windows Starting May 25
Procter & Gamble is approaching a midterm-election-year seasonal window that has never lost in the last 10 cycles, just as shares trade below their 52-week high and management leans on pricing to offset higher costs.
What is the seasonal pattern for Procter & Gamble (PG)?
Procter & Gamble has risen in 10 of 10 midterm-election-year windows starting around May 25, with an average gain of 11.7% in winning years.
- 10 for 10 in this window, with Procter & Gamble averaging 11.7% gains across all winning years.
- The upcoming seasonal window begins May 25, 2026 and runs for 213 trading days, covering late spring through much of the following year.
- Percent Profitable is 100%, with 10 winners and 0 losers across the last 10 midterm election years.
- Average profit in winning years is 11.7%, with a median gain of 12.96% and cumulative return of 198% across the sample.
- Intraperiod swings have been meaningful, with some years seeing double-digit drawdowns even as the window ultimately finished higher.
- The pattern aligns with the midterm-to-pre-election phase of the presidential cycle, when consumer staples have often attracted defensive inflows.
According to historical data from TradeWave.ai, this midterm-election-year stretch has behaved very differently from an average calendar period for PG. TradeWave.ai’s historical database shows a distinct long-biased seasonal regime that turns on again in late May.
How has Procter & Gamble (PG) traded in this midterm-year window?
Procter & Gamble has posted gains in every one of the last 10 midterm-election-year windows starting around May 25, averaging 11.7% returns over 213 trading days. Shares finished Friday at 148.18, up 1.7% on the day and about 11.4% below the 52-week high of 167.25.[1] That combination of a strong historical seasonal trend and a stock trading off its highs is drawing fresh attention to PG’s late-spring setup.
The presidential election cycle matters here because this pattern is built only from midterm election years, a phase that has often seen investors rotate toward defensive, cash-generative names as policy uncertainty and geopolitical noise pick up. PG sits squarely in that consumer-staples bucket, so its midterm-year seasonal behavior can look very different from its performance in election or pre-election years.
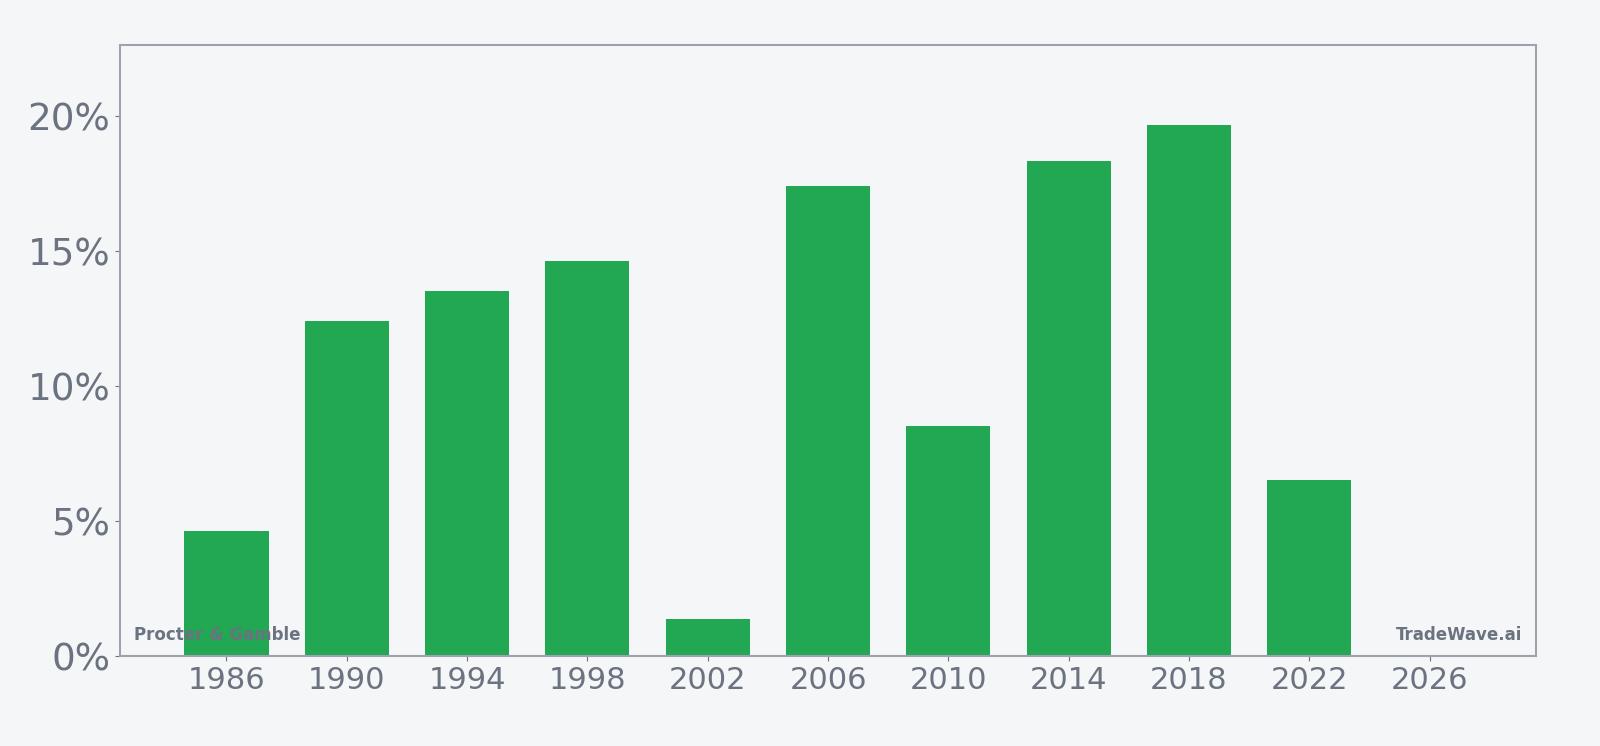
Across the 10 midterm-election-year samples, the trade direction is long and the record is clean: 10 winners, 0 losers, with a cumulative gain of 198%. Average profit of 11.7% and a median gain of 12.96% suggest the typical outcome has been a double-digit advance rather than a marginal drift higher. The Sharpe ratio of 1.51 points to a relatively strong risk-adjusted profile based on end-of-window results, even though the path inside the window has not always been smooth.
Looking at individual years, the weakest outcome was 2002, when PG still finished the window up 1.38% but endured a worst intraperiod drawdown of 14.74% from the entry. On the other side of the spectrum, 2018 delivered a 19.68% net gain with a maximum favorable move of 32.75%, showing how powerful the upside can be when the pattern lines up with broader flows into staples. Add it up: 198% cumulative gains across ten midterm-year windows is a rare record for a mega-cap consumer stock.
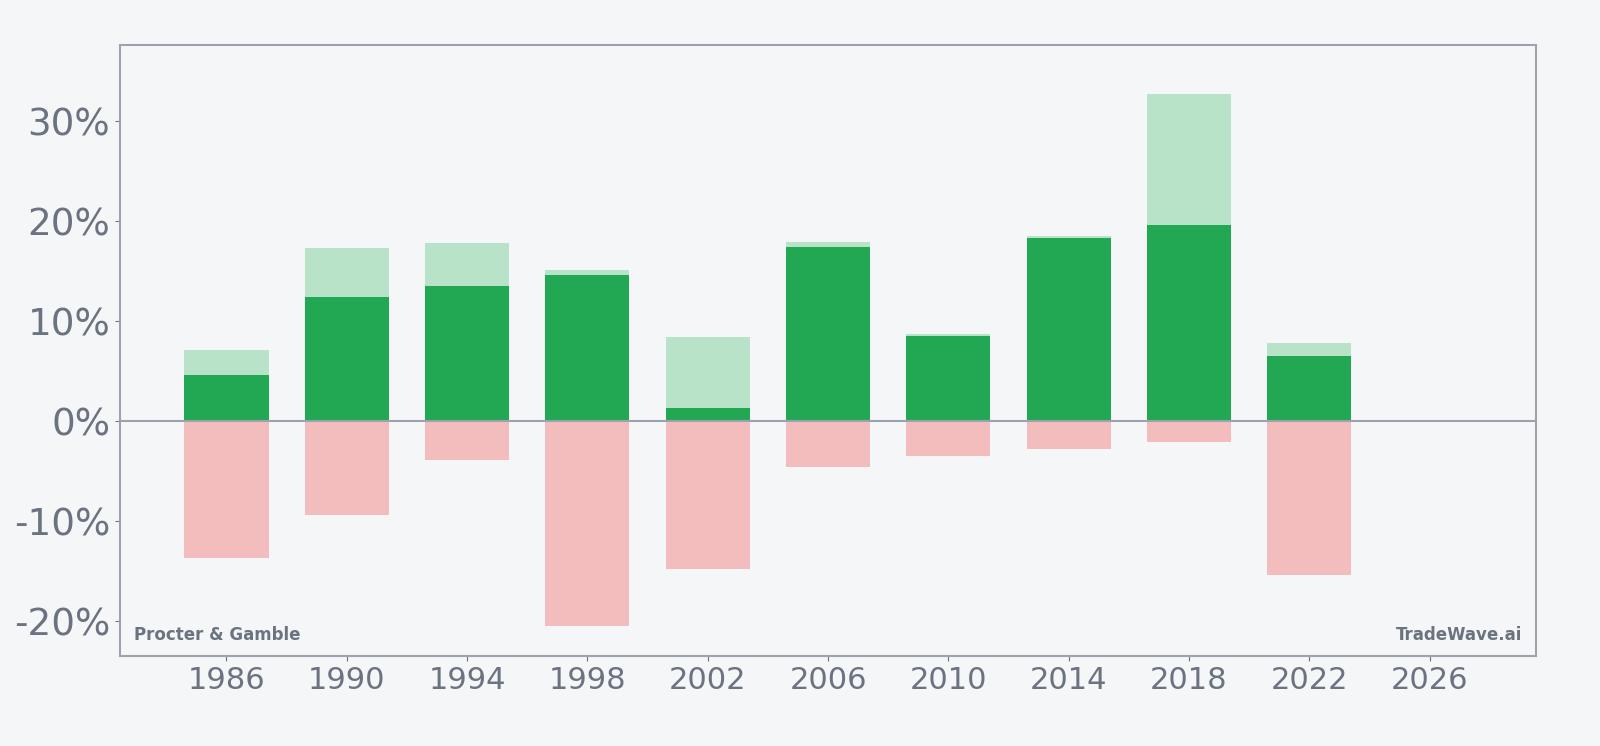
The MFE and MAE profile underlines that this has been a “grind higher with pockets of pain” type of window. Several years, including 1986, 1998 and 2022, saw double-digit adverse excursions at some point, even though the final result was positive. That means traders who lean on this PG seasonal trend have historically needed to tolerate sizable drawdowns inside the 213-day stretch, particularly when macro shocks or rate scares hit the broader market.
Trend metrics from the pattern suggest the return profile tends to build over time rather than spike early and fade. The longer-term trend count skews to the long side, while the shorter-term trend markers show more choppiness in the first part of the window before gains consolidate later. In plain English, prior midterm-year windows often started with noise and only revealed their full upside edge as the calendar moved closer to the pre-election year.
A second view shows how yearly net returns line up with their best and worst intraperiod swings.
History does not guarantee future results; even in a 10-for-10 window, the worst intraperiod drawdowns have been large enough to challenge conviction.
Why does Procter & Gamble (PG) follow this seasonal pattern?
One likely driver is the way the presidential election cycle shapes investor appetite for defensive cash flows, with midterm years often pushing money toward staples as policy and geopolitical risks rise. Analysts have also pointed to portfolio rebalancing around fiscal year-ends and year-ahead guidance, which can favor steady dividend payers like PG in the back half of the midterm year. The pattern may also reflect consumer spending cycles, as PG’s mix in beauty, grooming and household products tends to benefit from holiday and back-to-school demand that falls squarely inside this 213-day window.
What is driving Procter & Gamble (PG) today?
PG closed at 148.18 on Apr 24, up 1.7% on the session, leaving the stock about 11.4% below its 52-week high of 167.25 and modestly above its 52-week low of roughly 135.69.[1] The move followed fiscal third-quarter results in which Procter & Gamble beat earnings and sales expectations, helped by 7% headline sales growth and 3% organic growth, even as higher oil prices tied to the Iran war pressured margins.[1][3] Management reaffirmed full-year guidance for 0% to 4% organic sales growth and EPS of $6.83 to $7.09, signaling confidence that pricing and mix can offset cost inflation.[1][3]
Those numbers extend a mixed but resilient run of results. In January 2026, PG again topped earnings estimates but reported softer volumes in categories like Gillette razors and Pampers diapers as consumers traded down or stretched purchases.[2] In October 2025, the company highlighted strong demand in beauty and grooming, which helped offset a broader consumer spending slowdown and kept profit ahead of expectations.[4] The through-line is that PG has been leaning on price increases and premium segments to defend margins while navigating uneven demand across its portfolio.
Macro and policy forces are part of the story. Higher oil prices linked to the Iran conflict have raised input and transportation costs, squeezing margins for consumer goods makers like PG.[1] At the same time, U.S. tariff policies have pushed the company to hike prices on some products, a strategy that protects profitability but risks further demand softness if shoppers push back.[5][6] Against that backdrop, PG’s role as a defensive staple in major indices keeps it in focus for investors looking to balance growth exposure with steady cash generation.
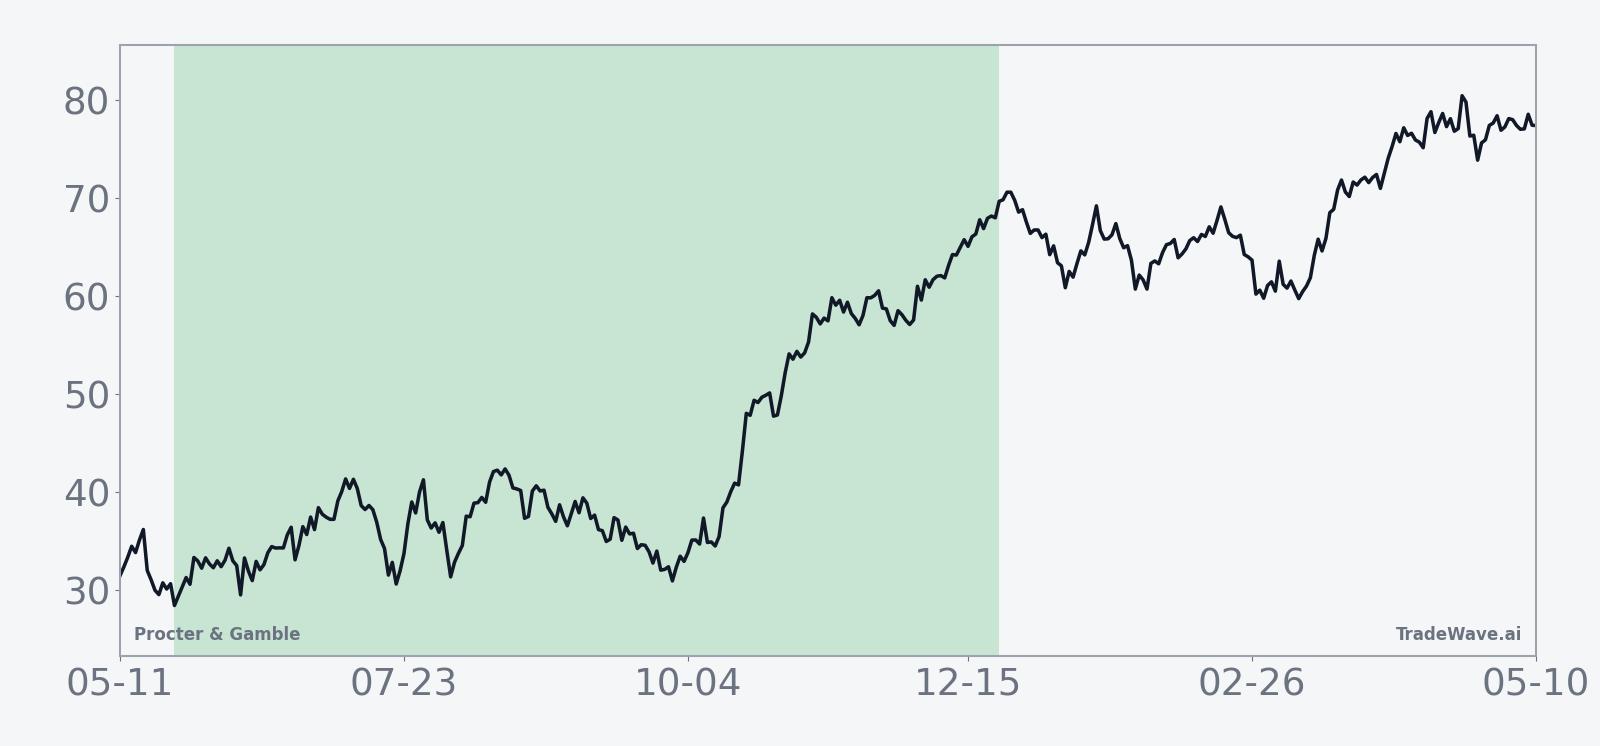
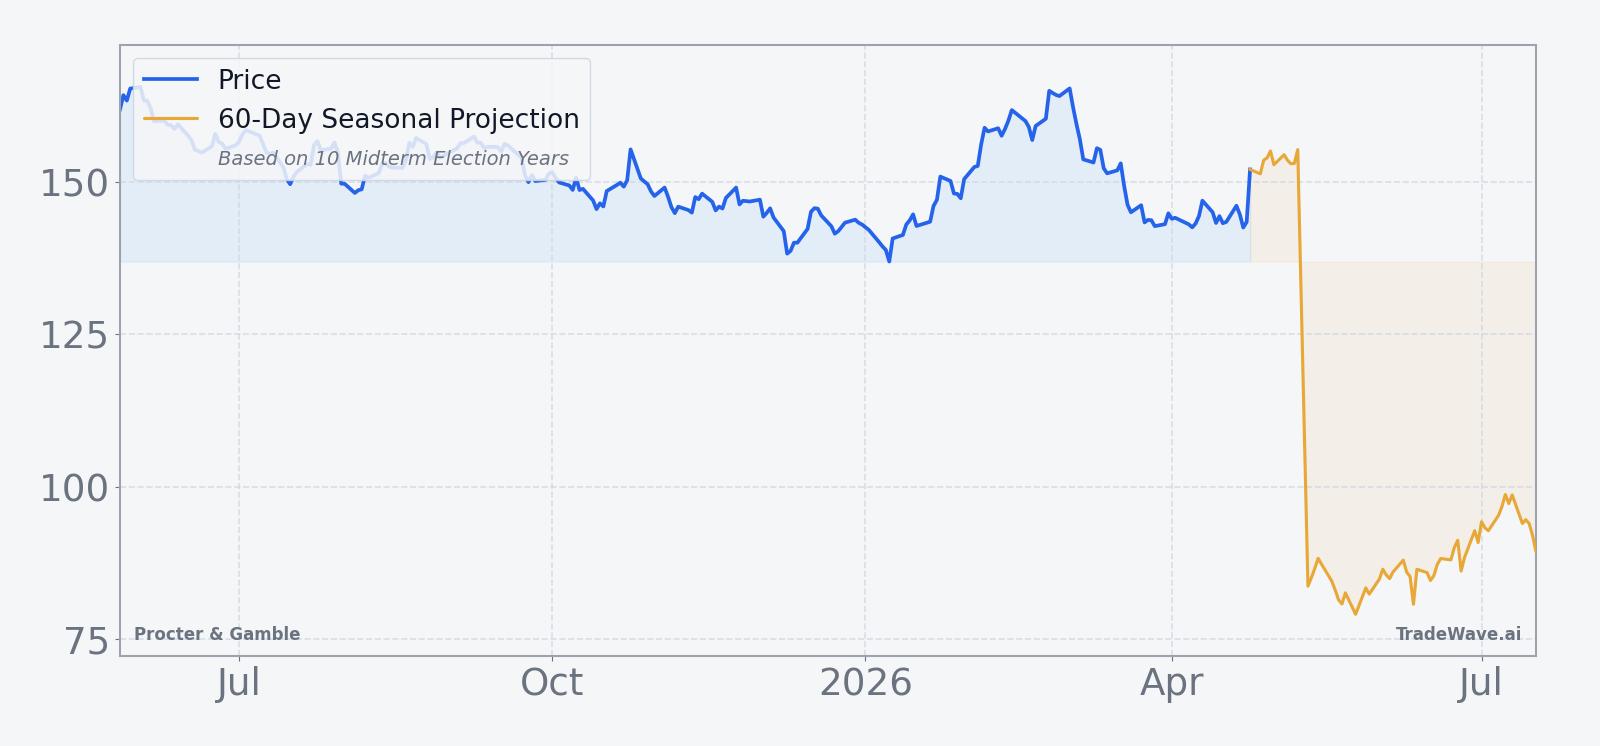
The chart below situates the latest move against PG’s past year of trading and a short-term seasonal projection.
What should traders watch as this PG seasonal window approaches?
First, the calendar: the 213-day midterm-year window kicks off on May 25, so the next month is about positioning rather than execution. Traders watching this PG seasonal trend will be looking to see whether the stock continues to base below its 52-week high or starts to break out ahead of the window, which would echo prior cycles where strength built gradually rather than in a single burst.
Second, margins and pricing power will be critical. Any further escalation in oil prices or tariffs that forces PG to push through additional price hikes could test consumer tolerance and volume trends, especially in more discretionary categories.[1][5][6] If the company can hold or expand margins without a sharp hit to volumes, that would align with the stronger historical years in this pattern, when fundamentals and seasonality pulled in the same direction.
Third, watch the broader policy and macro backdrop as the midterm election year unfolds. Historically, this phase has seen bouts of volatility around fiscal debates and geopolitical headlines, which often send investors back toward staples and other defensive sectors. If that playbook repeats, PG could again benefit from rotation flows that have historically supported the stock during this specific midterm-to-pre-election stretch.
Finally, behavior inside the window will matter as much as the end result. In prior cycles, some of the best eventual years still saw double-digit drawdowns along the way, so traders may track whether any pullbacks stay within the historical MAE range or break below it. A pattern of shallow, bought dips would be more consistent with the 10-for-10 record, while a deeper, persistent slide would be an early sign that this midterm-year PG seasonal trend is starting to behave differently from the past.
Sources
- Yahoo Finance: Tide maker P&G beats earnings estimates as Iran war drives up costs (Apr 24, 2026)
- CNBC: Procter & Gamble earnings top estimates, but shrinking demand weighs on sales (Jan 22, 2026)
- CNBC: Procter & Gamble earnings beat estimates as sales grow 7% (Apr 24, 2026)
- Reuters: P&G latest to flag diverging consumer spending as profit tops on beauty demand (Oct 24, 2025)
- Reuters: Procter & Gamble hikes US prices amid tariff challenges, CEO change (Jul 29, 2025)
- Reuters: Procter & Gamble hikes US prices to blunt tariff hit as CEO transition looms (Jul 29, 2025)
About this seasonal analysis
Seasonal pattern data is sourced from TradeWave.ai, which analyzes historical price behavior across annual calendar windows going back up to 30 years. Read the full data methodology or the book The 100-Year Pattern by Afshin Moshrefi (2026 edition). Past performance of seasonal patterns does not guarantee future results. This article is for informational purposes only and does not constitute investment advice.