Record Auto and IoT Revenue Can't Offset Qualcomm (QCOM) Tariff and Seasonal Weakness
Qualcomm is approaching a short midterm-election-year seasonal window that has often leaned lower, just as the stock trades well below its 52-week high and investors weigh AI growth against tariff and handset risks.

What is the seasonal pattern for Qualcomm (QCOM)?
Qualcomm has fallen in 5 of 8 midterm-election-year iterations of this late-May 22-day window, with an average 4.91% gain in winning years for the short setup.
- 5 winners vs 3 losers for the short side in this window, with winning years averaging 4.91% moves in the trade direction.
- The upcoming Qualcomm trading window starts on May 25, 2026 and runs for 22 trading days across the last 8 midterm election years.
- Percent Profitable for the short pattern is 62%, with 5 winning shorts and 3 losing shorts across the sample.
- Average outcome across all years is a 3% gain for the short strategy, showing that losing years have been relatively contained.
- Individual years have seen sharp intraperiod swings, with maximum favorable moves above 12% and adverse excursions deeper than 13% in some cycles.
- The pattern aligns with a midterm-year semiconductor seasonal outlook where policy and handset demand jitters often collide with positioning around summer.
According to historical data from TradeWave.ai, this late-May stretch has behaved differently from a typical month for Qualcomm, and the next iteration is only weeks away.
How has Qualcomm (QCOM) traded in this late-May midterm-year window?
Starting May 25, Qualcomm enters a 22-day midterm-election-year window that has historically favored the short side, with 5 winning shorts and 3 losing shorts across the last eight cycles. Today the stock closed at $150.26, up 0.95% on the session and sitting about 25.3% below its 52-week high of $201.27, after a strong 18.21% gain over the past month.[1]
The pattern is grouped by the presidential election cycle, focusing on the last eight midterm election years rather than consecutive calendar years. That matters because midterm years often bring policy uncertainty, tariff headlines and regulatory noise that hit large-cap semiconductors differently than in the calmer pre-election year that follows.
Historically, this Qualcomm seasonal trend has been a modest but consistent tailwind for short positions. Percent Profitable sits at 62%, with 5 winning shorts and 3 losing shorts, and the average gain in winning years is 4.91% for the short side. When you include every year, winners and losers together, the average outcome is a 3% gain for shorts, which suggests that losing years have not fully erased the gains from the stronger down cycles.
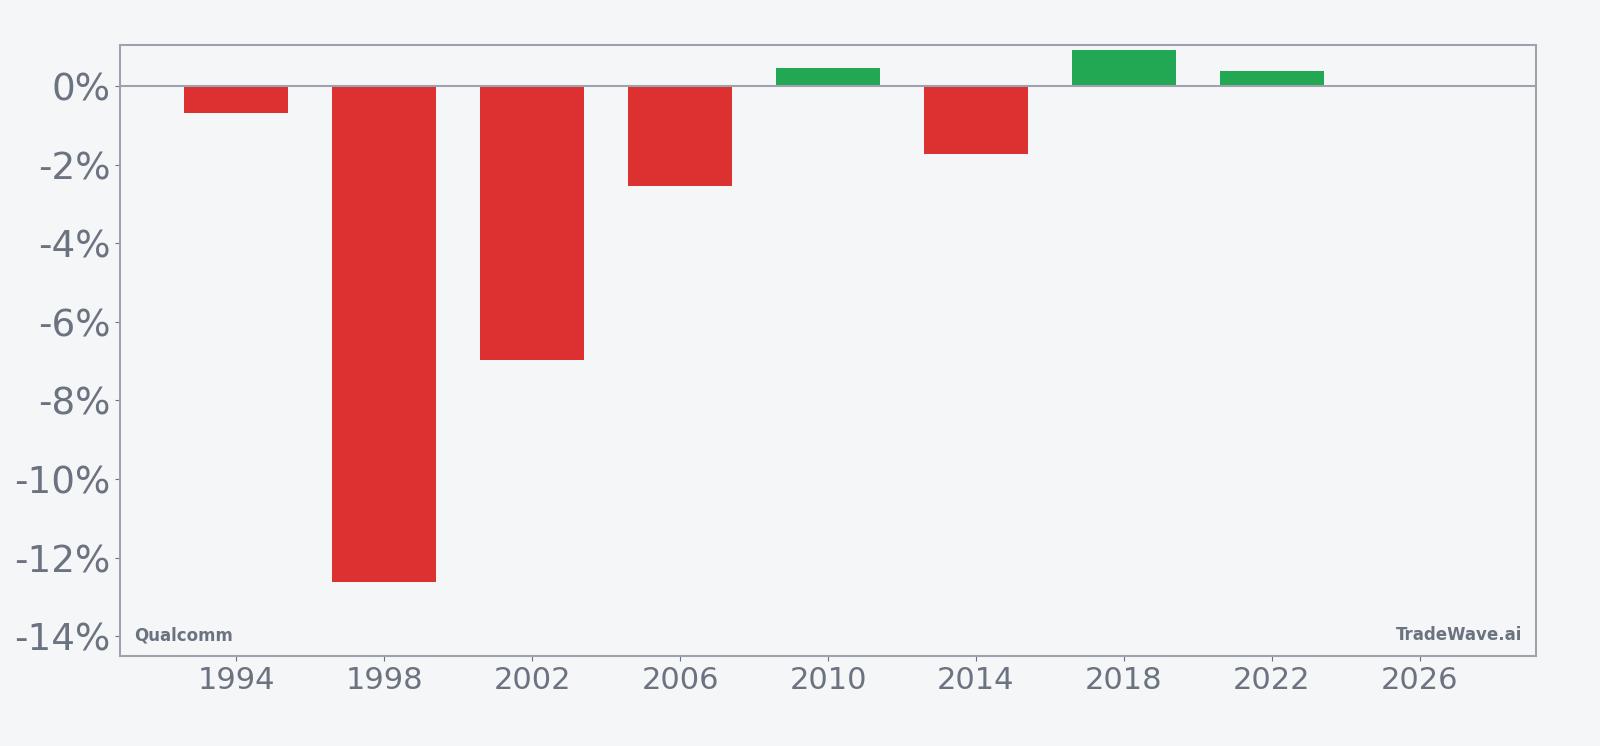
The per-year table shows how uneven those years have been. In 1998, the short pattern delivered a 12.62% gain for bears, one of the strongest outcomes in the sample, while 2002 also produced a sizable 6.97% move in favor of shorts. On the other side, 2010 and 2018 were mild losing years for the pattern, with net returns of 0.45% and 0.91% against the short, reminding traders that this Qualcomm trading window is not a one-way bet.
The historical seasonal average suggests that most of the move in this 22-day Qualcomm seasonal pattern tends to accrue in the middle of the window rather than at the open or close. Early days often look choppy, followed by a more directional drift that has usually favored lower prices for the stock before stabilizing into the end of the stretch.
Stacked net, best-case and worst-case moves show how far Qualcomm has swung inside this window, even when the final result looked modest.
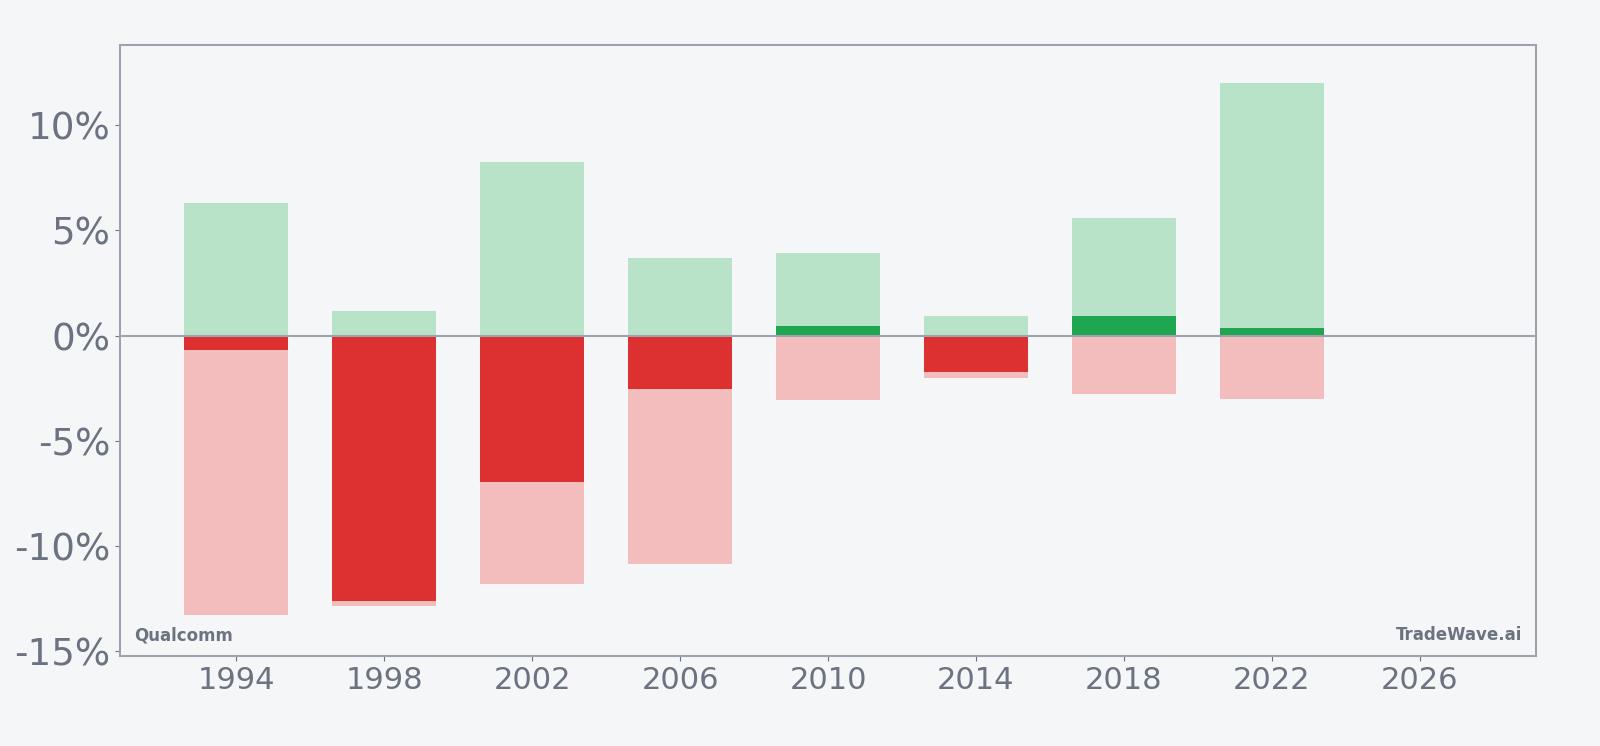
The MFE/MAE profile is where this QCOM seasonal trend gets more interesting. In 2022, for example, the maximum favorable move for shorts reached 12.03% at one point, while the worst adverse move in 1994 was a 13.28% squeeze against the short before the window closed only slightly in favor of bears. That mix of double-digit peak run-ups and drawdowns, combined with a TradeWave Ratio of 1.41, signals that price often travels meaningfully in the trade direction at some point, but the path can be rough.
Put together, the record is not overwhelming but it is clear: this late-May midterm-year Qualcomm window has leaned bearish for the stock, with more winning shorts than losers and a tendency for sizable intraperiod swings that can reward well-timed entries and punish late ones.
History does not guarantee future results; adverse excursions (MAE) can be large even in winning windows.
Why does Qualcomm (QCOM) follow this seasonal pattern?
One likely driver is the way midterm-year policy noise and tariff debates intersect with Qualcomm’s handset and modem exposure, often creating headline risk into early summer.[6] Analysts have also pointed to institutional portfolio rebalancing around fiscal midpoints, which can hit large-cap semiconductors after strong runs in AI or smartphone demand.[1] This late-May Qualcomm seasonal pattern may reflect that mix of macro uncertainty and positioning clean-up before the typically stronger pre-election year that follows.
What is driving Qualcomm (QCOM) today?
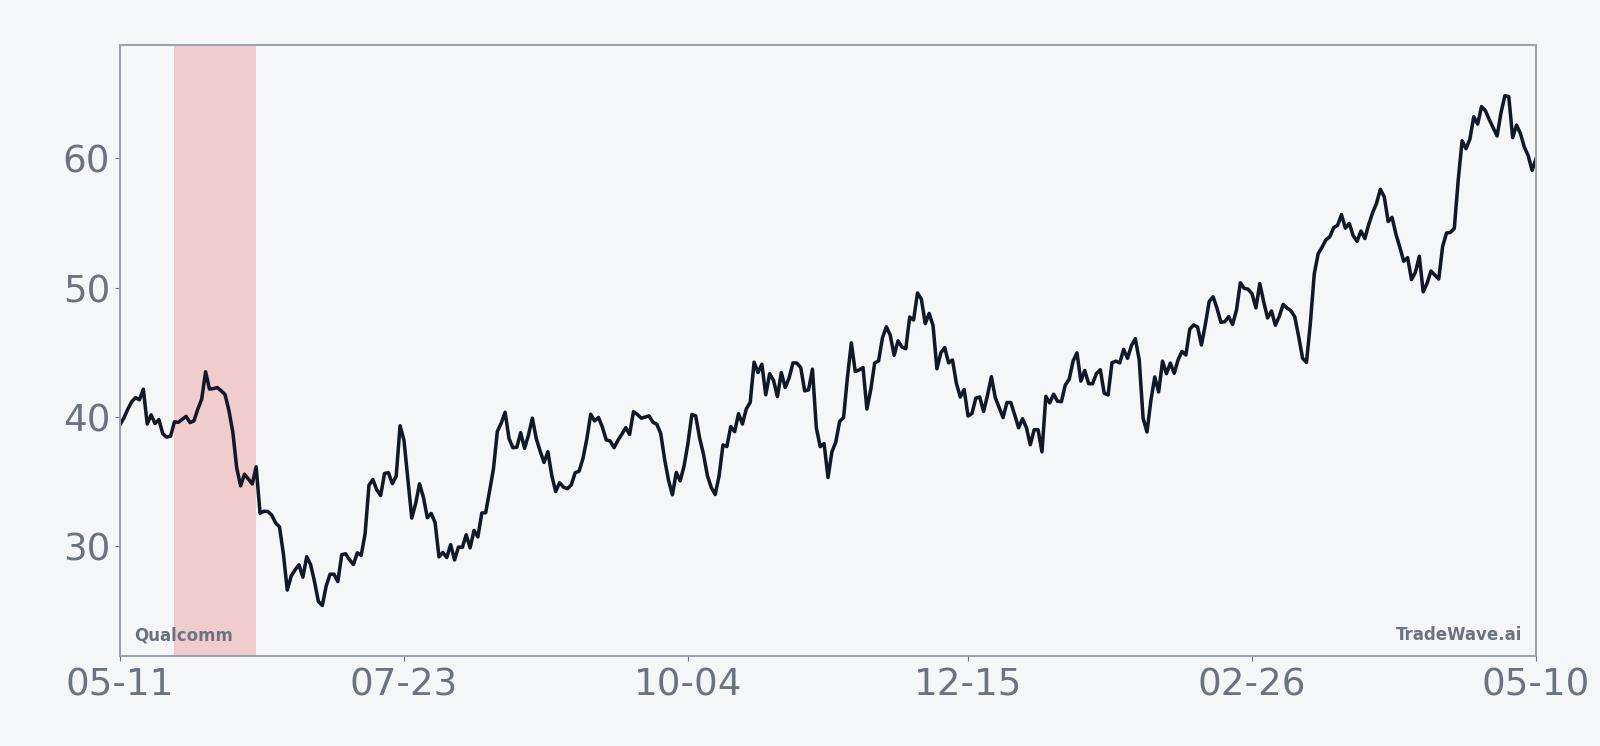
Qualcomm shares finished Tuesday at $150.26, up 0.95% on the day, after a volatile session that saw the stock trade between $147.05 and $161.00 on volume more than three times its 20-day average of about 12.1 million shares.[1] The stock is still about 25.3% below its 52-week high of $201.27 and sits comfortably above its 52-week low of $121.99, with the 50-day moving average down at $134.33, underscoring how sharp the past month’s 18.21% rebound has been.[1]
That bounce has been fueled in part by optimism around Qualcomm’s push beyond smartphones. On Mar 16, 2026, a Forbes analysis highlighted record revenue in automotive and IoT, with automotive sales topping $1.1 billion as carmakers and industrial customers adopted Snapdragon platforms for connectivity and edge AI.[1] The piece argued that the stock looked undervalued relative to its expanding role in AI, automotive and connected devices, even as investors remained focused on handset cycles.[1]
The fundamental backdrop is more nuanced than a simple growth story. In Feb 2026, Qualcomm’s fiscal first-quarter report showed revenue of $12.25 billion and profit of $3 billion, or $2.78 per share, beating expectations but flagging that memory shortages could dent the near-term outlook.[2] In Nov 2025, the company had already guided to Q1 sales of $12.2 billion and adjusted profit of $3.40 per share, leaning on a recovery in smartphone demand to offset pockets of weakness.[4]
At the same time, structural risks have not gone away. In Jul 2025, Reuters reported that Qualcomm shares slid as investors digested the risk of Apple shifting modem orders and the potential impact of tariffs, which could trim mid-single digits off handset revenue and complicate the company’s China exposure.[6] Earlier that year and into Oct 2025, Forbes and Yahoo Finance coverage framed Qualcomm as a dominant but discounted player, with new AI200 and AI250 data center chips pitched as a lower-cost alternative for generative AI inference workloads.[3][5][7]
The chart below situates the latest move in its recent multi-month context and overlays a 60-day seasonal projection.
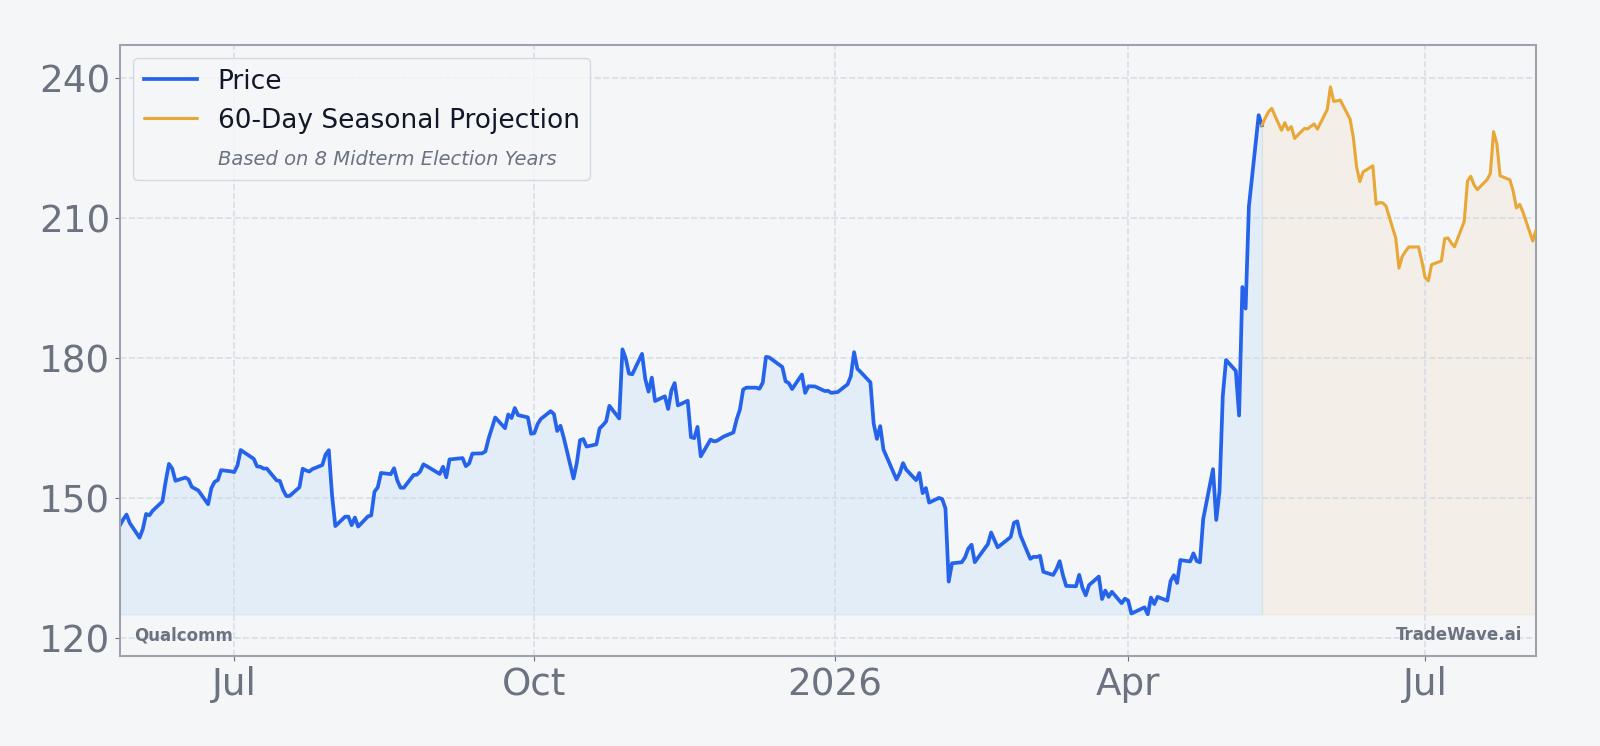
For traders, the tension is clear. Qualcomm has just staged a powerful rally off its lows, helped by AI enthusiasm and solid earnings, yet it is heading into a historical seasonality window that has often rewarded short exposure. That clash between current momentum and the QCOM seasonal trend is what makes this particular 22-day stretch worth watching.
What should traders watch as this Qualcomm seasonal window opens?
First, the calendar: the 22-day window begins on May 25 and runs into late June, squarely inside the midterm election year but just ahead of the transition toward the historically stronger pre-election year environment. If Qualcomm continues to grind higher into that start date, the setup will look very different than if the stock consolidates or pulls back toward its 50-day moving average.
Second, watch how the stock behaves relative to key levels. A sustained push back toward the $160–$170 zone would signal that buyers are willing to look through tariff and handset risks, while a failure to hold above the 50-day average near $134.33 would suggest that the recent 18.21% one-month surge was more of a positioning squeeze than a durable trend.[1] Inside the window, history says intraperiod swings can be large, so intraday ranges and gap moves around headlines may matter more than the final close.
Third, keep an eye on the policy and macro tape. Any fresh tariff rhetoric or signs that Apple is accelerating modem diversification could revive the concerns that knocked the stock in Jul 2025, when Reuters flagged that tariffs might shave mid-single digits off handset revenue.[6] Conversely, more evidence that automotive and IoT revenue are scaling, as highlighted in the Mar 2026 Forbes piece, would support the idea that Qualcomm’s earnings base is broadening beyond smartphones.[1]
Finally, behavior inside the window will tell you whether this QCOM seasonal trend is still in force. A pattern of mid-window weakness, with downside follow-through after early choppy days, would line up with the historical short bias. A clean break from that script, especially if the stock shrugs off drawdowns that previously showed up as large MAE readings, would be a sign that Qualcomm’s election-cycle playbook is changing along with its business mix.
Sources
- Forbes: "Is Qualcomm Stock Undervalued?" (Mar 16, 2026)
- The Wall Street Journal: "Qualcomm First-Quarter Sales Rise, But Memory Shortage Dents Outlook" (Feb 4, 2026)
- Forbes: "How Low Can Qualcomm Stock Drop?" (Jan 13, 2026)
- Reuters: "Qualcomm forecasts first-quarter results above estimates" (Nov 5, 2025)
- Forbes: "Qualcomm Stock Dominance At A Discount - Investment Opportunity?" (Oct 13, 2025)
- Reuters: "Qualcomm shares slide as Apple modem shift, tariffs raise growth concerns" (Jul 31, 2025)
- Yahoo Finance: "Qualcomm stock jumps after unveiling new AI chips" (Oct 27, 2025)
About this seasonal analysis
Seasonal pattern data is sourced from TradeWave.ai, which analyzes historical price behavior across annual calendar windows going back up to 30 years. Read the full data methodology or the book The 100-Year Pattern by Afshin Moshrefi (2026 edition). Past performance of seasonal patterns does not guarantee future results. This article is for informational purposes only and does not constitute investment advice.