Near 52-Week High, Warner Bros. Discovery (WBD) Faces Its Most Bearish 9-Day Stretch
Warner Bros. Discovery is trading just below its 52-week high as it heads into a late-April seasonal window that has historically favored short sellers and sharp swings.

What is the seasonal pattern for Warner Bros. Discovery (WBD)?
Warner Bros. Discovery has fallen in 9 of 10 years during this late-April 9-day window, with an average gain of 5.34% in winning short years.
- 9 for 10 in this window, averaging 5.34% gains in winning years for the short side.
- Seasonal direction is bearish for WBD from Apr 25 over a 9-day trading window based on the last decade.
- Percent Profitable is 90%, with 9 winners and 1 loser for the short pattern across 10 years.
- Average Profit - All years is 5%, showing the window has stayed positive for shorts even after including the lone losing year.
- TradeWave Ratio of 1.81 suggests price often travels meaningfully in the trade direction within the window before settling.
- Historical swings include sizable intraperiod drawdowns, so shorts have seen both strong favorable moves and uncomfortable reversals along the way.
According to historical data from TradeWave.ai, this late-April stretch has behaved very differently from an average month for WBD, and the next iteration is about to open again.
How has Warner Bros. Discovery (WBD) traded in this late-April window?
Warner Bros. Discovery has dropped in 9 of the past 10 years during the 9-day window that begins on Apr 25, making it one of the stock’s most consistently bearish calendar stretches. Shares finished Friday at $27.39, up 0.7% on the day and about 8.7% below the 52-week high of $30.00, after a grinding recovery from last year’s single-digit lows.
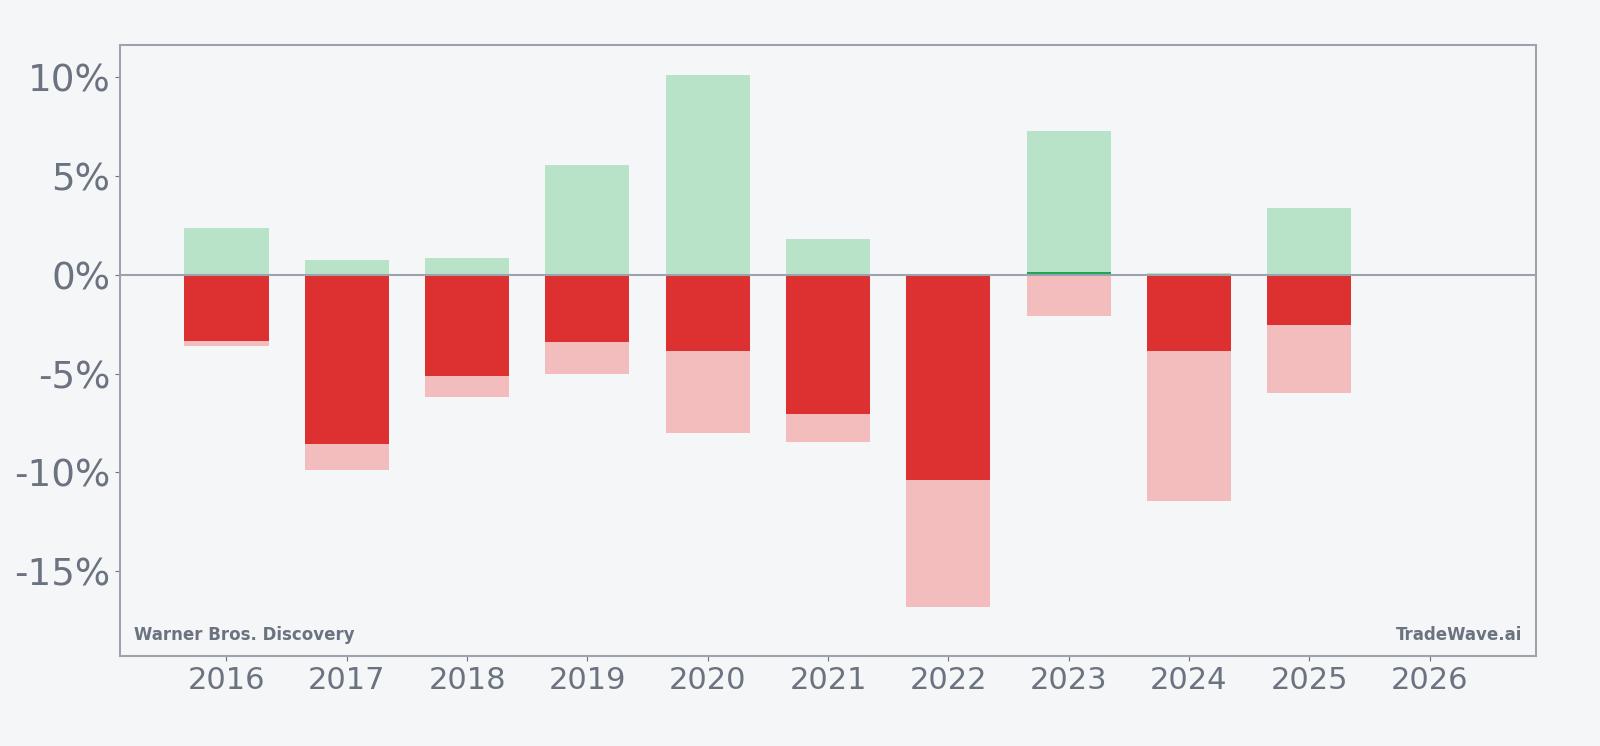
A stacked view of net returns alongside peak rallies and worst drawdowns shows how far WBD has typically moved inside this window.
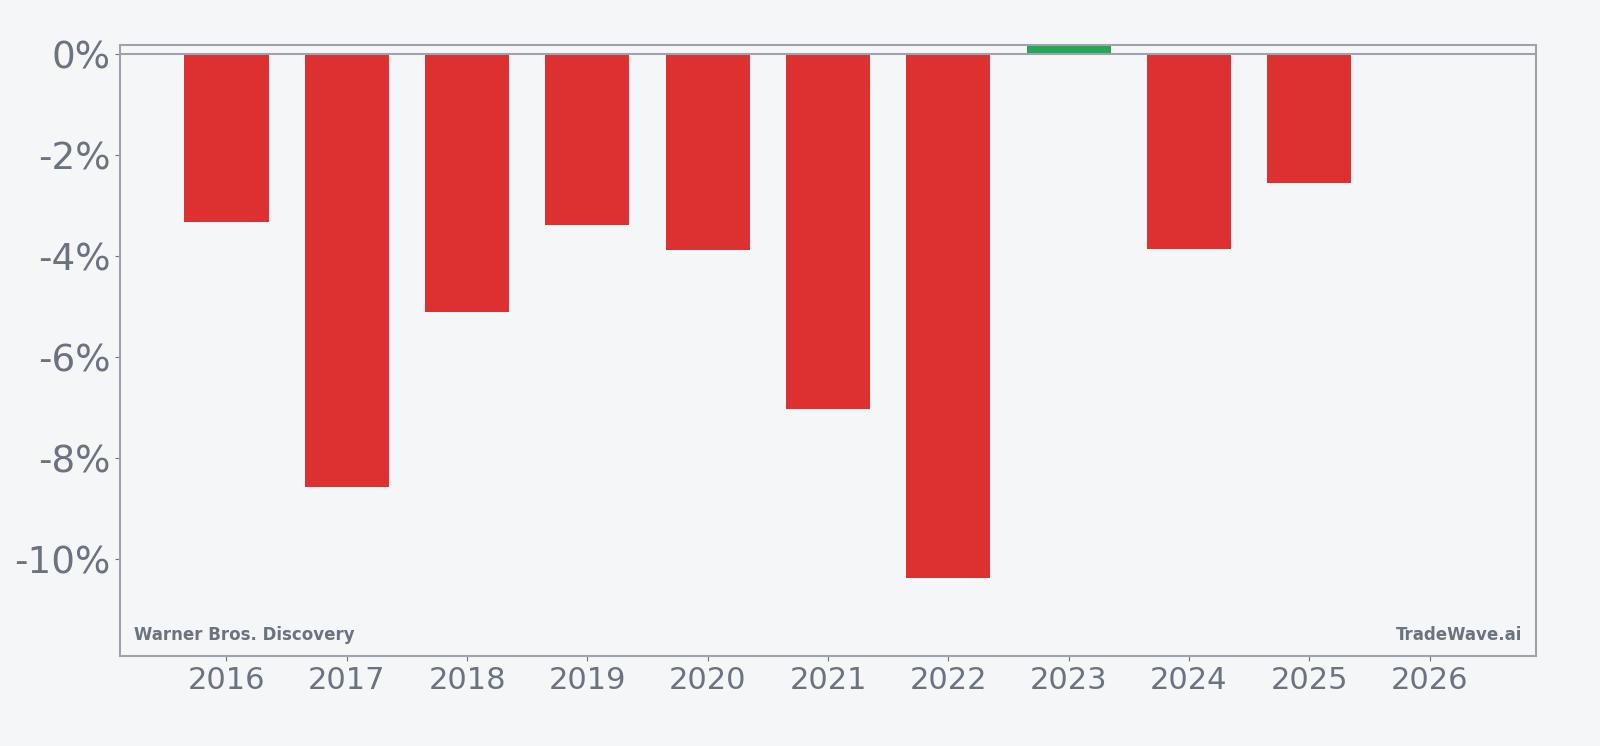
Historically, this has been a short-side pattern. The trade direction is explicitly short, and 90% of the past 10 years have delivered profits for that stance, with 9 winners against just 1 losing year. Average gains in the winning years come in at 5.34%, while the all-years average, which includes the lone loser, still sits at 5%.
The per-year table shows that the strongest short years were 2017 and 2022, when WBD fell 8.57% and 10.37% respectively over the window, both aligning with deeper maximum adverse moves for longs of roughly 9.9% and 16.79% from the entry price. In contrast, 2023 was the only losing year for shorts, with a small 0.16% net gain for longs despite a 7.26% peak rally during the window, underscoring how intraperiod swings can be larger than the final result.
The maximum favorable move and maximum adverse move profile is lopsided toward downside pressure. In several years, shorts saw double-digit peak gains as the stock slid, but those same years also carried meaningful snapback risk, with adverse moves against the short reaching between about 3% and 8% before the trend reasserted. That mix of large favorable and sizable adverse excursions points to a high-variance trading window where timing and risk controls have mattered as much as direction.
The 10-year seasonal trend chart slopes lower across the nine sessions, with much of the average decline front-loaded into the first few days. That suggests that when the pattern has worked, WBD has tended to break lower early in the window rather than grinding down slowly. The cumulative return curve for the window, which stacks each year’s path, shows a steady build of short-side gains over the decade rather than a single outlier year doing all the work.
Put simply, this is a bearish late-April window that has rewarded shorts in 9 of 10 tries, with enough intraday and intraperiod volatility to punish anyone who treats it as a one-way bet.
Why does Warner Bros. Discovery (WBD) follow this seasonal pattern?
One likely driver is the way WBD’s earnings calendar and film slate cluster around early May, which can leave late April as a positioning period for funds adjusting exposure to media and entertainment risk. Analysts have also pointed to recurring sector rotation around the start of the summer box-office season, when investors reassess studio pipelines and advertising trends. This late-April window may reflect that repositioning, with traders leaning defensively into potential earnings volatility and shifting capital toward or away from content-heavy names.
History does not guarantee future results; adverse excursions (MAE) can be large even in winning windows.
What is driving Warner Bros. Discovery (WBD) today?
WBD closed Friday at $27.39, up 0.7% on the session, and sits just 8.7% below its 52-week high of $30.00 after a powerful rebound from last year’s lows near $7.52. The stock’s one-month return is essentially flat at 0.04%, and it is trading slightly below its 50-day moving average of $27.75 on solid liquidity, with 20-day average volume around 25.2 million shares.
Fundamentally, the latest hard data came on Feb 26, when Warner Bros. Discovery reported a 6% fall in quarterly revenue as traditional TV and film businesses continued to shrink, even as HBO Max added subscribers.[4] Management has been trying to pivot the business mix toward streaming and more profitable studio content, but the legacy cable unit remains a drag, with earlier quarters showing double-digit revenue declines tied to cord-cutting.[1] The company has also been working through a strategic review that included exploring a potential sale or split, reflecting broader consolidation pressure across the media and entertainment sector.[5][6]
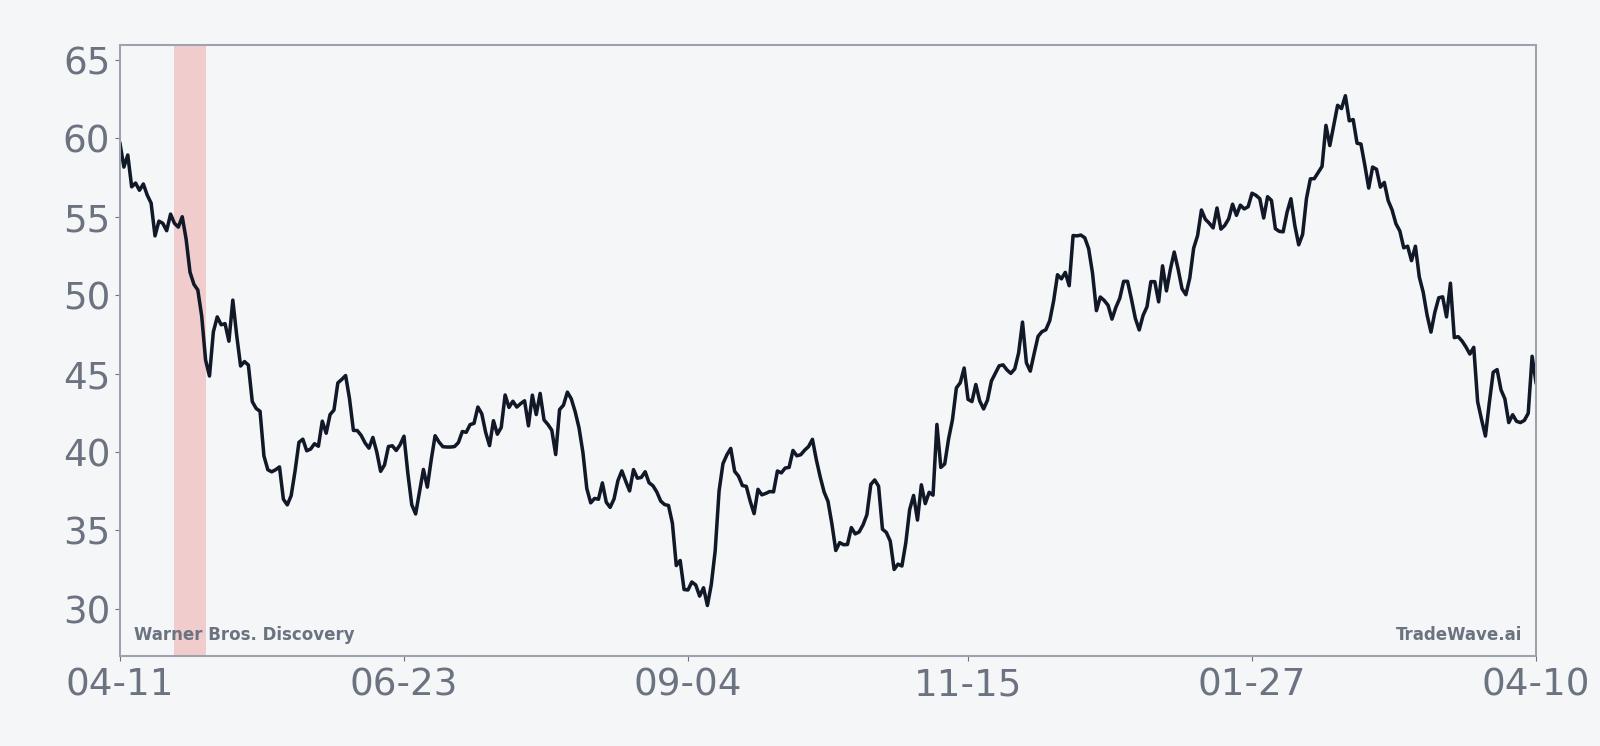
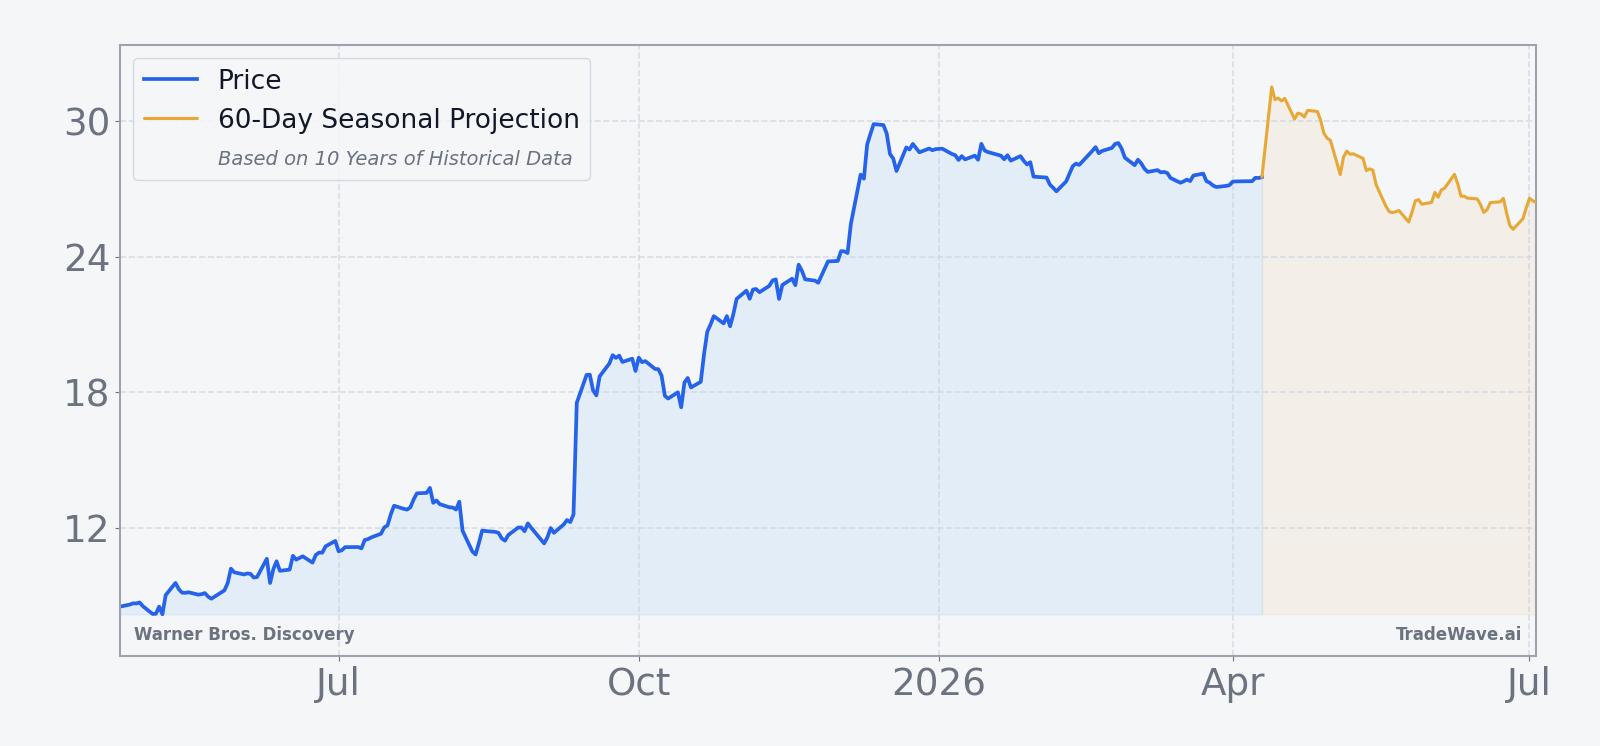
The chart below situates the latest move in its recent multi-month context, alongside a 60-day seasonal projection for the upcoming window.
What should traders watch in this WBD seasonal window?
First, the calendar. The 9-day window starting Apr 25 has historically been a weak stretch for WBD, and the stock is heading into it from a position of relative strength near the upper end of its 52-week range. How the price behaves in the first few sessions of the window will be important, because prior years have often seen the bulk of the move early rather than late.
Second, levels. On the upside, the 52-week high near $30.00 is the obvious line in the sand for bulls, while the rising band between the 50-day moving average around $27.75 and the recent low of $27.20 marks the first support zone. A decisive break below that area during the window would be more in line with the historical seasonal pattern, while a firm hold or breakout above $30.00 would look more like the rare 2023-style outlier year.
Third, catalysts. With no immediate earnings date on the calendar, traders will be watching for any update on strategic options, including a potential sale or split, which has previously triggered sharp single-day moves in the stock.[5][6] Any fresh headlines on deal talks, streaming subscriber trends, or studio performance could either reinforce the bearish seasonal bias or overwhelm it with idiosyncratic news.
Finally, volatility. The historical record shows that even winning short years have featured sizable rallies against the position inside the window, so intraperiod swings matter as much as the final close. If WBD enters the window quietly and then starts to post wide intraday ranges on heavy volume, that would be consistent with the past decade’s pattern of sharp but choppy downside. If instead the stock grinds sideways with contained ranges, it would signal that this year’s late-April stretch may be breaking from its usual script.
Sources
- [1] Reuters, "Warner Bros Discovery posts bigger-than-expected loss ahead of potential sale or split," Nov 6, 2025.
- [2] The Wall Street Journal, "Warner Brothers Discovery Revenue Tops Estimates, Swings to Profit," Aug 7, 2025.
- [3] CNBC, "Warner Bros. Discovery film studios lift second-quarter results," Aug 7, 2025.
- [4] Reuters, "Warner Bros posts 6% fall in quarterly revenue, deal talks in focus," Feb 26, 2026.
- [5] Reuters, "Warner Bros Discovery ponders outright sale," Oct 21, 2025.
- [6] CNBC, "WBD targets Christmas deadline for announcing a sale or split," Nov 5, 2025.
About this seasonal analysis
Seasonal pattern data is sourced from TradeWave.ai, which analyzes historical price behavior across annual calendar windows going back up to 30 years. Read the full data methodology or the book The 100-Year Pattern by Afshin Moshrefi (2026 edition). Past performance of seasonal patterns does not guarantee future results. This article is for informational purposes only and does not constitute investment advice.