Warner Bros. Discovery (WBD) Has Dropped in 9 of 10 Late-April Windows, Averaging 5% Short-Side Profits
Warner Bros. Discovery is trading near a one-year high just as it approaches a late-April window that has historically favored short sellers and sharp swings.

What is the seasonal pattern for Warner Bros. Discovery (WBD)?
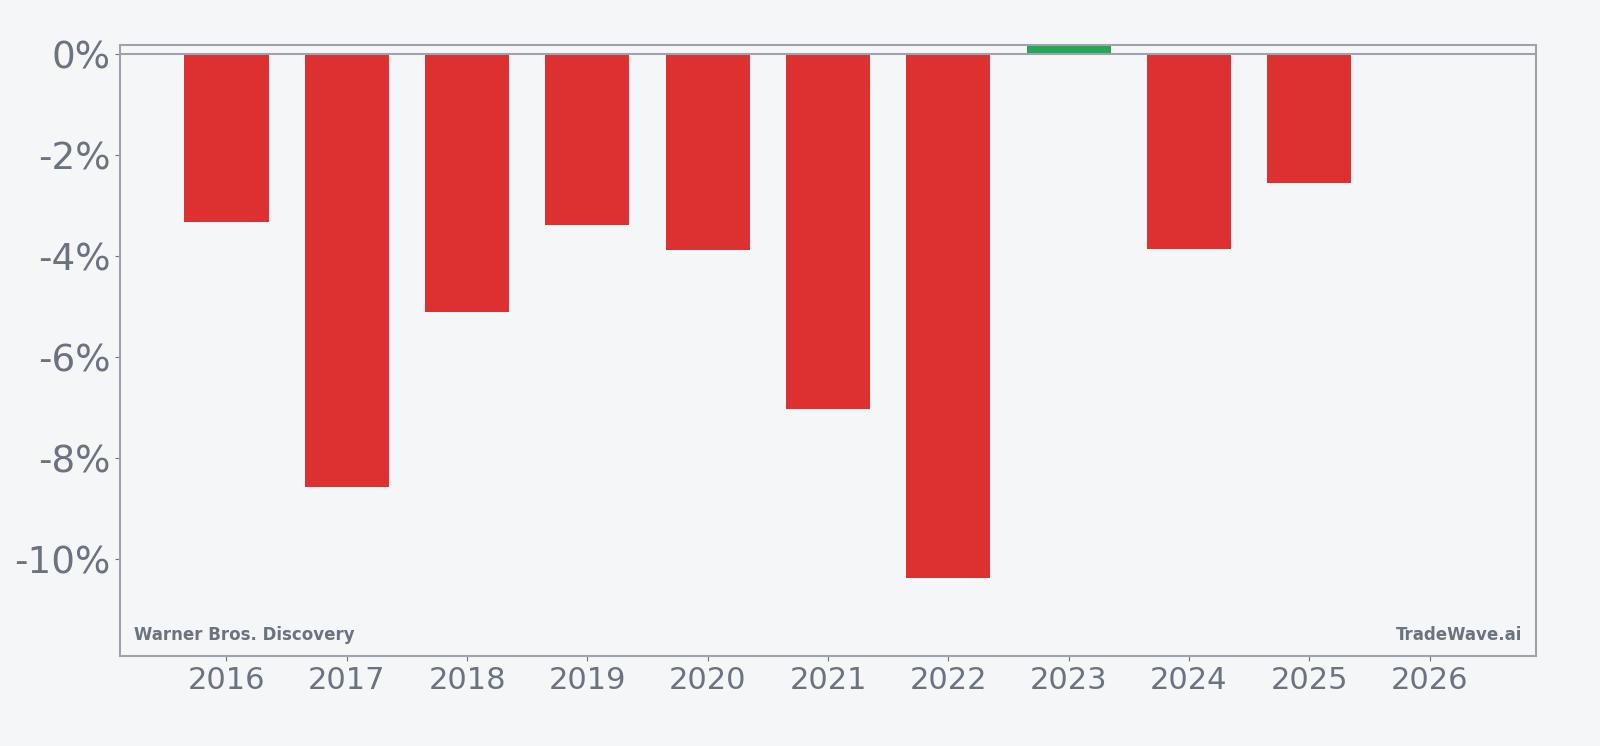
Warner Bros. Discovery has fallen in 9 of 10 years during this late-April 9-day window, with an average gain of 5.34% in winning short years.
- 9 for 10 in this window, with winning short years averaging 5.34% moves in the trade direction.
- The late-April window begins Apr 25 and runs for 9 trading days, historically favoring downside for WBD.
- Percent Profitable is 90%, with 9 winners and 1 loser for the short-side pattern.
- Average profit across all years, including the lone losing year, is still a solid 5% in the short direction.
- Intraperiod swings have been meaningful, with some years showing double-digit adverse moves before finishing in the trade direction.
- For a stock near its 52-week high, this historically bearish window adds another layer of risk management for traders.
According to historical data from TradeWave.ai, this specific late-April stretch has behaved very differently from an average month on the calendar for Warner Bros. Discovery, and the next iteration is only days away.
How has Warner Bros. Discovery (WBD) traded in this late-April window?
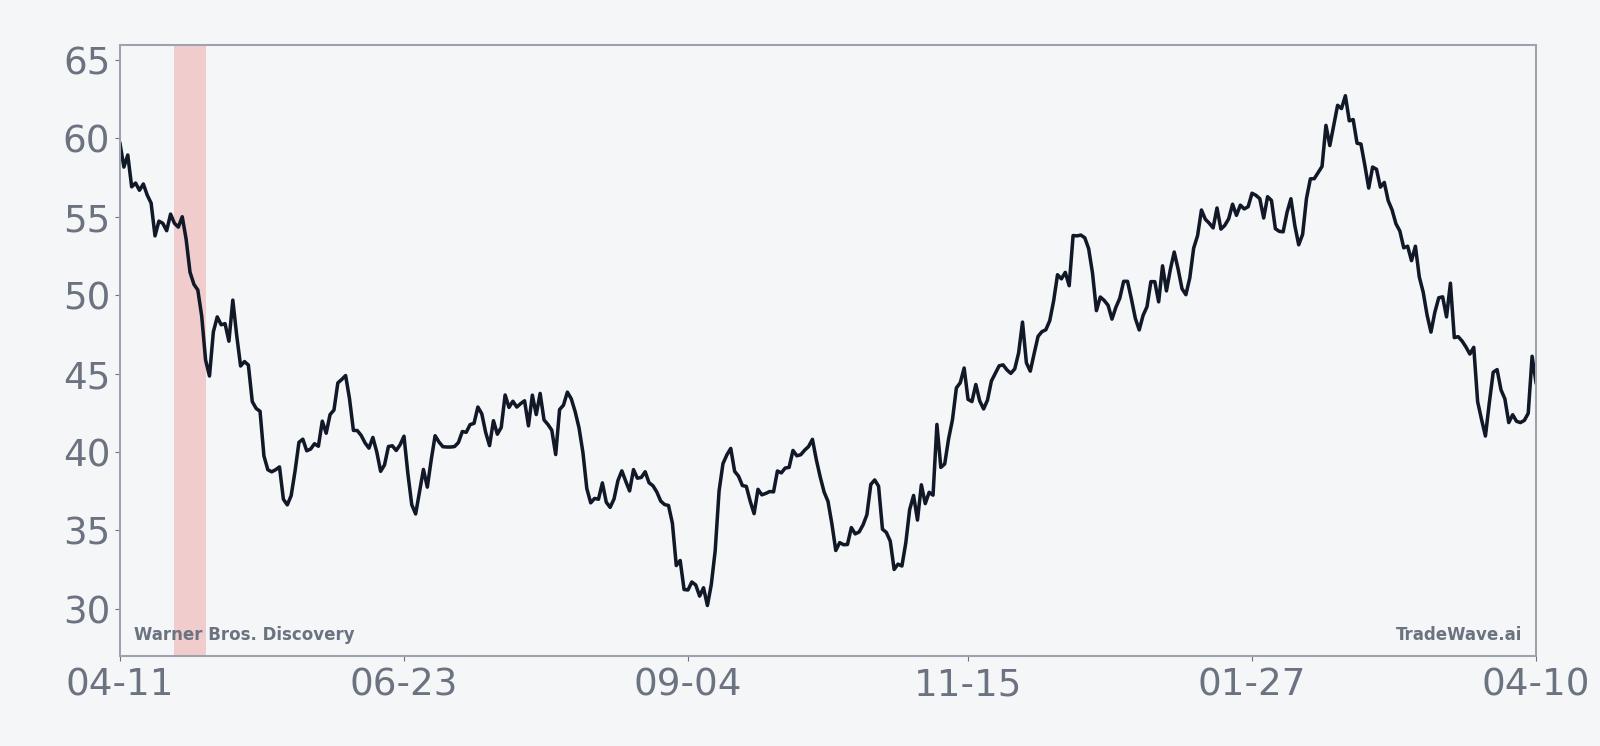
Warner Bros. Discovery has delivered profitable short-side outcomes in 9 of the past 10 late-April windows, with winning years averaging 5.34% moves in favor of the trade. Shares closed Monday at 27.44, down 0.3% on the day and about 8.5% below their 52-week high of 30.00.[5] That combination of a strong historical short pattern and a stock sitting near the top of its one-year range gives this upcoming 9-day stretch unusual tactical importance.
Across the 10-year lookback, the pattern is clear: this is a short-focused window. Percent Profitable sits at 90%, with 9 winning short years and just 1 losing year. Average profit in those winning years is 5.34%, while the average across all years, including the lone loser, is still 5% in favor of the short direction. Median profit of 3.86% and a Sharpe ratio of 1.52 point to a relatively consistent payoff profile for traders who have leaned into the historical WBD seasonal trend.
The per-year breakdown shows how that has played out in practice. The strongest year for the pattern was 2022, when a short entered around 21.50 and exited near 19.27, a net move of 10.37% in the trade direction. At the other end of the spectrum, 2019 delivered a modest 3.39% gain for shorts, while 2023 was the lone losing year, with the stock edging 0.16% higher against the short entry. Add it up: nine of ten years have rewarded traders who treated this late-April Warner Bros. Discovery trading window as a downside opportunity rather than a neutral patch.
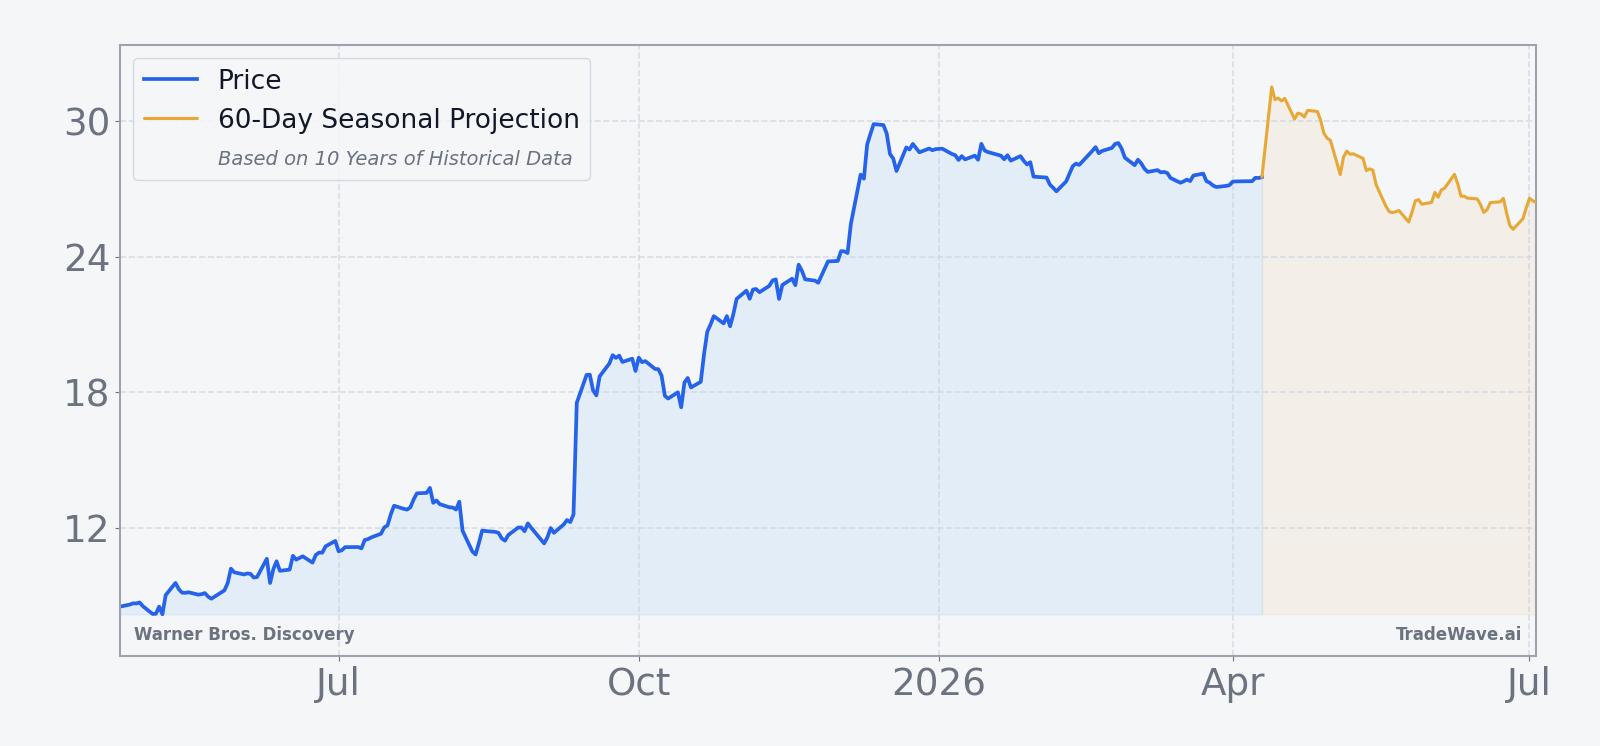
The historical seasonal average suggests that much of the move tends to occur early in the window. In several years, WBD has sold off sharply in the first few sessions after Apr 25, then either stabilized or partially retraced into the close of the pattern. The cumulative return profile reinforces that front-loaded behavior, with the typical path showing a quick drop followed by a flatter second half.
Year-by-year bars that include both peak run-ups and worst drawdowns show how much room WBD has historically given traders inside this window.
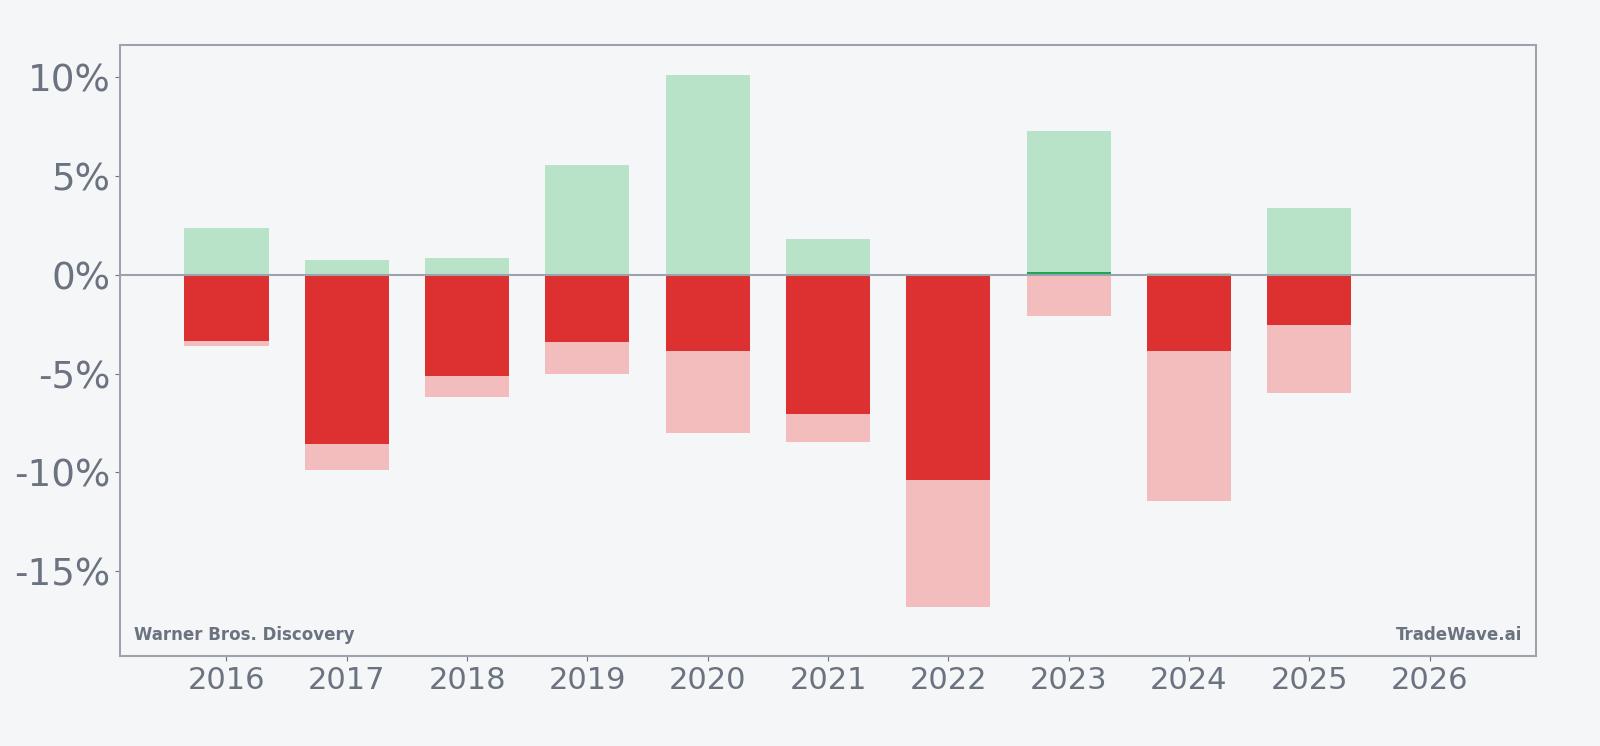
The maximum favorable excursion and maximum adverse excursion profile shows why this pattern matters for risk as much as for direction. In 2020, for example, the best intraperiod move from entry reached 10.11% in favor of the short, but the worst drawdown from entry was 8.02% against it before the trade finished profitably. In 2024, the net short gain of 3.86% came with an adverse swing of 11.46% at one point in the window. That mix of sizable peak run-ups and deep temporary reversals is captured in the TradeWave Ratio of 1.81, which signals that WBD often travels meaningfully in the trade direction inside this window even when the final close understates the path.
History does not guarantee future results, and adverse excursions can be large even in winning windows, so position sizing and risk controls matter as much as the seasonal edge.
Why does Warner Bros. Discovery (WBD) follow this seasonal pattern?
One likely driver is the way media and entertainment stocks trade around early-summer film slates and upfront advertising negotiations, which often cluster in late April and May. Analysts have also pointed to portfolio rebalancing around the end of the first half for many funds, which can hit highly volatile names like WBD harder than the broader market. This late-April seasonal pattern may reflect that combination of event risk and institutional repositioning rather than any single recurring catalyst.
What is driving Warner Bros. Discovery (WBD) today?
Warner Bros. Discovery slipped 0.3% Monday to 27.44 on volume of about 15.9 million shares, a quieter session after a powerful run that has taken the stock from a 52-week low of 7.52 to within single digits of its 30.00 high.[5] The move comes after a stretch in which the company has been at the center of media consolidation talk and strategic review headlines, including a February report that quarterly revenue fell 6% as legacy cable weakness offset strong studio performance and ongoing deal discussions.[5] In 2025, the company swung between upbeat studio-driven quarters and a larger-than-expected third-quarter loss as cord-cutting continued to pressure the traditional TV business, even as blockbuster releases such as a new Superman film helped the studios segment.[1]
The chart below situates the latest move in its recent multi-month context and overlays a short-term seasonal projection.
Strategic uncertainty remains a key macro driver for the stock. In Oct 2025, Warner Bros. Discovery initiated a review of strategic alternatives, including a potential sale or split, after receiving unsolicited interest from would-be buyers.[12] Later that month, Reuters reported that Netflix had tapped a bank to explore a possible bid, underscoring how central WBD’s content library and distribution assets have become in the streaming arms race.[13] By late November, the company was seeking improved bids by Dec 1, signaling that management was willing to push suitors for better terms rather than accept the first offer on the table.[9]
The stock’s volatility has reflected that backdrop. In Dec 2025, shares dropped after a report that Paramount Skydance might extend a tender offer and even threaten legal action, adding another layer of complexity to the takeover narrative.[8] Earlier, in Nov 2025, Warner Bros. Discovery posted a larger-than-expected quarterly loss of 6 cents per share on revenue of 9.05 billion dollars, down 6%, as cable TV declines outweighed strong studio results and deal talk kept the stock in focus.[2] In Aug 2025, the company had reported second-quarter revenue of 9.81 billion dollars and adjusted EBITDA of 1.95 billion dollars, both up modestly year on year, with film studios lifting results even as the broader media sector wrestled with cord-cutting and streaming competition.[1][4]
Sector-wide forces are also in play. The media and streaming group continues to navigate a difficult transition as cable revenue erodes and streaming subscriber growth slows, forcing companies like WBD to balance investment in content with cost cuts and potential asset sales.[5] At the same time, the broader media consolidation theme has kept a bid under strategic assets, with multiple potential acquirers circling WBD and peers as they look to bulk up libraries and distribution.[13] For traders watching the upcoming late-April seasonal window, that mix of structural headwinds and deal optionality creates a backdrop where historical seasonality can interact with headline risk in unpredictable ways.
Sources
- CNBC: Warner Bros. Discovery film studios lift second-quarter results (Aug 7, 2025)
- Reuters: Warner Bros Discovery posts bigger-than-expected loss (Nov 6, 2025)
- Seeking Alpha: Paramount Skydance to extend Warner Bros. tender offer - report (Jan 21, 2026)
- The Wall Street Journal: Warner Brothers Discovery Revenue Tops Estimates, Swings to Profit (Aug 7, 2025)
- Reuters: Warner Bros posts 6% fall in quarterly revenue (Feb 26, 2026)
- Yahoo Finance: Warner Bros. Discovery Shares Drop as Paramount Skydance Threatens Legal Action (Dec 26, 2025)
- Reuters: Warner Bros Discovery seeks improved bids by December 1 (Nov 25, 2025)
- Reuters: Warner Bros Discovery ponders outright sale (Oct 21, 2025)
- Reuters: Exclusive: Netflix taps bank to explore bid for Warner Bros Discovery (Oct 30, 2025)
About this seasonal analysis
Seasonal pattern data is sourced from TradeWave.ai, which analyzes historical price behavior across annual calendar windows going back up to 30 years. Read the full data methodology or the book The 100-Year Pattern by Afshin Moshrefi (2026 edition). Past performance of seasonal patterns does not guarantee future results. This article is for informational purposes only and does not constitute investment advice.