Strategic Review and Sale Talk Leave Warner Bros. Discovery (WBD) Vulnerable Into Bearish Window
Warner Bros. Discovery is trading just below its recent highs as it approaches a late-April seasonal window that has historically favored short sellers and added volatility around deal headlines.

What is the seasonal pattern for Warner Bros. Discovery (WBD)?
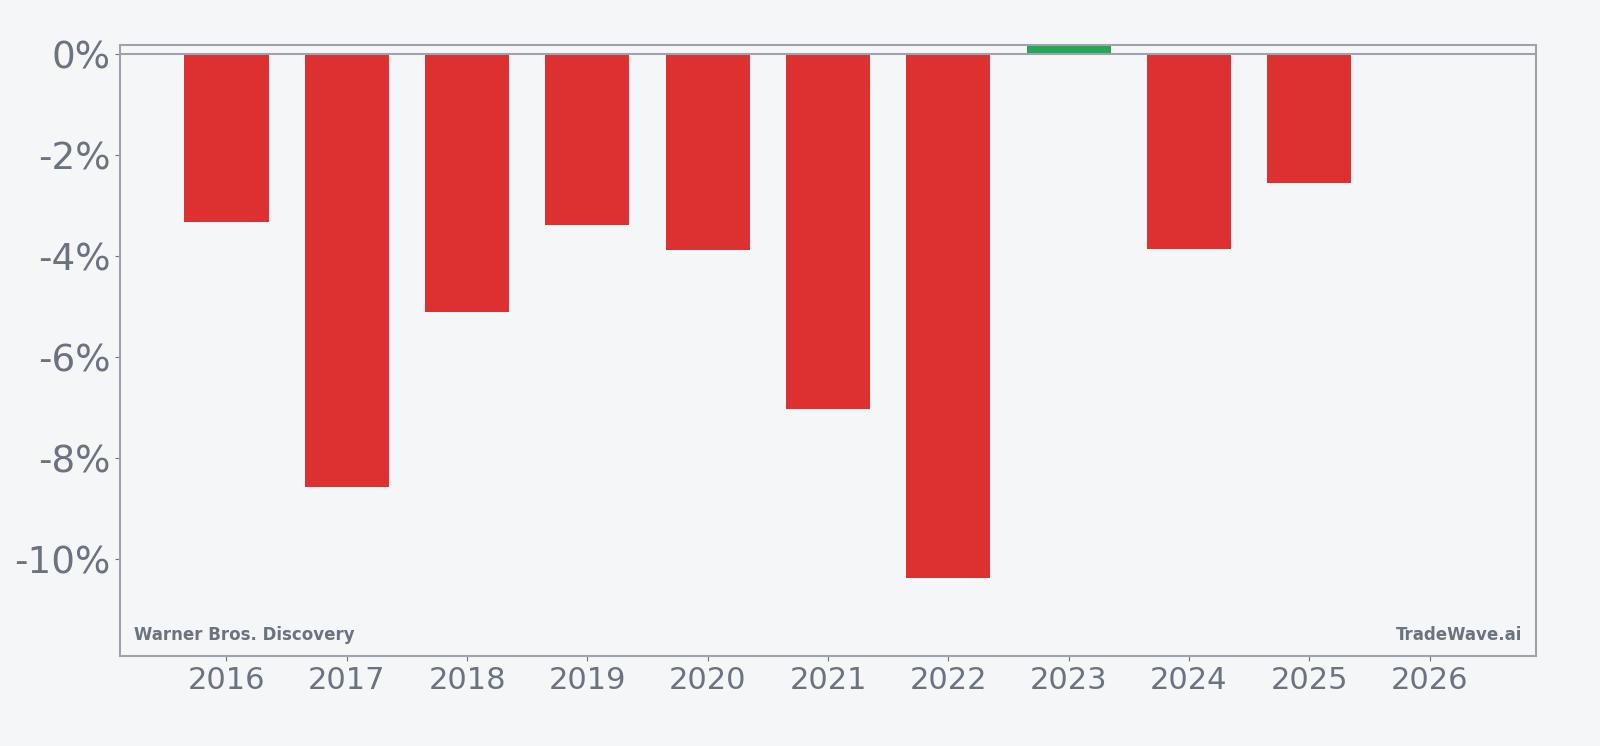
Warner Bros. Discovery has fallen in 9 of 10 years during this late-April 9-day window, with an average gain of 5.34% in winning short years.
- 9 for 10 in this window, with winning short years averaging 5.34% moves in the trade direction.
- Seasonal setup runs from Apr 25 for 9 trading days and has historically favored short positioning in WBD.
- Percent Profitable is 90%, with 9 winners and 1 loser across the past decade in this specific trading window.
- Including all years, Avg Profit - All is 5%, showing that the lone losing year has not erased the pattern’s edge.
- Intraperiod swings have been meaningful, with both strong favorable runs and notable drawdowns before the window closes.
- Sharpe ratio of 1.52 and a TradeWave Ratio of 1.81 point to a historically efficient short-side seasonal trend.
According to historical data from TradeWave.ai, this late-April stretch has behaved very differently from an average month for Warner Bros. Discovery, and the next iteration is about to open again.
How has Warner Bros. Discovery (WBD) traded in this late-April window?
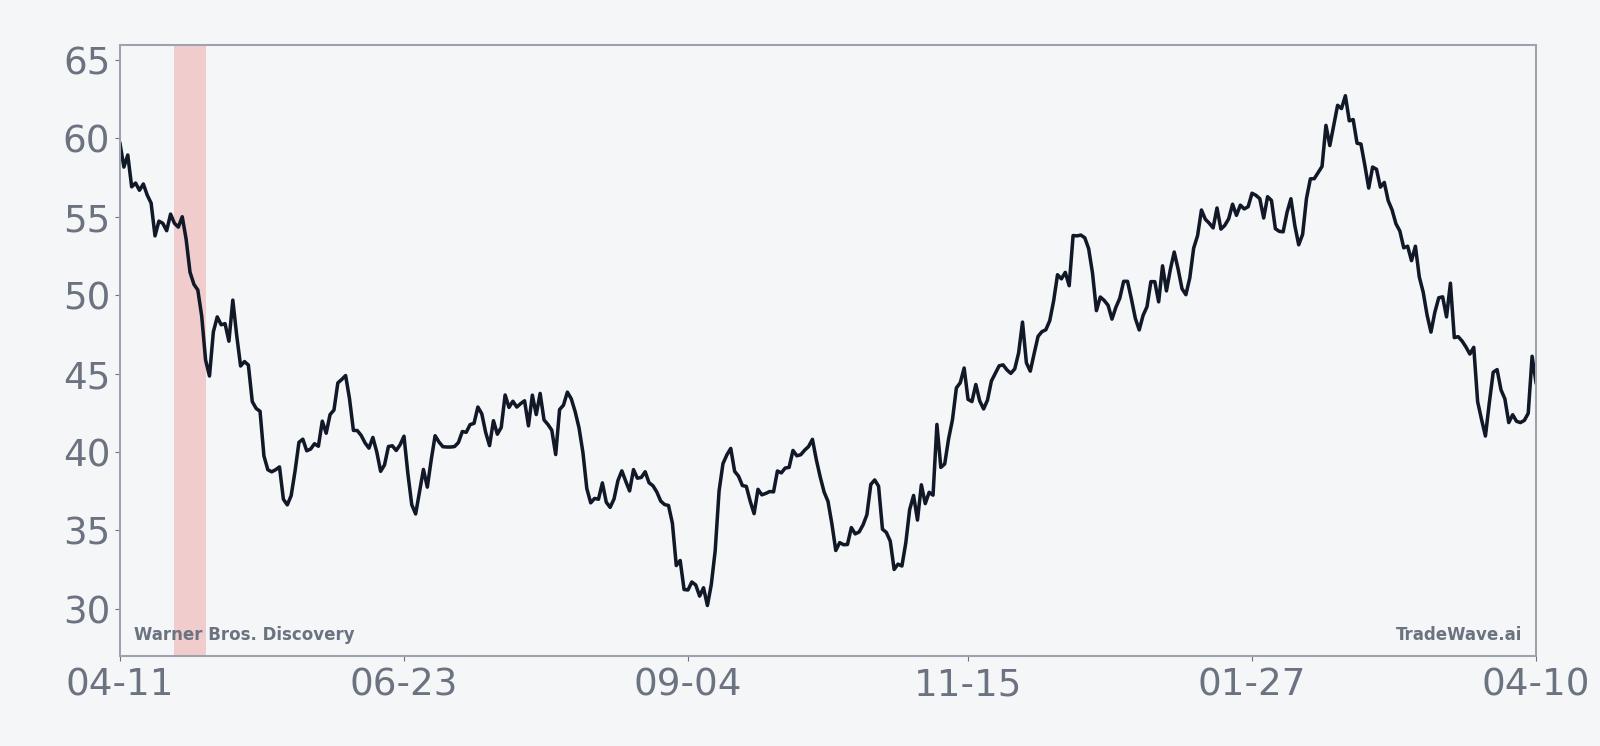
Warner Bros. Discovery has declined in 9 of the past 10 years during the 9-day window that begins on Apr 25, making it one of the stock’s most consistently bearish calendar stretches. Shares finished Tuesday at 27.31, down 0.4% on the day and about 9.0% below their 52-week high of 30.00.[5] That combination of a strong short-side seasonal pattern and a stock sitting closer to the top of its one-year range gives traders a clean reference point as the window approaches.
For this short-side setup, “winners” are years when WBD finished the window lower than it started. Across those nine winning years, the average move in the trade direction was 5.34%, while including the lone losing year trims the all-years average to 5%. Percent Profitable sits at 90%, with 9 winners and just 1 loser, which is unusually high consistency for a single-stock seasonal pattern over a decade.
The 10-year average path shows the stock typically softening early in the window, with most of the downside accruing in the first few sessions before stabilizing into the close. That shape fits the idea of traders leaning into short exposure quickly once the calendar flips into this slice of late April.
A second view layers in both the best and worst intraperiod swings for each year.
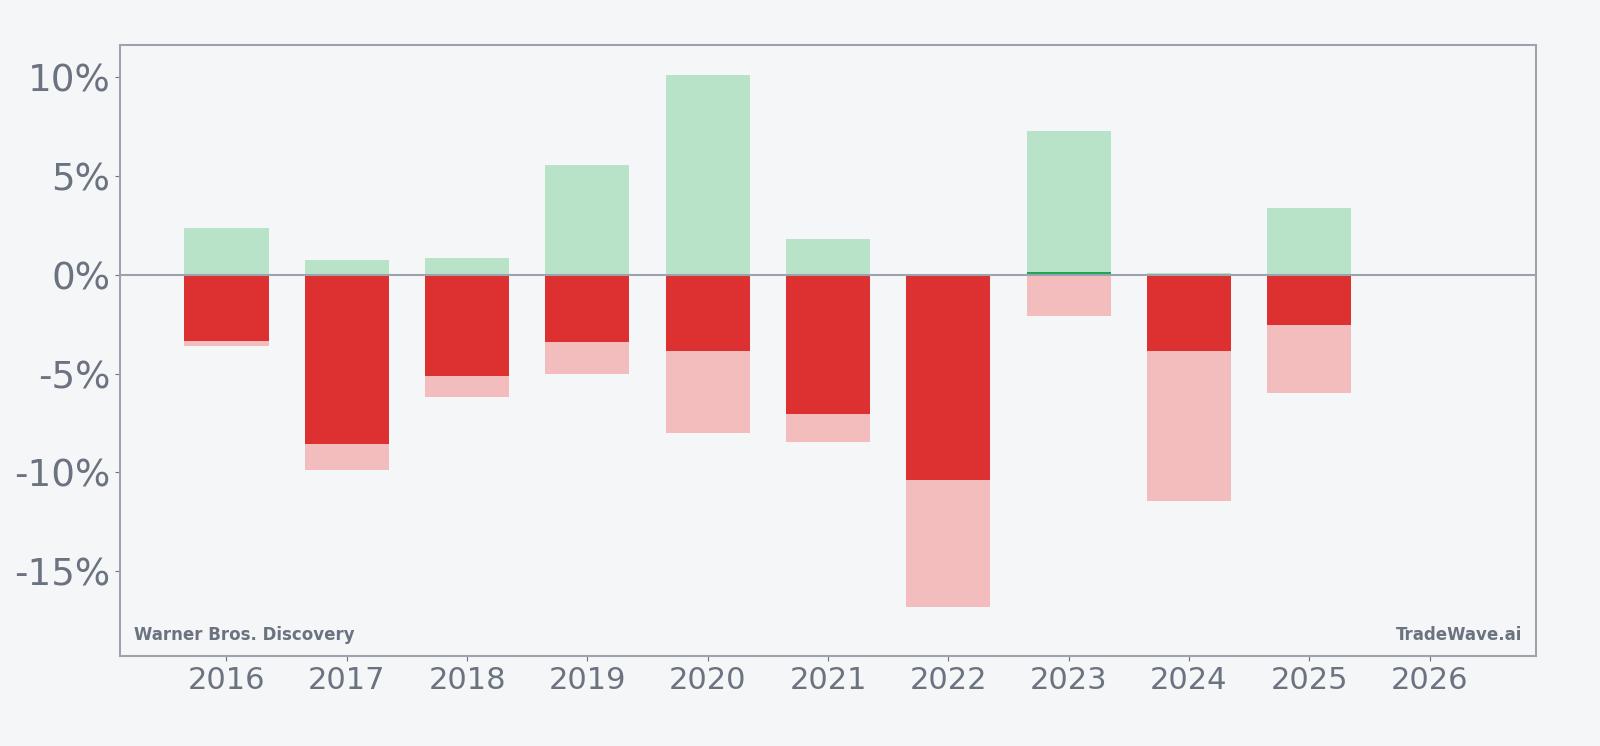
The stacked bar view of net return, maximum favorable excursion and maximum adverse excursion shows that even in winning short years, WBD has often staged sharp intraperiod rallies before rolling over. In 2020, for example, the stock’s best point-to-peak move during the window was a 10.11% rally against the short, while the worst drawdown from entry reached 8.02% in the trade direction, illustrating how quickly both sides of the tape can move. The weakest year for the pattern was 2017, when the stock fell 8.57% over the window with a 9.9% maximum adverse move in the trade direction, while the lone losing year for shorts was 2023, when WBD finished fractionally higher despite a 7.26% intraperiod drop that would have rewarded active risk management.
History does not guarantee future results; adverse excursions (MAE) can be large even in winning windows.
Why does Warner Bros. Discovery (WBD) follow this seasonal pattern?
This late-April seasonal pattern may reflect how media investors position around the company’s film slate, upfront advertising discussions and early-summer box office expectations. One likely driver is portfolio managers trimming exposure after first-quarter reporting and before the heart of the blockbuster season, especially when the stock has run up into deal speculation. The short window and repeated downside bias suggest that even modest disappointments or shifting merger chatter in this period have historically been enough to knock WBD lower.
What is driving Warner Bros. Discovery (WBD) today?
Warner Bros. Discovery slipped 0.4% to 27.31 on Tuesday, a quiet move that still leaves the stock about 9.0% below its 52-week high of 30.00 and far above its 52-week low of 7.52, a range that underscores how violent the past year has been for the name.[5] The stock has been trading near its 50-day moving average of 27.75 on heavy volume, with roughly 24.6 million shares changing hands on the latest close versus a 20-day average of 25.2 million, as investors weigh the company’s strategic options and the broader media consolidation story.[5]
In February 2026, Warner Bros. Discovery reported a 6% year-on-year revenue decline and kept the market focused on whether a sale or major transaction could unlock value, rather than on near-term earnings momentum.[5] The company sits at the center of a media sector that is still digesting cord-cutting, streaming losses and the cost of premium content, with studio hits offset by pressure in legacy cable networks.[2] At the same time, the industry backdrop remains dominated by merger and acquisition talk, with Warner Bros. Discovery exploring strategic alternatives and potential bidders evaluating how its assets would fit into their own streaming and studio portfolios.[11][12][13]
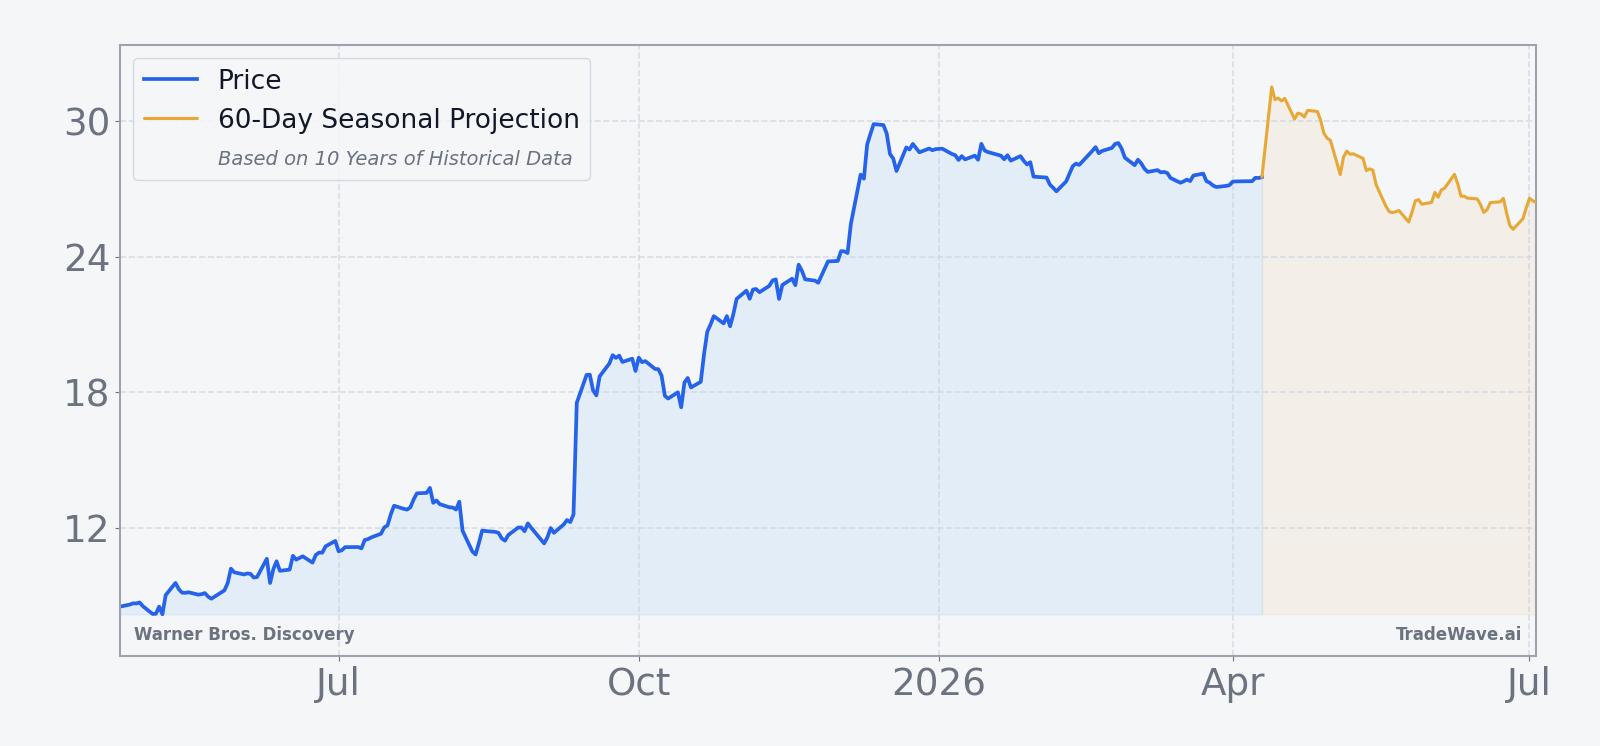
The chart below situates the latest move in its recent multi-month context and overlays the upcoming seasonal projection.
What does the earnings picture look like for Warner Bros. Discovery (WBD)?
Warner Bros. Discovery’s recent earnings track record has been mixed, with strong studio performance offset by weakness in streaming and cable. In August 2025, the company reported second-quarter revenue of 9.81 billion dollars, up 1% year on year, and adjusted EBITDA of 1.95 billion dollars, up 9%, helped by a robust film slate and cost controls.[1][4] In November 2025, however, third-quarter revenue slipped to 9.05 billion dollars, down 6%, and the company posted a loss of 6 cents per share as streaming and traditional TV continued to drag on results.[2]
Management has guided for the studios segment to generate at least 2.4 billion dollars of adjusted EBITDA for the full year, with a longer-term goal of more than 3 billion dollars, underscoring how central film and TV production are to the investment case.[1][4] That focus matters for the upcoming late-April seasonal window, which sits just ahead of the summer box office season and can coincide with shifting expectations for how the studio pipeline will translate into cash flow. With no firm date yet for the next earnings release, traders are using the recent results and guidance as the baseline while they watch how any new deal headlines or content updates intersect with the stock’s historical seasonality.
How does the media and streaming backdrop affect WBD’s setup?
Warner Bros. Discovery is trading inside a sector that is still in transition as cord-cutting erodes traditional cable revenue and streaming economics remain challenging. In 2025, the company’s revenue decline was tied directly to softness in cable TV and streaming, even as its studio division delivered standout results, a split that has become common across legacy media groups.[2] The macro story is one of consolidation and scale, with larger platforms seeking content libraries and distribution reach, and Warner Bros. Discovery’s mix of HBO, Warner Bros. studios and cable networks making it a natural target in that process.[11][12][13]
Media consolidation has also created a layer of optionality in the stock that can amplify volatility around short seasonal windows. When potential bidders circle or strategic reviews are underway, even small shifts in perceived deal probability can move the share price quickly, especially if they land inside a calendar stretch that has historically seen directional pressure. For traders watching the late-April WBD seasonal trend, the sector backdrop means that both company-specific headlines and broader streaming sentiment can act as catalysts inside a window that already has a strong historical bias.
How are investors thinking about Warner Bros. Discovery’s valuation?
Traditional valuation markers like price-to-earnings are harder to lean on for Warner Bros. Discovery given its recent losses and heavy investment cycle, so many investors are framing the stock in terms of enterprise value to EBITDA and sum-of-the-parts math. The studio business, which management expects to deliver at least 2.4 billion dollars of adjusted EBITDA with a path toward more than 3 billion dollars, is often valued at a premium to the slower-growth cable networks and still-loss-making streaming operations.[1][4] That creates a wide range of fair-value estimates depending on how much credit investors give to potential cost cuts, asset sales or a full takeover.
In February 2026, when Warner Bros. Discovery reported a 6% revenue decline and continued strategic discussions, the market reaction suggested that investors were still willing to look through near-term earnings noise in favor of a cleaner balance sheet or a transaction that crystallizes the value of its content library.[5] Against that backdrop, the stock’s approach to a historically weak late-April trading window could become a test of how much of the deal premium is already priced in. If the shares hold up better than they have in prior years, it would hint that the market is anchoring more on strategic value than on the usual seasonal pattern.
What should traders watch in this late-April WBD window?
The key dates are straightforward: the seasonal window opens on Apr 25 and runs for 9 trading days, a compact stretch that has historically delivered short-side gains in 9 of 10 years with an average 5.34% move in winning years. The first thing to watch is how WBD behaves as it enters the window relative to its current level around 27. If the stock remains pinned near the upper end of its recent range, any downside move toward the mid-20s would be consistent with the historical pattern, while a decisive break above the 30 area would mark a clear departure from it.
Second, earnings and deal headlines will matter. Any update on strategic alternatives, bidder interest or asset sales could either reinforce or overwhelm the usual late-April seasonal trend, especially if it changes how investors value the studio and streaming franchises.[5][11][12][13] Third, intraday volatility inside the window deserves close attention. Past years have shown that even in winning short windows, WBD can stage sharp rallies before rolling over, so traders will be watching whether early strength fades or persists as the days progress.
Finally, volume and positioning will be important tells. If trading activity spikes as the window opens and price action starts to lean in the historical direction, it would suggest that more participants are aware of and trading around this WBD seasonal trend. If, instead, the stock grinds sideways on muted volume, it would signal that the merger narrative and longer-term restructuring story are taking precedence over what has been one of the stock’s most reliable short-term calendar patterns.
Sources
- [1] CNBC, "Warner Bros. Discovery film studios lift second-quarter results" (Aug 7, 2025)
- [2] Reuters, "Warner Bros Discovery posts bigger-than-expected loss" (Nov 6, 2025)
- [3] Seeking Alpha, "Paramount Skydance to extend Warner Bros. tender offer" (Jan 21, 2026)
- [4] The Wall Street Journal, "Warner Brothers Discovery Revenue Tops Estimates" (Aug 7, 2025)
- [5] Reuters, "Warner Bros posts 6% fall in quarterly revenue" (Feb 26, 2026)
- [7] Yahoo Finance, "Warner Bros. Discovery Shares Drop" (Dec 26, 2025)
- [8] Reuters, "Warner Bros Discovery seeks improved bids" (Nov 25, 2025)
- [11] Reuters, "Warner Bros Discovery ponders outright sale" (Oct 21, 2025)
- [12] Reuters, "Exclusive: Netflix taps bank to explore bid for Warner Bros Discovery" (Oct 30, 2025)
- [13] Bloomberg, "Warner Bros. to Begin Sharing Financial Data With Bidders" (Oct 22, 2025)
About this seasonal analysis
Seasonal pattern data is sourced from TradeWave.ai, which analyzes historical price behavior across annual calendar windows going back up to 30 years. Read the full data methodology or the book The 100-Year Pattern by Afshin Moshrefi (2026 edition). Past performance of seasonal patterns does not guarantee future results. This article is for informational purposes only and does not constitute investment advice.