Oracle Corporation (ORCL) Has Gained in 8 of 8 Midterm May Windows, Averaging 29.54%
Oracle Corporation is heading into a historically powerful midterm-election-year seasonal window just as the stock cools off from a post-earnings AI surge and trades well below its 52-week high.

What is the seasonal pattern for Oracle Corporation (ORCL)?
Oracle Corporation has risen in 8 of 8 midterm-election-year windows starting in early May, with an average gain of 29.54% in winning years.
- 8 for 8 in this window, with Oracle averaging 29.54% gains across all winning years over the 353-day span.
- The upcoming window begins on May 2, 2026 and runs roughly 353 trading days, covering the late midterm year into the pre-election year.
- Percent Profitable is 100%, with 8 winners and 0 losers across the last eight midterm-election-year cycles.
- Median profit of 31.09% and cumulative return of 672% highlight how consistently this ORCL seasonal trend has favored the long side.
- Historical maximum adverse moves inside the window have reached roughly 31% in the weakest year, so drawdowns have been meaningful even in ultimately positive cycles.
- A TradeWave Ratio of 1.2 and Sharpe ratio of 2.37 point to strong risk-adjusted performance for this Oracle Corporation trading window.
According to historical data from TradeWave.ai, this specific midterm-election-year stretch for Oracle has behaved very differently from an average calendar year, with a distinct long-side bias that shows up repeatedly across cycles.
How strong is the upcoming seasonal window for Oracle Corporation (ORCL)?
Oracle Corporation has risen in all eight prior midterm-election-year windows that start around May 2 and run for 353 trading days, averaging gains of 29.54% with no losing years. Today the stock closed at 173.28, down 1.7% on the session and sitting about 49.1% below its 52-week high of 340.33, even after a powerful rebound over the past month.[5]
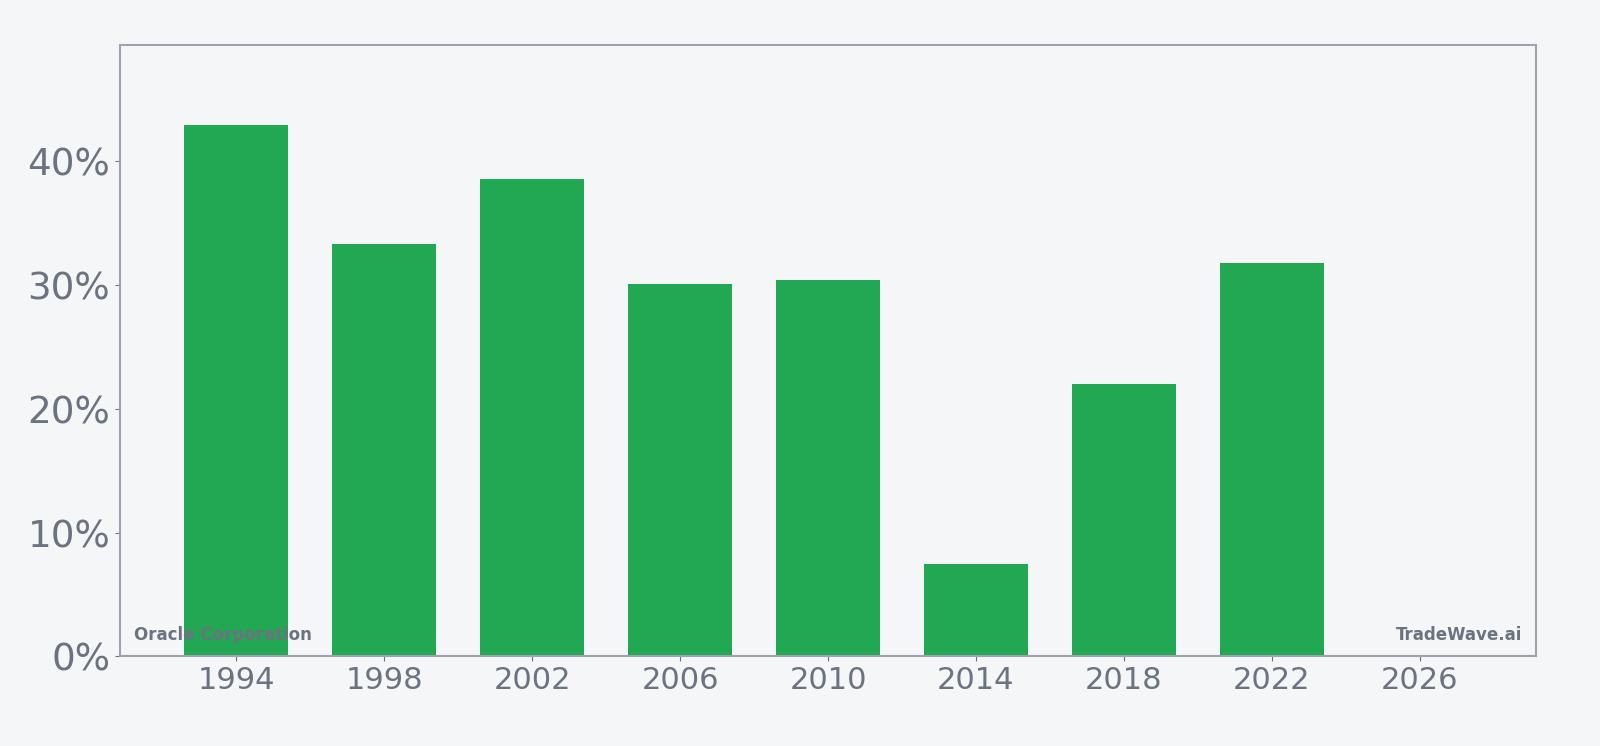
Grouping the data by the presidential election cycle matters here because this window always lands in the midterm election year, a phase that often brings policy uncertainty, shifting fiscal priorities and sector rotation across large-cap tech. For Oracle, the pattern is not just positive but unusually consistent: every midterm-year sample from 1994 through 2022 finished higher over this 353-day stretch, with a cumulative gain of 672% across the eight cycles.
The strongest year in the sample was 1998, when Oracle returned 33.26% over the window and at one point was up as much as 134.68% from the entry before giving back a large chunk of that move. The softest outcome was 2014, which still delivered a 7.45% gain but saw the stock swing between a 15.15% peak run-up and an 11.7% intraperiod drawdown. That mix of strong net results and sizable swings is typical of this ORCL seasonal trend.
The historical seasonal average trend for this Oracle Corporation trading window slopes higher for most of the period, with gains tending to accrue steadily rather than in a single burst. Trend metrics tilt clearly to the long side, with 46 long-trend days versus 18 short-trend days across the full window, and an even stronger 54-to-17 skew when focusing on the core of the pattern. That profile suggests that in prior midterm years, pullbacks inside this window have more often been pauses in an uptrend than the start of lasting declines.
A closer look at yearly net returns and intraperiod swings shows how upside and downside have traded off inside this window.
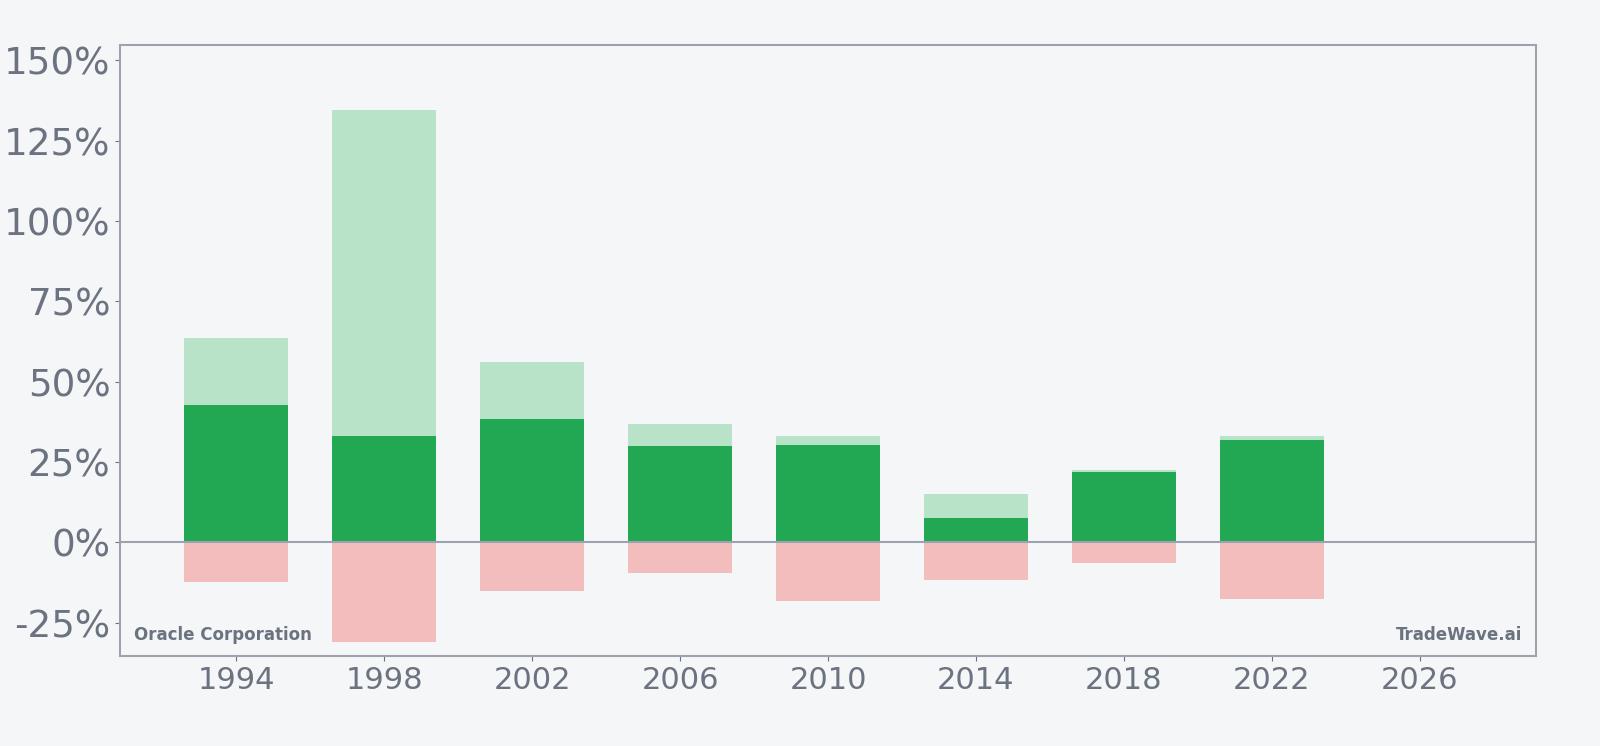
Across the eight midterm-year samples, maximum favorable moves inside the window have ranged from about 15% to more than 130%, while maximum adverse moves have stretched as deep as roughly 31%. Large positive excursions paired with meaningful drawdowns point to a high-energy environment where the long-side edge has been strong but rarely smooth. Add it up: eight for eight, with a median gain just over 31%, is a rare combination of consistency and magnitude for a single stock pattern analysis.
History does not guarantee future results, and even in windows that ultimately finished higher, adverse excursions have at times been large enough to test conviction.
Why does Oracle Corporation (ORCL) follow this seasonal pattern?
One likely driver is the way Oracle’s fiscal calendar and big cloud and AI contract cycles line up with the midterm election year, when government and enterprise tech budgets often reset and then ramp. Analysts have also pointed to institutional portfolio repositioning around policy shifts in midterm years, which can favor large-cap software and infrastructure names as visibility improves.[6] This ORCL seasonal trend may reflect that combination of earnings calendar clustering, sector rotation and renewed risk appetite as markets transition from the midterm year into the historically stronger pre-election year.
What is driving Oracle Corporation (ORCL) today?
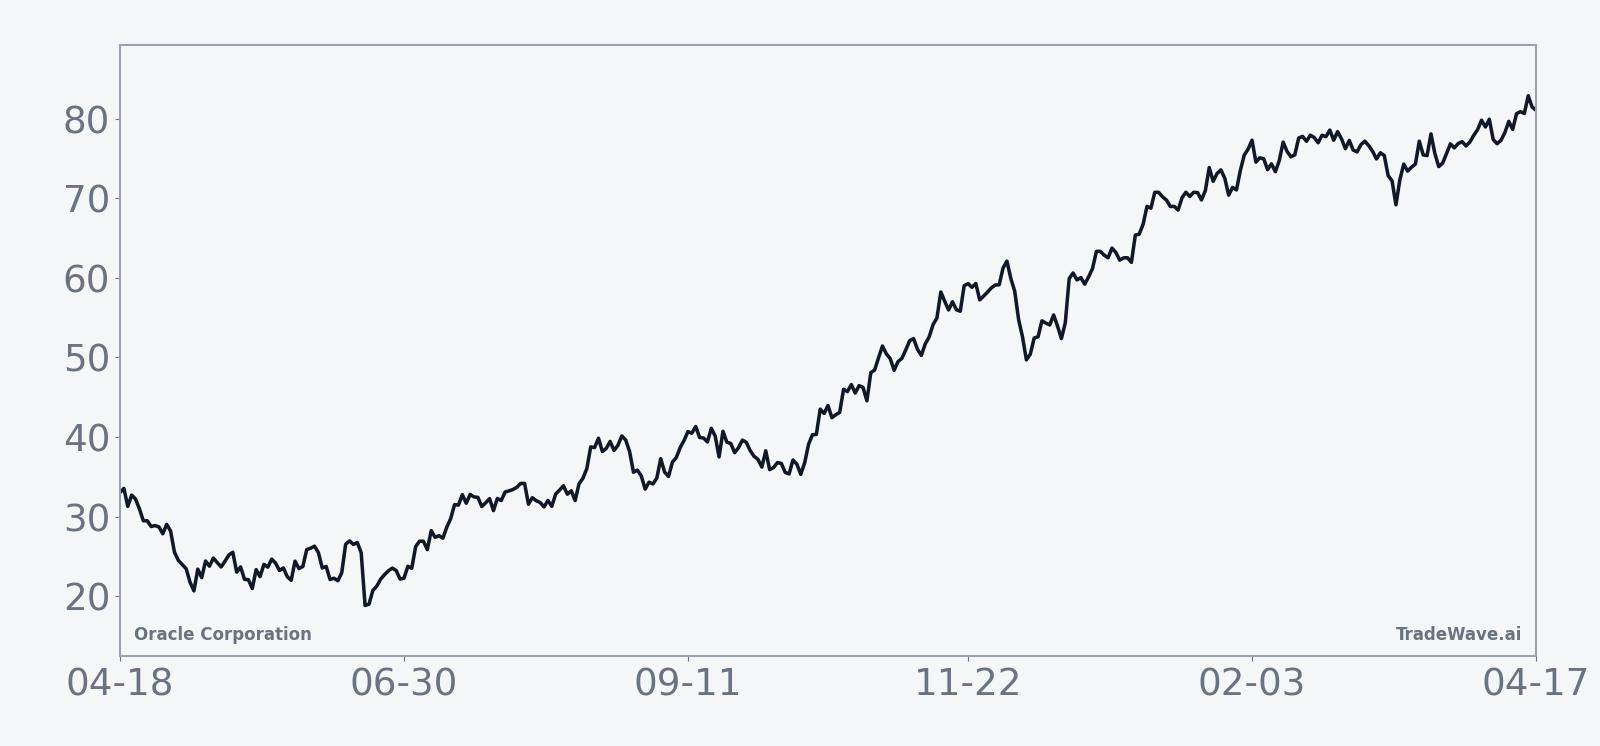
Oracle shares closed Monday at 173.28, down 1.7% on the day but still up 22.19% over the past month as the stock digests a sharp post-earnings rally.[5] The stock is trading about 49.1% below its 52-week high of 340.33 and roughly 33.9% above its 52-week low of 129.39, with 20-day average volume running near 30.4 million shares, underscoring how volatile the name has been around its AI narrative.[5]
On Mar 10, Oracle reported fiscal third-quarter earnings that topped expectations, posting EPS of 1.79 dollars versus 1.70 dollars expected and revenue of 17.19 billion dollars against a 16.9 billion dollar consensus.[3] Cloud infrastructure revenue reached 4.9 billion dollars, ahead of estimates, and management raised its 2027 revenue outlook to 90 billion dollars, leaning hard into the idea that AI data center demand can support years of double-digit growth.[3][6]
The market reaction was immediate. On Mar 11, Oracle stock “rocketed higher” after the earnings beat and stronger long-term forecast, with intraday gains as large as 14% as investors recalibrated expectations for the company’s AI infrastructure push.[5] Coverage from Forbes the same day framed the results as a reset for Oracle’s 2026 outlook, arguing that the combination of cloud growth and a clearer revenue path helped ease concerns about the scale of its AI investments.[6]
Reuters also highlighted how the stronger revenue forecast helped calm worries about Oracle’s “massive AI bets,” noting that the company’s guidance suggested its data center build-out could be matched by demand from hyperscalers and enterprise customers.[7] That macro backdrop matters for the broader tech sector seasonal outlook, because Oracle sits at the intersection of cloud infrastructure, database software and AI workloads, all of which are central to the current market narrative.
The chart below situates the latest move in its recent multi-month context, alongside a short-term seasonal projection.
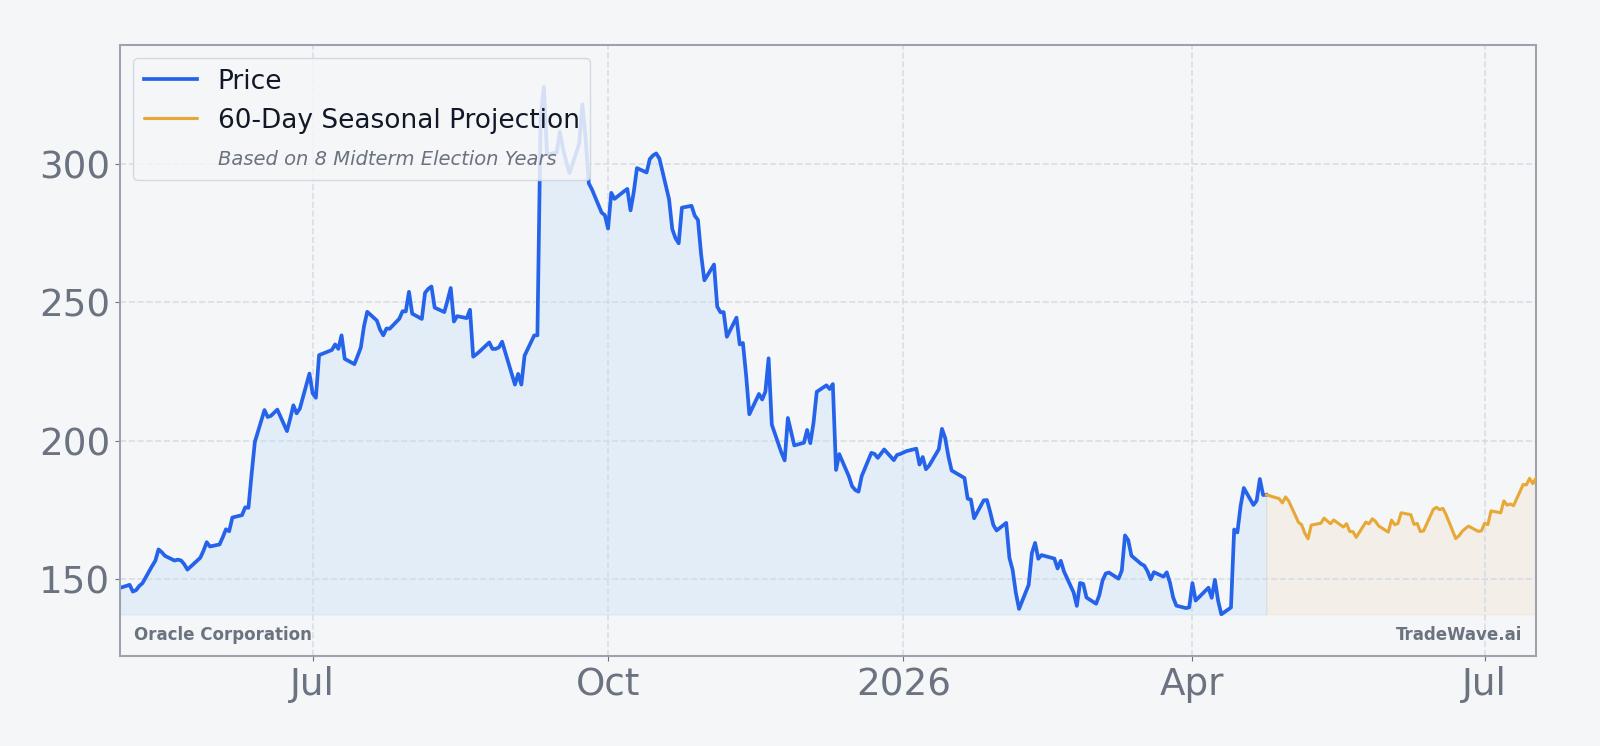
Looking ahead, the key tension for traders is that Oracle’s fundamental story has shifted from “prove the AI spend” to “execute on the AI backlog,” just as the stock approaches a historically strong seasonal regime. The consensus analyst rating sits at Buy, and LSEG data cited by CNBC points to a 335 dollar price target, though that figure reflects expectations formed when the stock traded in a very different range.[1][4][12] For now, the combination of a powerful historical ORCL seasonal trend, a still-elevated volatility profile and a large gap to the prior 52-week high sets the stage for an unusually consequential midterm-year stretch.
Sources
- CNBC, "What Wall Street analysts expect from Oracle earnings" (Dec 10, 2025).
- Yahoo Finance, "Mizuho Reaffirms Oracle Outperform Rating" (Jan 2, 2026).
- Yahoo Finance, "Oracle beats Q3 expectations" (Mar 10, 2026).
- MarketWatch, "Oracle’s stock could surge 80%" (Nov 17, 2025).
- Yahoo Finance, "Oracle stock rockets higher on Q3 earnings beat" (Mar 11, 2026).
- Forbes, "How Oracle's Earnings Impacts Its 2026 Forecast" (Mar 11, 2026).
- Reuters, "Oracle rallies as strong revenue forecast eases concerns" (Mar 11, 2026).
- Seeking Alpha, "Michael Burry bets against Oracle" (Jan 10, 2026).
- Financial Times, "Morgan Stanley thinks you should short Oracle" (Nov 27, 2025).
- CNBC, "Final Trade: ORCL, NVO, VLO, VEA" (Sep 16, 2025).
- CNBC, "Buy Oracle as it continues to benefit from AI craze" (Oct 9, 2025).
About this seasonal analysis
Seasonal pattern data is sourced from TradeWave.ai, which analyzes historical price behavior across annual calendar windows going back up to 30 years. Read the full data methodology or the book The 100-Year Pattern by Afshin Moshrefi (2026 edition). Past performance of seasonal patterns does not guarantee future results. This article is for informational purposes only and does not constitute investment advice.