Oracle Corporation (ORCL) Has Rallied in 8 of 8 Midterm-Year Windows Starting in April
Oracle Corporation is approaching a 360-day midterm-election-year stretch that has never produced a loss in the past eight cycles, just as the stock rebounds from a deep slide and debt worries linger.

Key takeaways
- Oracle Corporation has posted gains in all 8 midterm-election-year windows starting around Apr 11, with an average profit of 24.6% across 360 trading days.
- The upcoming window spans roughly one year from Apr 11, 2026, and is aligned with a long trade direction in the historical pattern.
- Maximum favorable moves inside prior windows have often exceeded 30%, but adverse swings have reached more than 30% in several years, underscoring real drawdown risk.
- Shares trade at $155.52, about 54.6% below the 52-week high of $342.71, after a sharp post-earnings rebound and upgraded long-term revenue guidance.[3][5][6][7]
- Hedge funds and high-profile investors have built short positions against Oracle, citing debt and AI spending concerns, even as the seasonal backdrop has historically favored the long side.[7][8][11]
According to historical data from TradeWave.ai, Oracle’s behavior in midterm election years has followed a surprisingly consistent path around this April start date, and the next iteration of that pattern is close at hand.
Seasonal window
Oracle Corporation has risen in 8 of 8 midterm-election-year windows that begin around Apr 11 and run for 360 trading days, averaging 24.6% gains. Today the stock trades at $155.52, about 54.6% below its 52-week high of $342.71, after a volatile year that has left it well off the peak even with a recent bounce.[3][5][6][7]
Grouping the data by the presidential election cycle matters here because this window captures the heart of the midterm election year and the early part of the year before the presidential election, when policy noise, spending decisions and regulatory signals tend to shift. For a large enterprise software and cloud name like Oracle, those shifts often show up in federal IT budgets, AI infrastructure incentives and corporate confidence, which can all feed into order books and share-price behavior.
This seasonal window begins on Apr 11, 2026 and spans 360 trading days. The historical trade direction is long, and across the last eight midterm-election-year instances Oracle has never logged a losing outcome at the end of the window. Percent Profitable sits at 100%, with 8 winners and 0 losers, and the average profit of 24.6% reflects those all-positive closes rather than a mix of up and down years.
Average winner gains of 24.6% mask a wide range of paths. In 1994 the stock finished the window up 38.88%, while in 2002 it gained only 7.04%, even though both years ultimately ended in the green. The strongest year in this sample on a point-to-point basis was 2006, when Oracle rallied 34.9% from entry to exit, while the softest was 2002, which still managed a single-digit gain despite a much rougher tape earlier in the window.
Intraperiod swings have been large. The best point-to-peak move, known as the maximum favorable excursion, reached 117.14% in 1998, when the stock more than doubled at its strongest point inside the window before settling back by the close. On the downside, the worst drawdown from entry, or maximum adverse excursion, hit -36.04% in that same 1998 window, and several other years saw adverse moves worse than -20%, including 1994, 2002 and 2022.
The TradeWave Ratio (TWR) for this pattern is 1.14, which describes how far price typically travels in the trade direction within the window, independent of the final close. A Sharpe ratio of 1.79 indicates that, based on end-of-window outcomes, the risk-adjusted average return has been strong for a single-stock seasonal pattern, even with the sizable volatility along the way.
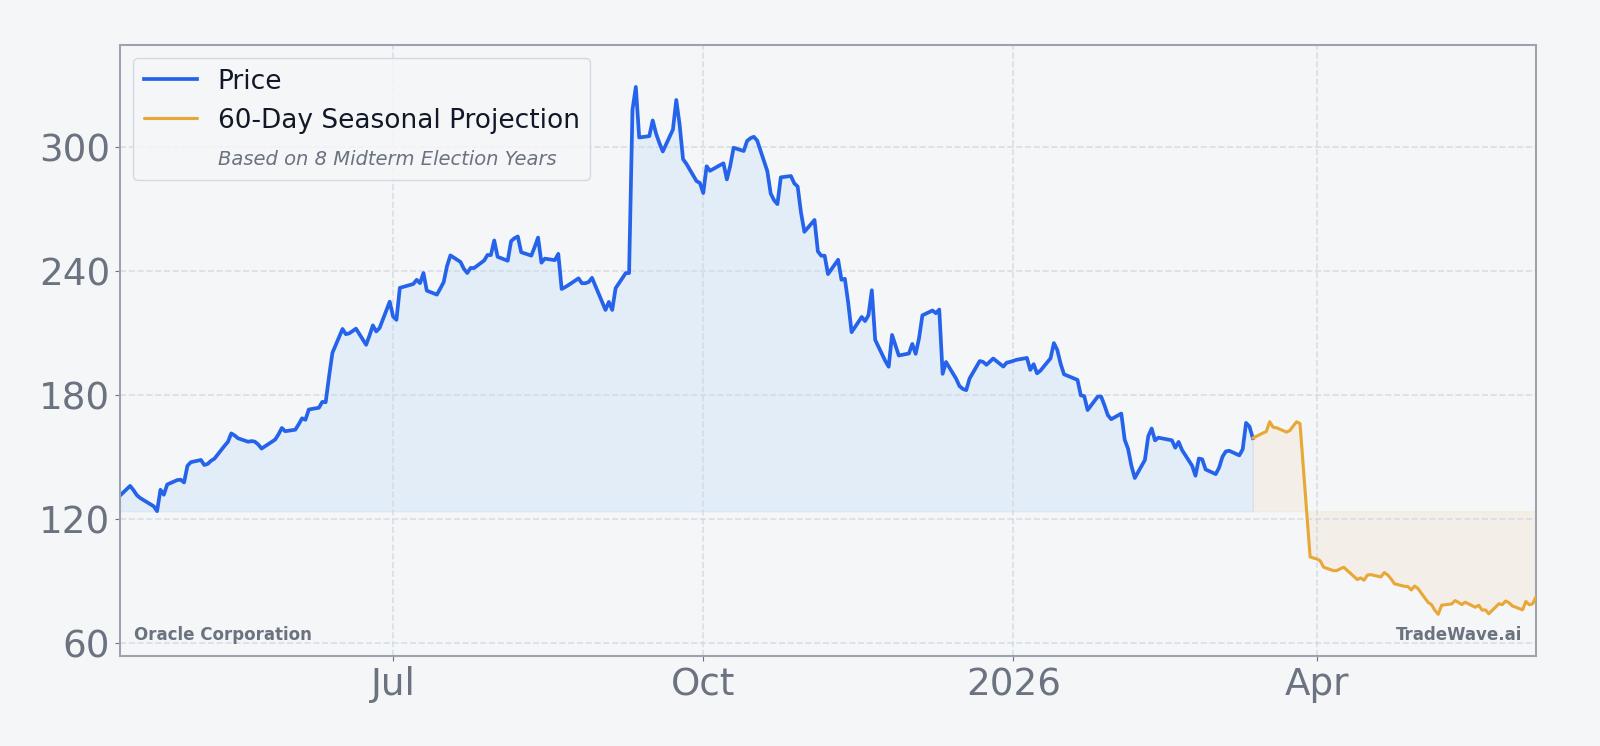
Looking at the historical seasonal trend, the average path across these eight midterm-election-year windows shows a fairly steady upward bias rather than a single explosive burst. Gains tend to build over the full 360-day stretch, with some acceleration in the middle of the window and a tendency for late-window consolidation rather than a straight-line climb.
Year-by-year bars with both peak rallies and worst drawdowns show how often Oracle has swung hard in both directions before finishing higher.
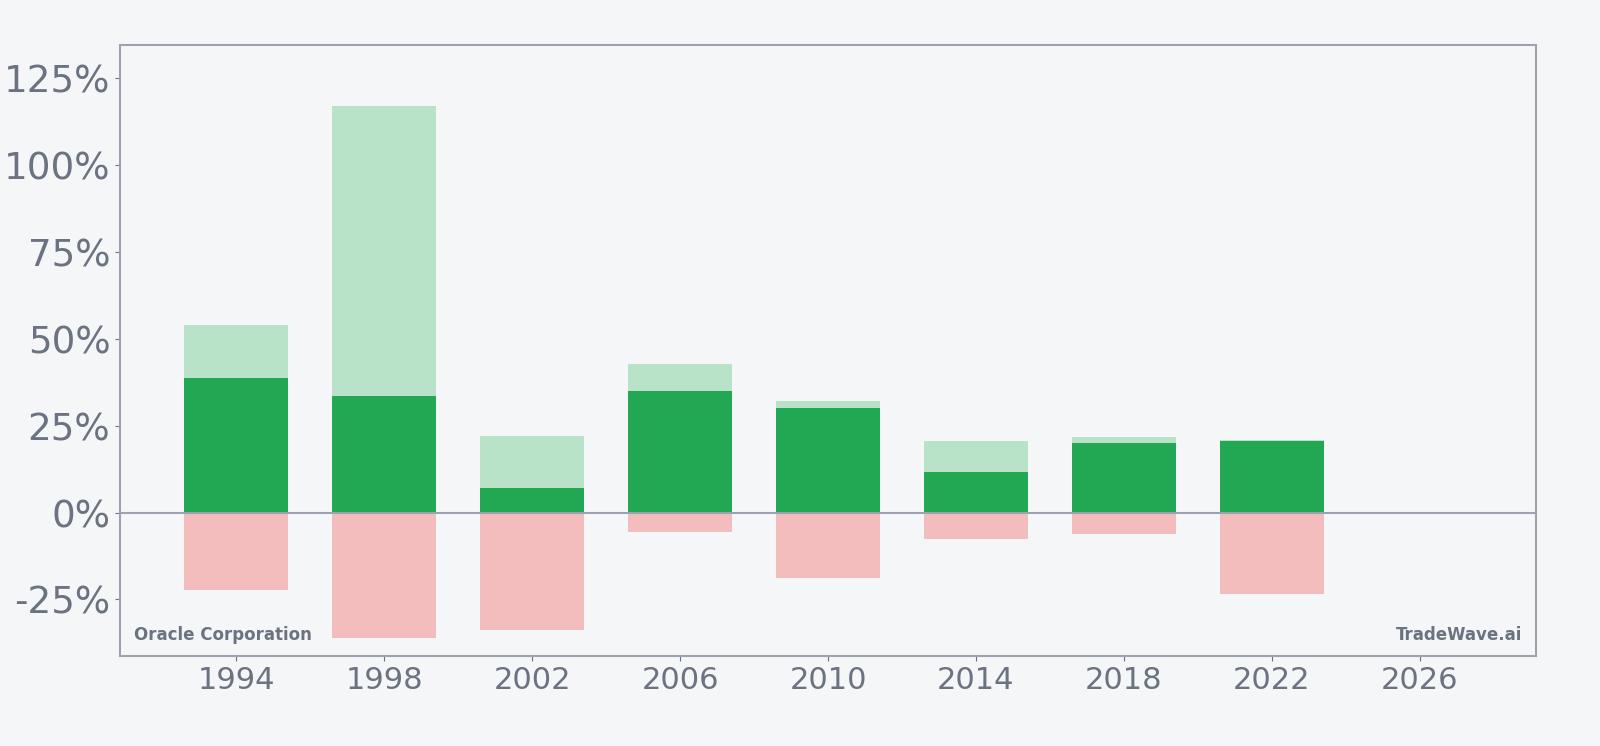
History does not guarantee future results; even in a perfect 8-for-8 record, adverse excursions have topped -30% in some windows, so drawdown risk remains significant.
Add it up: eight midterm-election-year windows, eight winners, and a 24.6% average gain across a full-year stretch that has repeatedly rewarded long exposure while still demanding a strong stomach for volatility.
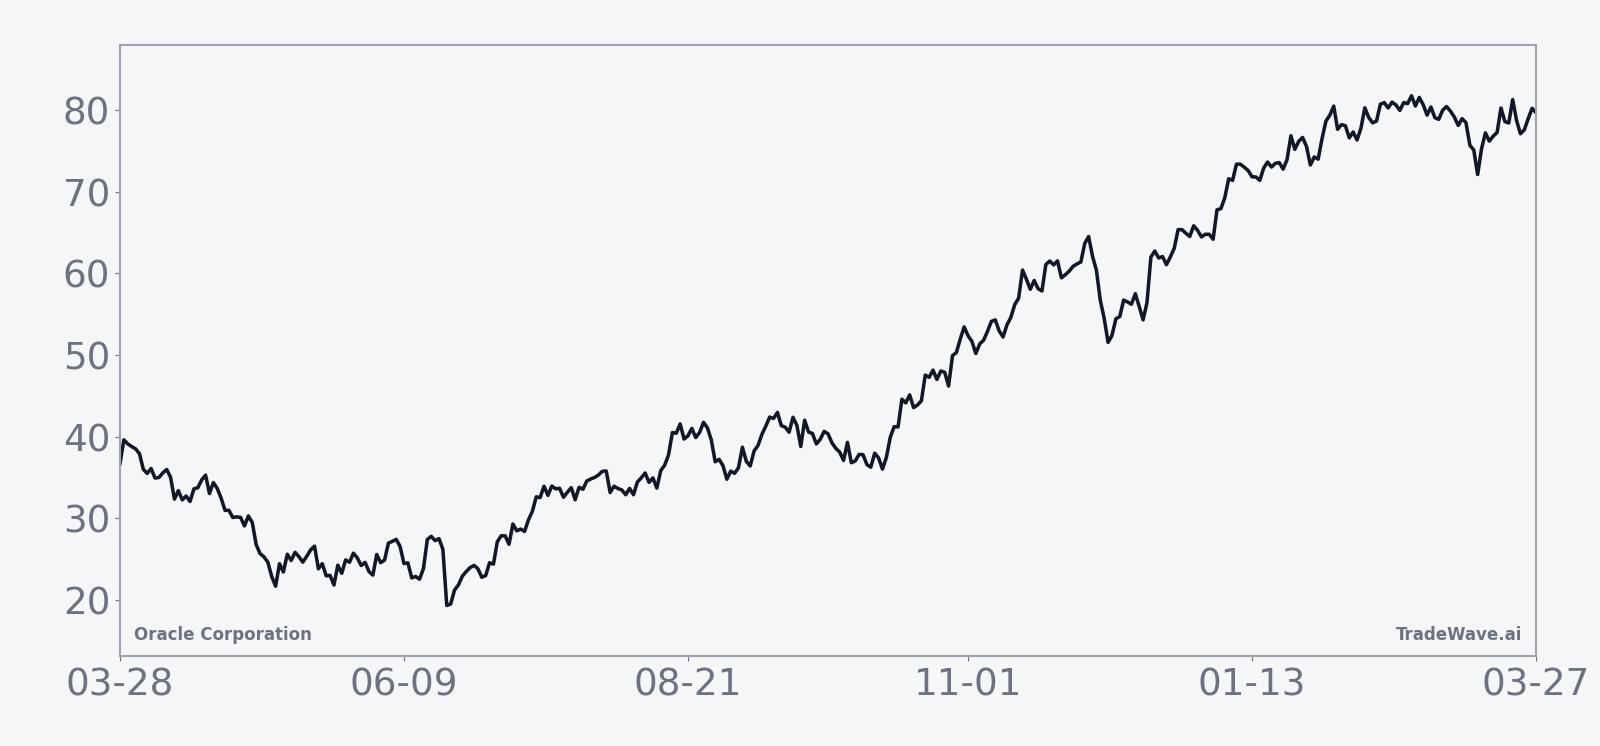
Price and near-term drivers
Oracle shares closed at $155.52 on Friday, up 1.7% on the day, leaving the stock about 54.6% below its 52-week high of $342.71 and down sharply year to date despite a powerful post-earnings rebound.[3][5][6][7] The stock has been whipsawed by enthusiasm over massive AI infrastructure deals and concern about the debt taken on to fund that build-out, creating a choppy backdrop heading into the seasonal window.
On Mar 10, Oracle beat fiscal third-quarter expectations with earnings of $1.79 per share on revenue of $17.19 billion, topping Wall Street estimates on both lines and lifting its 2027 revenue outlook to $90 billion.[3][5][6] The cloud business remained the growth engine, with the segment reaching $8.9 billion in revenue and infrastructure revenue jumping sharply as AI workloads ramped.[3] The stronger forecast helped ease some worries that Oracle’s aggressive AI data center investments would not translate into top-line growth, and the stock surged more than 10% in the immediate aftermath of the report.[5][7]
That rally came against a backdrop of skepticism from some high-profile investors and hedge funds. In January 2026, Michael Burry disclosed a bet against Oracle, signaling bearish sentiment on the name, while other funds have reportedly shorted both the stock and its debt over concerns about leverage and the durability of AI-driven demand.[8][11] Those positions mean that any further upside surprise in earnings or AI deal flow could force shorts to cover into strength, but they also underline how quickly sentiment could swing if growth disappoints.
Macro-wise, Oracle sits at the intersection of AI infrastructure spending and cloud computing, two themes that remain central to the market narrative. The company’s massive AI deals and data center investments are driving growth but also raising questions about balance-sheet risk and the timing of returns, while its cloud segment has been growing at a rapid clip, with infrastructure revenue up strongly year over year.[1][3] In the midterm election year, policy debates over tech regulation, data privacy and government cloud contracts could all influence how that story evolves.
The chart below situates the latest move in its recent multi-month context.
What to watch as the window opens
For traders tracking this pattern, the first marker is the calendar itself: the new midterm-election-year window kicks in on Apr 11 and runs for roughly a year. Historically, the strongest years have not required a perfect start, but deeper early drawdowns have often preceded the biggest eventual rallies, which makes the path of volatility as important as the direction.
On the fundamental side, watch how Oracle’s AI infrastructure pipeline and cloud growth track against the upgraded 2027 revenue target of $90 billion.[3][5][6] Any signs that large AI deals are slipping or that cloud growth is decelerating could embolden existing shorts and test the historical seasonal strength, while continued upside surprises would fit more neatly with the long-biased pattern.
Positioning is the other key variable. The presence of hedge fund shorts and Michael Burry’s bearish stance means options flow, borrow costs and short-interest data will be important tells.[8][11] If short interest continues to build into the window, any upside move could be amplified by covering, whereas a rapid fade in those positions would suggest that the market has already adjusted to the AI and debt story.
Technically, the $150 area and the post-earnings gap zone stand out as near-term levels to monitor. A sustained hold above those bands as the window progresses would be more consistent with prior strong years, while a decisive break lower accompanied by rising volume would signal that this cycle may diverge from the 8-for-8 history, even if the longer-term seasonal tendency remains positive.
Sources
- [1] CNBC, "What Wall Street analysts expect from Oracle earnings" (Dec 10, 2025).
- [2] Yahoo Finance, "Mizuho Reaffirms Oracle (ORCL) Outperform Rating" (Jan 2, 2026).
- [3] Yahoo Finance, "Oracle beats Q3 expectations" (Mar 10, 2026).
- [4] MarketWatch, "Oracle’s stock could surge 80%" (Nov 17, 2025).
- [5] Yahoo Finance, "Oracle stock rockets higher on Q3 earnings beat" (Mar 11, 2026).
- [6] Forbes, "How Oracle's Earnings Impacts Its 2026 Forecast" (Mar 11, 2026).
- [7] Reuters, "Oracle rallies as strong revenue forecast" (Mar 11, 2026).
- [8] Seeking Alpha, "Big Short Michael Burry bets against Oracle" (Jan 10, 2026).
- [9] Financial Times, "Morgan Stanley thinks you should short Oracle" (Nov 27, 2025).
- [10] CNBC, "Final Trade: ORCL" (Sep 16, 2025).
- [11] CNBC, "Buy Oracle as it continues to benefit from AI craze" (Oct 9, 2025).