Oracle Corporation (ORCL) Has Risen in 8 of 8 Midterm May Windows, Averaging 29.54% Gains
Oracle Corporation is nearing a historically powerful midterm-election-year seasonal window just as shares trade near record highs on AI-fueled cloud momentum.

What is the seasonal pattern for Oracle Corporation (ORCL)?
Oracle Corporation has risen in 8 of 8 midterm-election-year windows starting in early May, with an average gain of 29.54% in winning years.
- 8 for 8 in this window, with Oracle averaging 29.54% gains in winning years across the last eight midterm election cycles.
- The upcoming seasonal window begins on May 2, 2026 and runs for 353 trading days, covering the late midterm year into the pre-election year.
- Percent Profitable is 100%, with 8 winners and 0 losers in the historical sample for this long-direction pattern.
- Average profit of 29.54% reflects strong upside across all years, with individual net returns ranging from 7.45% to 42.91%.
- Intraperiod swings have been meaningful, with past years showing double-digit drawdowns even in ultimately profitable windows.
- The pattern aligns with a broader tech and AI seasonal outlook that often strengthens as policy uncertainty fades heading into the presidential pre-election year.
According to historical data from TradeWave.ai, this midterm-election-year window for Oracle has behaved very differently from an average calendar year, and the next iteration is about to open.
How strong is the upcoming seasonal window for Oracle Corporation (ORCL)?
Oracle Corporation has risen in every one of the last eight midterm-election-year windows that start in early May, averaging gains of 29.54% over a 353-day stretch. The stock closed Tuesday at $181.17, up 2.0% on the day and sitting about 47.1% below its 52-week high near $342.71.[4] That combination of a powerful historical seasonal trend and a stock that has already re-rated higher on AI enthusiasm gives traders a clear regime to watch as this window opens in less than two weeks.
Grouping the data by the presidential election cycle matters here because this pattern only looks at the last eight midterm election years, a phase that often features policy uncertainty early on and a stronger risk-on tone as markets pivot toward the pre-election year. For a large-cap software and cloud name like Oracle, that means the seasonal window is capturing a specific mix of fiscal debate, regulatory noise and eventual clarity that has repeatedly lined up with strong stock performance.
This seasonal window begins on May 2, 2026 and spans 353 trading days. Historically, during this period, Oracle Corporation has shown a strong bullish tendency in the long direction, with no losing years in the sample. The Trade Direction is long, so positive returns and rallies have been favorable outcomes for this pattern, while any year that failed to deliver upside would have counted as a loss.
Across those eight midterm-election-year windows, Percent Profitable is 100%, with 8 winners and 0 losers. Average profit across all years is 29.54%, and because there are no losing years in the sample, that figure also represents the average outcome for the entire set. The median gain of 31.09% shows that results have clustered around a high double-digit return rather than being driven by a single outlier.
The per-year table shows how consistent that strength has been. The weakest year in the sample was 2014, when Oracle still gained 7.45% in the window, while the strongest was 1994, with a 42.91% net return. More recent cycles have also participated: in 2022, the stock advanced 31.77% across this same midterm-year window, with an entry price around $70.42 and an exit near $92.79.
Intraperiod swings have been meaningful even in these winning years. Maximum favorable moves, or the best point-to-peak rallies within the window, have ranged from 15.15% in 2014 to a striking 134.68% in 1998, when Oracle more than doubled at its strongest point. Maximum adverse moves, the worst drawdowns from entry during the window, have run as deep as about 30.88% in 1998 and 18.34% in 2010, underscoring that investors have often had to sit through sizable pullbacks on the way to those positive finishes.
The TradeWave Ratio (TWR) for this pattern is 1.2, which means the stock has typically traveled meaningfully in the trade direction within the window, independent of where it ultimately closed. The Sharpe ratio of 2.37 points to a historically strong risk-adjusted profile based on end-of-window outcomes, with the 10.84% standard deviation of returns still leaving a wide enough band for volatility.
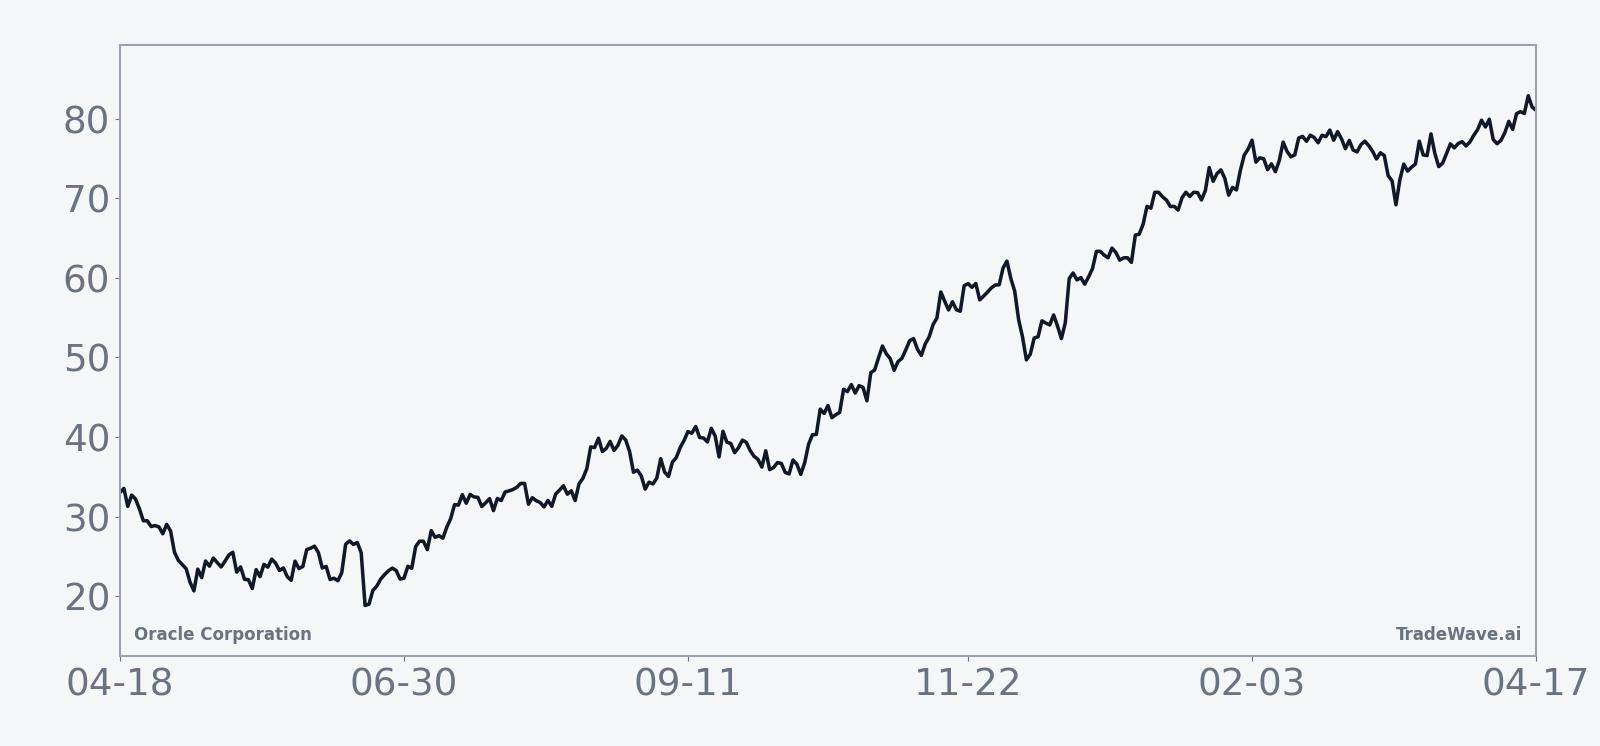
The historical seasonal trend chart for this window shows a fairly steady upward slope rather than a single explosive burst. Gains tend to build across the full 353-day span, with some choppier behavior early in the midterm year and a smoother climb as the calendar transitions into the presidential pre-election year. That shape fits the broader pattern many investors know from index-level seasonality, where midterm-year volatility often gives way to a stronger pre-election stretch.
The cumulative return profile across the eight cycles reinforces that message. Add it up and the pattern has delivered a 672% cumulative gain across those midterm-year windows, with no visible flatlining or multi-year air pockets. The consistency across three decades of data is unusual for a single stock, especially one that has reinvented itself from databases to cloud and AI infrastructure over that span.
In the context of Oracle’s current role as an AI and cloud infrastructure play, that historical seasonality takes on added weight. The company is entering another midterm election year in which policy debates around tech regulation, AI oversight and federal cloud spending are likely to be front and center, yet the pattern suggests that once this May window opens, the stock has often been able to climb that wall of worry.
Year-by-year net returns and intraperiod swings show how consistently Oracle has finished higher while still experiencing sizable drawdowns along the way.
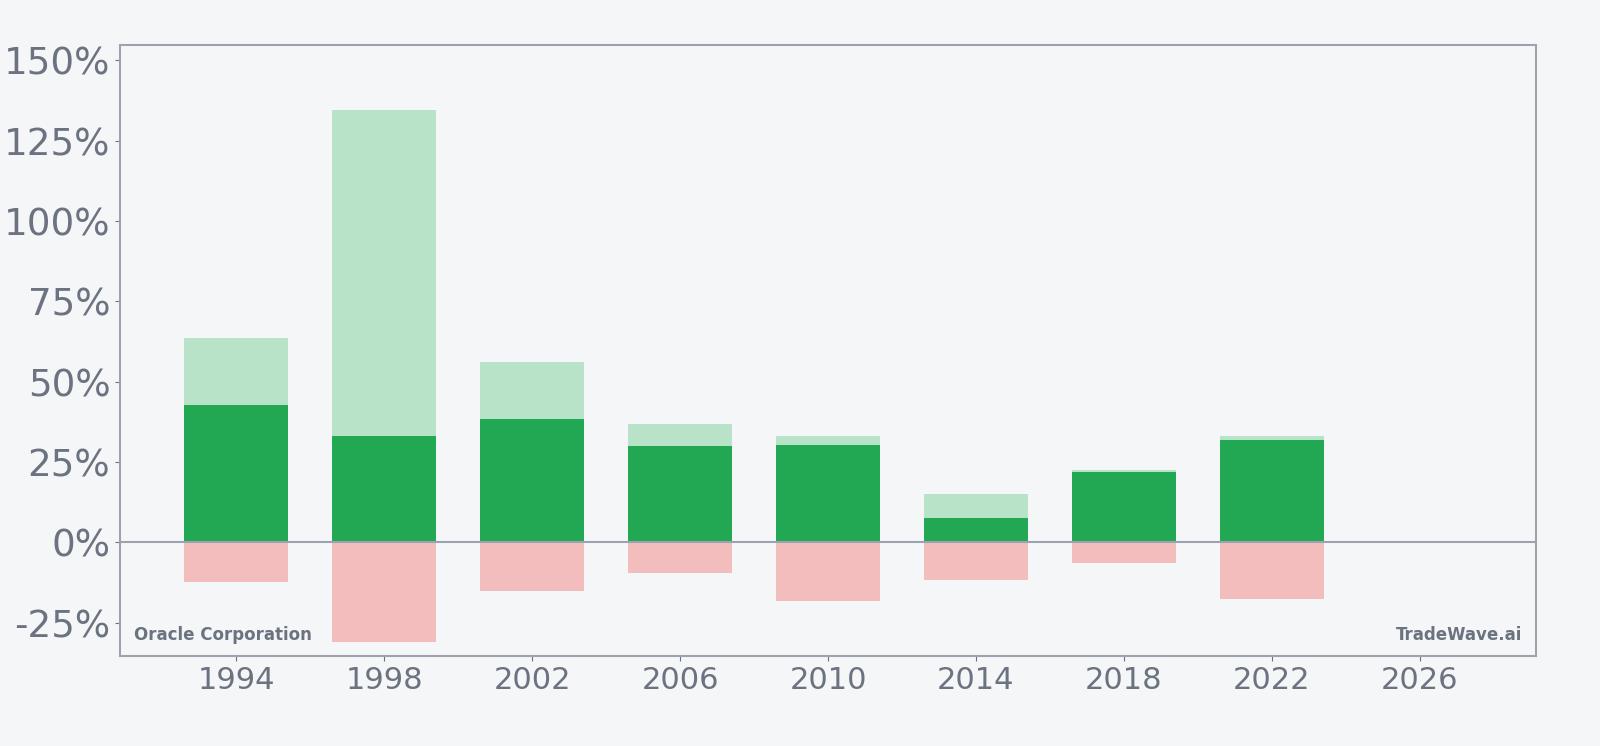
History does not guarantee future results; adverse excursions can be large even in winning windows, and Oracle has previously seen double-digit drawdowns inside this pattern.
Why does Oracle Corporation (ORCL) follow this seasonal pattern?
One likely driver is the way Oracle’s earnings calendar and big customer spending decisions cluster around the midterm and pre-election years, when government and enterprise IT budgets are often reset. Analysts have also pointed to institutional portfolio repositioning into large-cap software and cloud names as policy uncertainty around regulation and fiscal priorities begins to clear heading into the presidential pre-election year.[3] For a company tied closely to AI infrastructure and cloud workloads, that combination of budget cycles and sector rotation may help explain why this specific midterm-year window has been so consistently strong.
What is driving Oracle Corporation (ORCL) today?
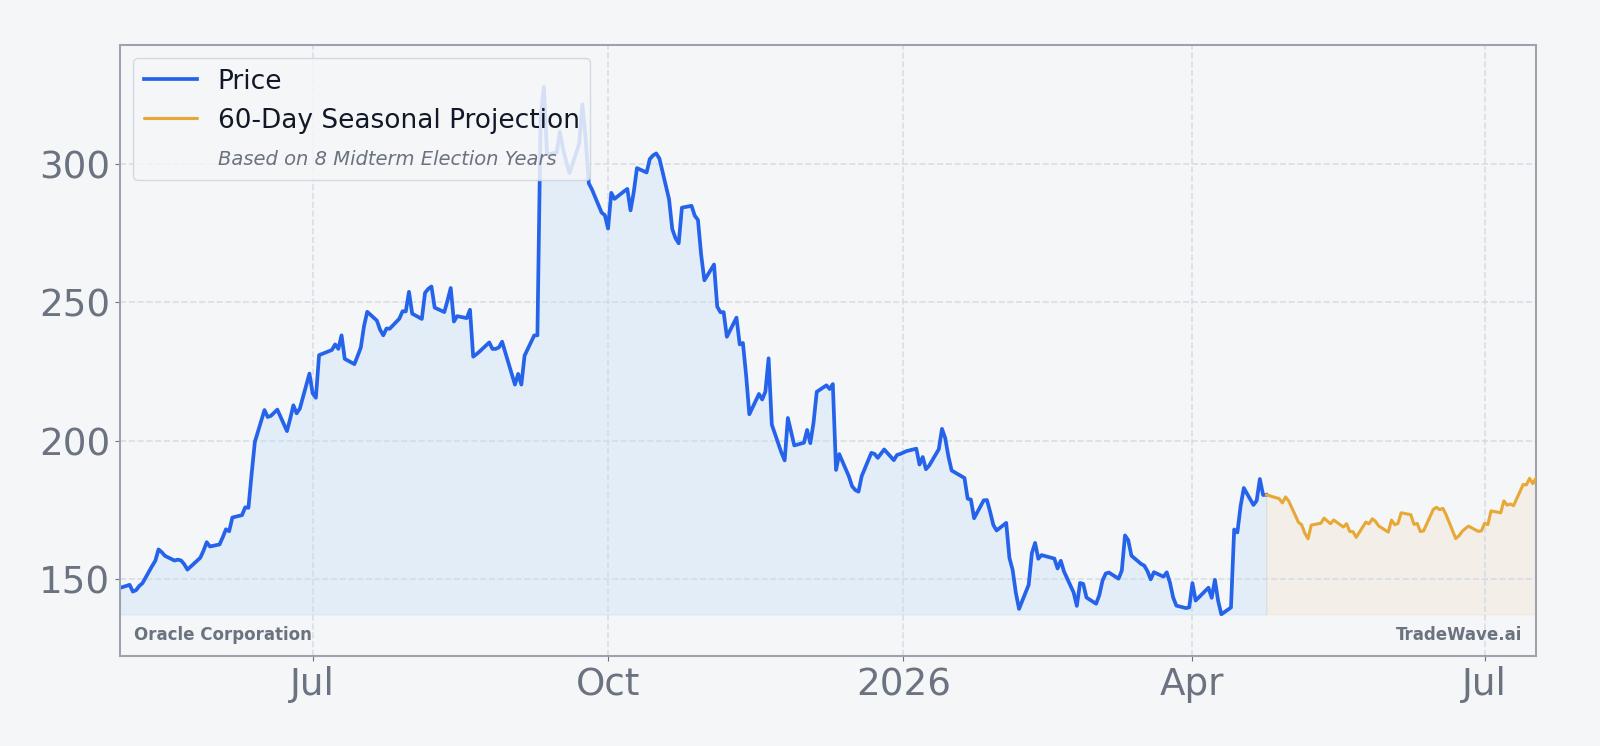
Oracle shares finished Tuesday at $181.17, up 2.0% on the session, as investors continued to digest a blockbuster March quarter that sent the stock surging as much as 14% in early trading after the release.[4] The move leaves Oracle well off its 52-week high near $342.71 but still elevated versus last year’s lows, with the stock having rallied sharply since its AI and cloud narrative took hold.[12]
The latest catalyst was Oracle’s fiscal Q3 2026 report, where the company delivered revenue of $17.19 billion and earnings per share of $1.79, topping Wall Street estimates and prompting management to lift its 2027 revenue outlook to $90 billion.[4] Cloud revenue reached $8.9 billion, up 44% year over year, underscoring how AI infrastructure deals and database migrations are reshaping the company’s growth profile.[5] Guidance for the current quarter calls for total revenue growth of 19% to 21% and cloud revenue growth of 46% to 50%, a pace that keeps Oracle firmly in the conversation with the largest hyperscale and enterprise software players.[5]
That earnings beat and outlook have helped reframe Oracle’s role in the AI trade. In March, coverage from major outlets highlighted how the company’s cloud and AI infrastructure segment is benefiting from accelerating AI spend, including high-profile deals with OpenAI and other large customers.[3] Sector commentary has emphasized that Oracle’s infrastructure-as-a-service revenue has been growing at a rapid clip, positioning the stock as a levered play on AI data center build-out rather than just a legacy database vendor.[3]
At the same time, the stock is not without skeptics. Some institutional investors and strategists have flagged Oracle’s debt load and its reliance on a relatively small number of marquee AI customers as potential pressure points, even as the latest revenue forecast eased concerns about the scale of its AI bets.[12] That tension between aggressive growth investment and balance-sheet risk is part of what makes the upcoming seasonal window so interesting: the historical pattern has been strongly positive, but the path has often involved sharp swings that would test conviction.
The chart below situates the latest move in its recent multi-month context, alongside a short-term seasonal projection.
What should traders watch as this Oracle seasonal window opens?
First, the calendar: the 353-day midterm-election-year window begins on May 2, 2026, so any shift in trend or volatility around that date will be watched closely against the historical pattern. Traders will be looking to see whether Oracle continues to build on its post-earnings strength or instead uses the early part of the window to consolidate after a big run.
Second, key levels. With the stock roughly 47.1% below its 52-week high, the zone between $180 and $200 has become an important battleground for sentiment.[4] A sustained break above that band during the early weeks of the window would rhyme with prior cycles where gains accrued steadily, while a failure to hold recent support could signal that this iteration may diverge from the clean 8-for-8 history.
Third, the policy and macro backdrop. As the United States moves deeper into the midterm election year, debates over AI regulation, cloud security standards and federal IT spending could inject headline risk into large-cap software and infrastructure names. Oracle’s guidance assumes robust AI and cloud demand; any signs that customers are delaying projects because of budget uncertainty or regulatory overhang would be a notable departure from the conditions that supported past midterm-year rallies.[3]
Finally, watch how earnings and guidance evolve across the window. The historical pattern spans multiple reporting cycles, and in prior years Oracle’s strongest seasonal runs have often coincided with a string of beats and raised outlooks. If the company can sustain double-digit cloud growth and keep nudging long-term revenue targets higher, that would align with the bullish seasonal template. A stumble on execution or a reset in AI expectations, by contrast, would test just how durable this 8-for-8 record really is.[4]
Sources
- CNBC, "What Wall Street analysts expect from Oracle earnings" (Dec 10, 2025).
- Yahoo Finance, "Mizuho Reaffirms Oracle (ORCL) Outperform Rating" (Jan 2, 2026).
- Forbes, "How Oracle's Earnings Impacts Its 2026 Forecast" (Mar 11, 2026).
- Yahoo Finance, "Oracle stock rockets higher on Q3 earnings beat" (Mar 11, 2026).
- Forbes, "Oracle Earnings: Shares Pop After Tech Giant Beats Revenue Expectations" (Mar 10, 2026).
- MarketWatch, "Oracle’s stock could surge 80%, says analyst" (Nov 17, 2025).
- Forbes, "Is Oracle Stock Undervalued?" (Jan 13, 2026).
- Seeking Alpha, "Big Short Michael Burry bets against Oracle" (Jan 10, 2026).
- Financial Times, "Morgan Stanley thinks you should short Oracle" (Nov 27, 2025).
- CNBC, "Buy Oracle as it continues to benefit from AI craze" (Oct 9, 2025).
- Reuters, "Oracle marches toward $1 trillion club" (Sep 11, 2025).
- Reuters, "Oracle rallies as strong revenue forecast" (Mar 11, 2026).
- Reuters, "Small AI deflation causes high-pitch Oracle squeak" (Dec 11, 2025).
About this seasonal analysis
Seasonal pattern data is sourced from TradeWave.ai, which analyzes historical price behavior across annual calendar windows going back up to 30 years. Read the full data methodology or the book The 100-Year Pattern by Afshin Moshrefi (2026 edition). Past performance of seasonal patterns does not guarantee future results. This article is for informational purposes only and does not constitute investment advice.