Cognizant (CTSH) Has Fallen in 5 of 6 Midterm Windows, With Shorts Averaging 7.98%
Cognizant is stepping into a historically weak 28-day midterm-year window just as the stock trades near its 52-week low following cautious revenue guidance and an AI infrastructure deal.

What is the seasonal pattern for Cognizant (CTSH)?
Cognizant has fallen in 5 of the last 6 midterm-year windows starting around May 4, with an average 7.98% gain in winning years for the short setup.
- 5 for 6 in this window, with the short side averaging 7.98% gains in winning years across the last six midterm election cycles.
- The 28-day window that begins May 4 has been profitable for shorts 83% of the time, with 5 winners and 1 loser.
- Including every year, the pattern shows a 6% average move in the trade direction, compared with a median outcome of 6.6%.
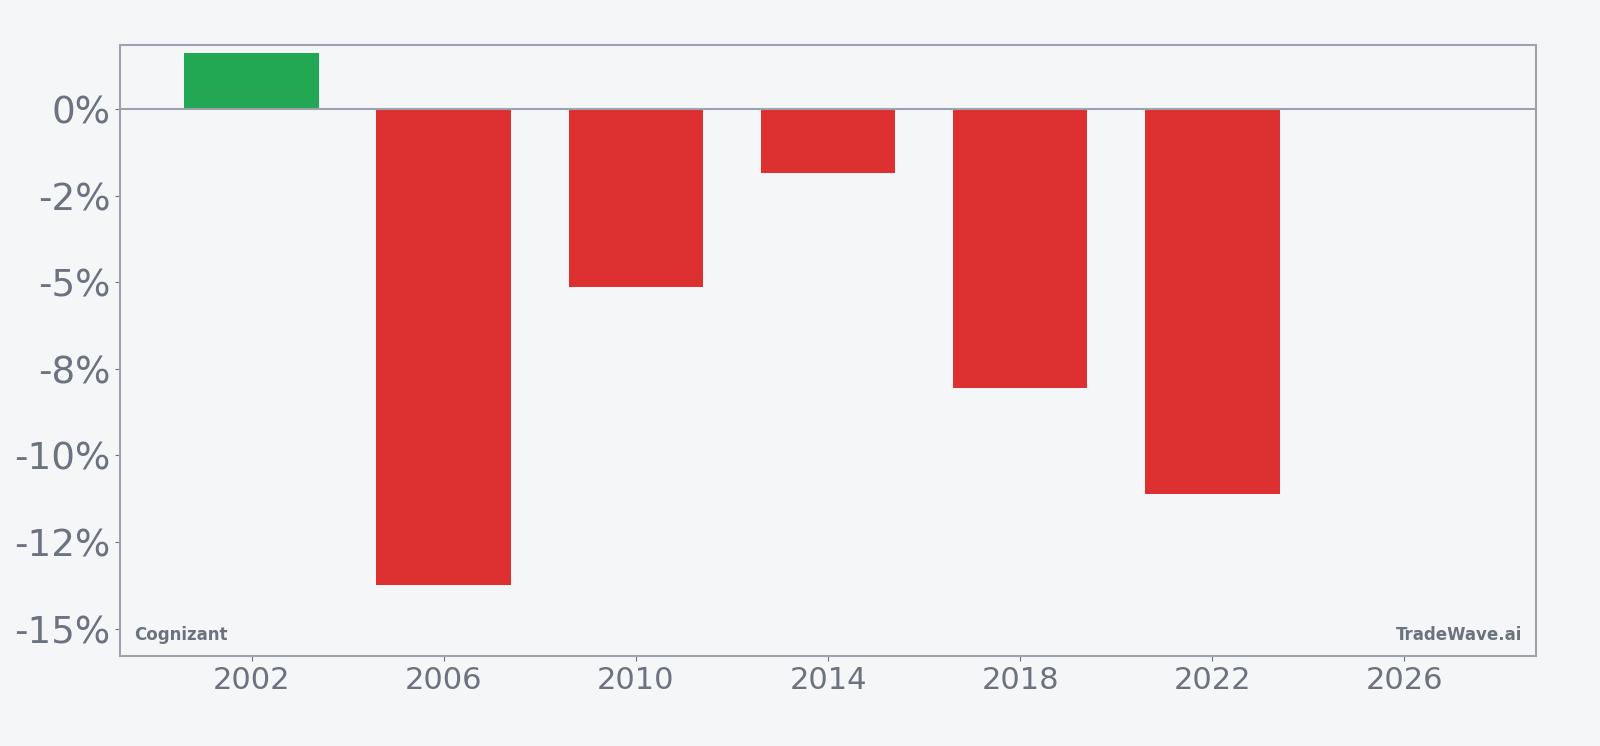
- The worst year for shorts was 2002, when Cognizant rallied 1.61% against the position, while the strongest short-friendly year was 2006 with a 13.74% drop.
- Intraperiod swings have been meaningful, with several years showing double-digit peak drawdowns against entry before the trade moved back in the short direction.
- This CTSH seasonal trend is specific to midterm election years, tying the stock’s pattern to the policy and spending backdrop in the middle of the presidential cycle.
According to historical data from TradeWave.ai, this midterm-year stretch has behaved differently from a typical month for Cognizant, with a clear directional bias that traders often overlook.
How has Cognizant (CTSH) traded in this midterm-year May window?
Cognizant has delivered profitable short trades in 5 of the last 6 midterm election years during the 28 trading days starting May 4, with an average 7.98% move in favor of the short side when the pattern works. The new window is now underway with shares around 52.48, hovering just above a 52-week low of 52.44 and far below last year’s 87.03 high, leaving the stock about 39.7% under that peak.[1]
The presidential election cycle matters here because this CTSH seasonal trend is built only from midterm election years, a phase that often brings policy uncertainty, budget wrangling and more cautious corporate IT spending. Pattern phase and calendar phase are aligned: the current year is a midterm election year, and the lookback covers the last six midterm cycles, so the comparison is apples to apples rather than a blend of very different macro regimes.
Historically, the trade direction for this window has been short, meaning the pattern is defined by years when Cognizant drifted lower or sold off during this slice of the calendar. Percent Profitable sits at 83%, with 5 winning short years and just 1 losing year, so the bias has been clear even across different macro backdrops. When the short worked, the average gain in the trade direction was 7.98%, while including every year, winners and losers together, the average move was still a 6% benefit to the short side.
The per-year table shows how that plays out in practice. In 2006, the strongest year for the pattern, Cognizant fell 13.74% over the window, a clean win for shorts. In 2022, another midterm year, the stock dropped 11.11% across the same dates, again lining up with the historical CTSH seasonal trend. The lone losing year for shorts was 2002, when the stock rose 1.61% during the window, a relatively modest move against the trade compared with the size of the best short-friendly years.
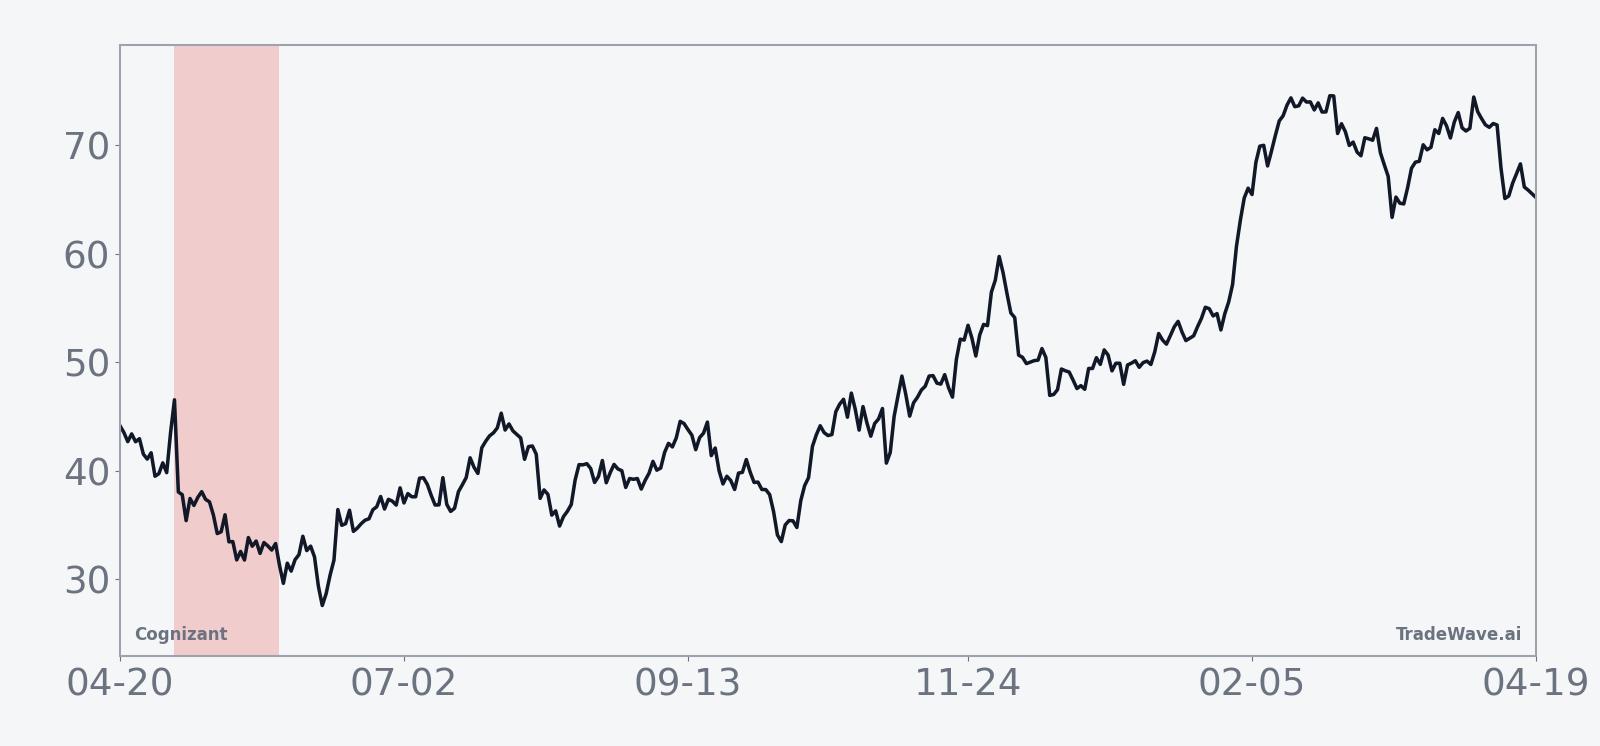
The historical seasonal average suggests that weakness for Cognizant in this window has tended to build gradually rather than collapse in a single day. The trend chart slopes steadily in favor of the short side, with relatively few sharp reversals, which fits a pattern of grinding downside rather than a one-off shock. That kind of profile can matter for traders who care about path, not just end points.
The combined net, best-case and worst-case bars highlight how far CTSH has tended to move in both directions inside this window.
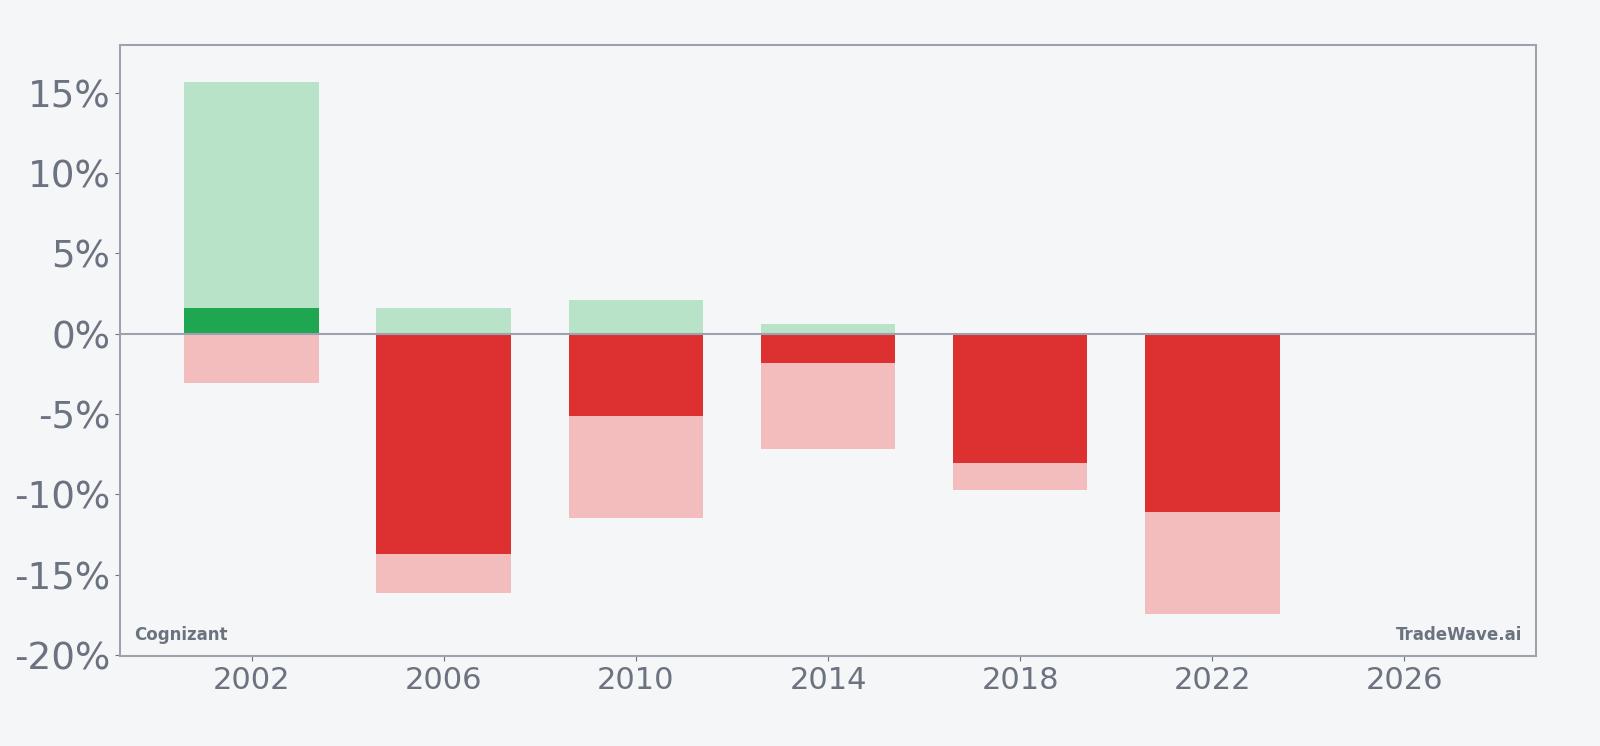
The bars with maximum favorable and adverse excursions show that even in winning short years, Cognizant has often staged sizable rallies inside the window before rolling over. In 2010, for example, the final net move was a 5.14% drop, but the worst intraperiod drawdown from entry was 11.49%, meaning the stock moved sharply against the short before ultimately finishing lower. In 2006, the maximum adverse move was 16.13% even though the final result was a strong 13.74% win for shorts, underscoring that this CTSH trading window has historically combined a clear downside bias with real two-way volatility.
History does not guarantee future results; adverse excursions can be large even in winning windows, so traders using this pattern have historically faced meaningful drawdowns along the way.
Why does Cognizant (CTSH) follow this seasonal pattern?
One likely driver is the way midterm election years intersect with enterprise IT budgeting and deal timing. Analysts have pointed to cautious IT spending and macro uncertainty as recurring themes for Cognizant, which can weigh on bookings and revenue growth around this part of the year when budgets are revisited and projects are delayed.[1] The pattern may also reflect sector rotation inside large-cap tech and IT services as investors rebalance exposure ahead of the second half, when policy clarity and spending visibility often improve.
What is driving Cognizant (CTSH) today?
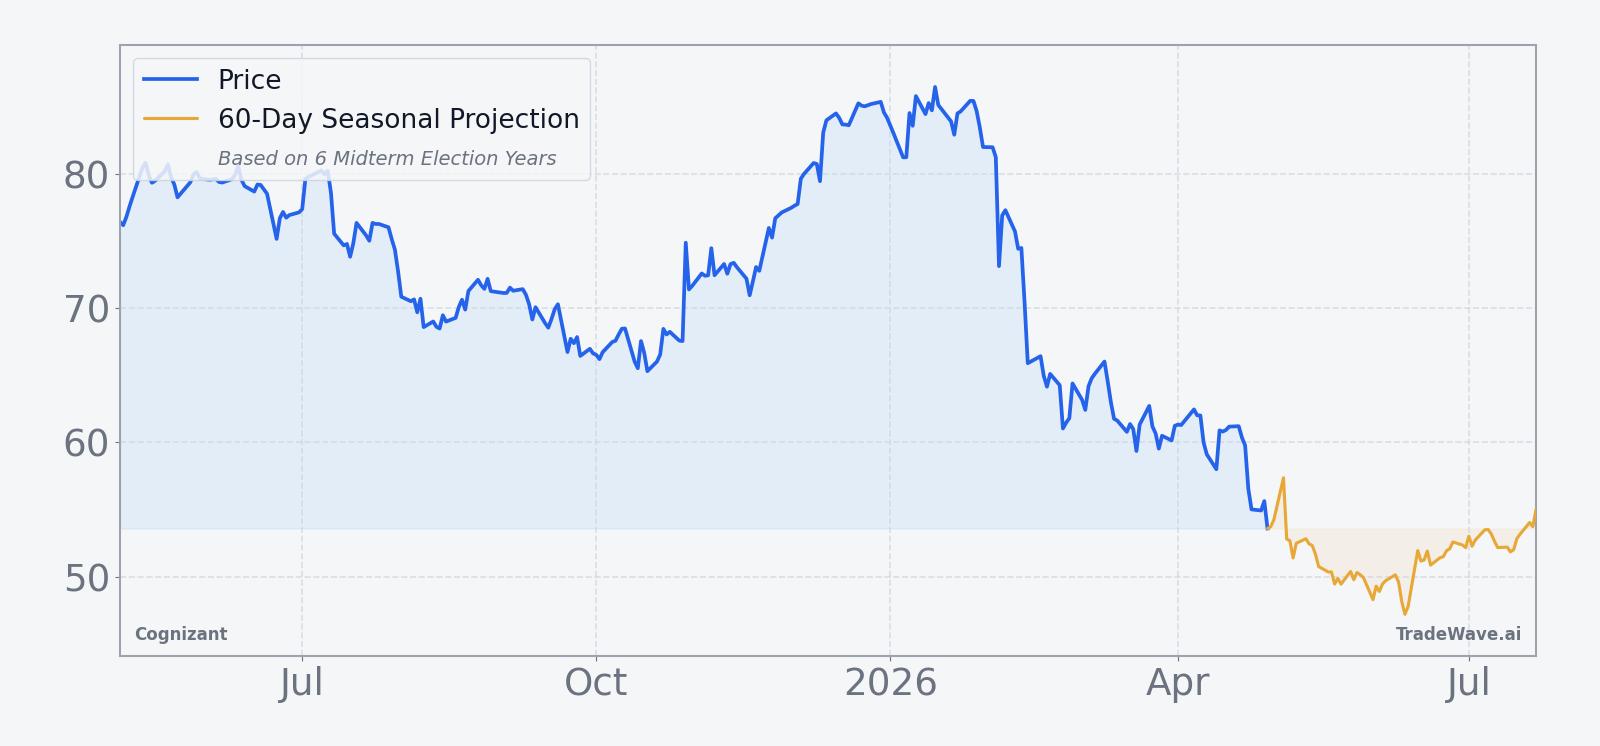
Cognizant shares last traded near 52.48, down about 0.8% on the day and roughly 39.7% below their 52-week high of 87.03, with the stock sitting just above a fresh 52-week low of 52.44 after a tough month that saw a 10.84% slide.[1] The latest pressure followed Cognizant’s Apr 29 earnings report, where Q1 revenue of 5.41 billion dollars landed in line with expectations but Q2 revenue guidance of 5.45 billion to 5.52 billion dollars came in below Wall Street’s 5.56 billion dollar consensus as management cited cautious IT spending and macroeconomic uncertainty.[1] On the same day, the company announced a 600 million dollar deal to acquire Astreya, a move aimed at strengthening its AI infrastructure and data center services footprint as clients ramp up demand for AI and cloud integration.[3]
The chart below situates the latest move in its recent multi-month context, including a 60-day seasonal projection overlay that reflects how this midterm-year window has behaved in prior cycles.
In the near term, investors are weighing two competing narratives. On one side, Cognizant’s full-year 2026 revenue outlook of 22.14 billion to 22.66 billion dollars is above prior analyst estimates, reflecting strong demand for AI and cloud services that could support a rebound once macro headwinds ease.[2] On the other, management’s more cautious near-term guidance and commentary about clients trimming or delaying IT projects tie directly into the macro theme of slower enterprise spending, which has already shown up in softer health sciences revenue versus expectations.[1] That tension between structural AI growth and cyclical IT hesitation is the backdrop against which this historically weak CTSH seasonal window is opening.
What should traders watch in this Cognizant seasonal window?
For this 28-day stretch, the first thing to watch is whether Cognizant continues to hug or break below the 52.44 level that marked its 52-week low as the window opened.[1] A sustained move below that line with rising volume would rhyme with prior midterm-year patterns where the stock drifted or broke lower across the window, while a sharp bounce that holds above the low would look more like the lone losing year for the short setup. Second, earnings follow-through matters: any revisions to client spending plans or updates on the Astreya integration could either reinforce the cautious IT narrative or shift focus back to the AI and cloud growth story that underpins the company’s full-year guidance.[1][2][3]
Traders should also keep an eye on how Cognizant trades relative to other IT services and AI-exposed names. If sector peers stabilize while CTSH continues to lag, that would suggest company-specific execution or integration concerns are dominating this window. If the whole group remains under pressure as macro uncertainty lingers, then the historical midterm-year pattern of softer performance into early summer would be playing out against a broader risk-off backdrop. Finally, behavior inside the window will be telling: a grind lower with intraday rallies that fade would echo the historical CTSH seasonal trend, while a decisive upside break that shrugs off the 52-week low would mark a clear departure from how this midterm slice has traded in the past.
Sources
About this seasonal analysis
Seasonal pattern data is sourced from TradeWave.ai, which analyzes historical price behavior across annual calendar windows going back up to 30 years. Read the full data methodology or the book The 100-Year Pattern by Afshin Moshrefi (2026 edition). Past performance of seasonal patterns does not guarantee future results. This article is for informational purposes only and does not constitute investment advice.