GE Aerospace (GE) Near $282 Runs Into 150-Day Midterm Stretch That Has Favored Declines
GE Aerospace is heading toward a historically weak 150-day midterm-election-year window even as the stock trades near $282 after a powerful run and solid fundamentals.

What is the seasonal pattern for GE Aerospace (GE)?
GE Aerospace has fallen in 9 of 10 midterm-election-year windows starting around May 5, with an average 9.58% gain in winning years for the short side.
- 9 for 10 in this window for short trades, with an average 9.58% profit in winning years and 8% across all years.
- The seasonal window starts May 5 and runs 150 trading days across the last 10 midterm election years, forming a historically weak stretch for the stock.
- Percent Profitable is 90%, with 9 winners and 1 loser for the short direction in this GE seasonal trend.
- Average loss in the lone losing year is 2.45%, showing that the one squeeze against shorts has been relatively contained compared with typical winners.
- Intraperiod swings have been wide, with past years showing double-digit peak run-ups and drawdowns, underscoring a high-volatility GE Aerospace trading window.
- Sharpe ratio of 1.03 and a TradeWave Ratio of 1.82 point to a historically attractive risk-adjusted profile for traders aligned with the short-side pattern.
According to historical data from TradeWave.ai, this upcoming midterm-year stretch has behaved very differently from an average calendar period for GE Aerospace, and the next iteration is about to open.
How has GE Aerospace (GE) traded in this midterm-year window?
GE Aerospace has dropped in 9 of the last 10 midterm-election-year windows that begin around May 5 and run for 150 trading days, with short trades averaging 9.58% gains in winning years. Shares finished Thursday at $282.34, up 2.2% on the day and sitting about 18.7% below their 52-week high of $347.47.[5] That combination of a strong multi-year rally and a historically weak midterm window gives traders a clear calendar line to watch as the next phase of the presidential cycle approaches.
The presidential election cycle matters here because this pattern only looks at the last 10 midterm election years, a phase that has often brought policy uncertainty, shifting defense budgets and choppier trading for industrial and aerospace names. Grouping by midterm years strips out the noise from election-year rallies or post-election hangovers and focuses on how GE tends to behave when Washington is in the middle of the four-year cycle and Congress is on the ballot.
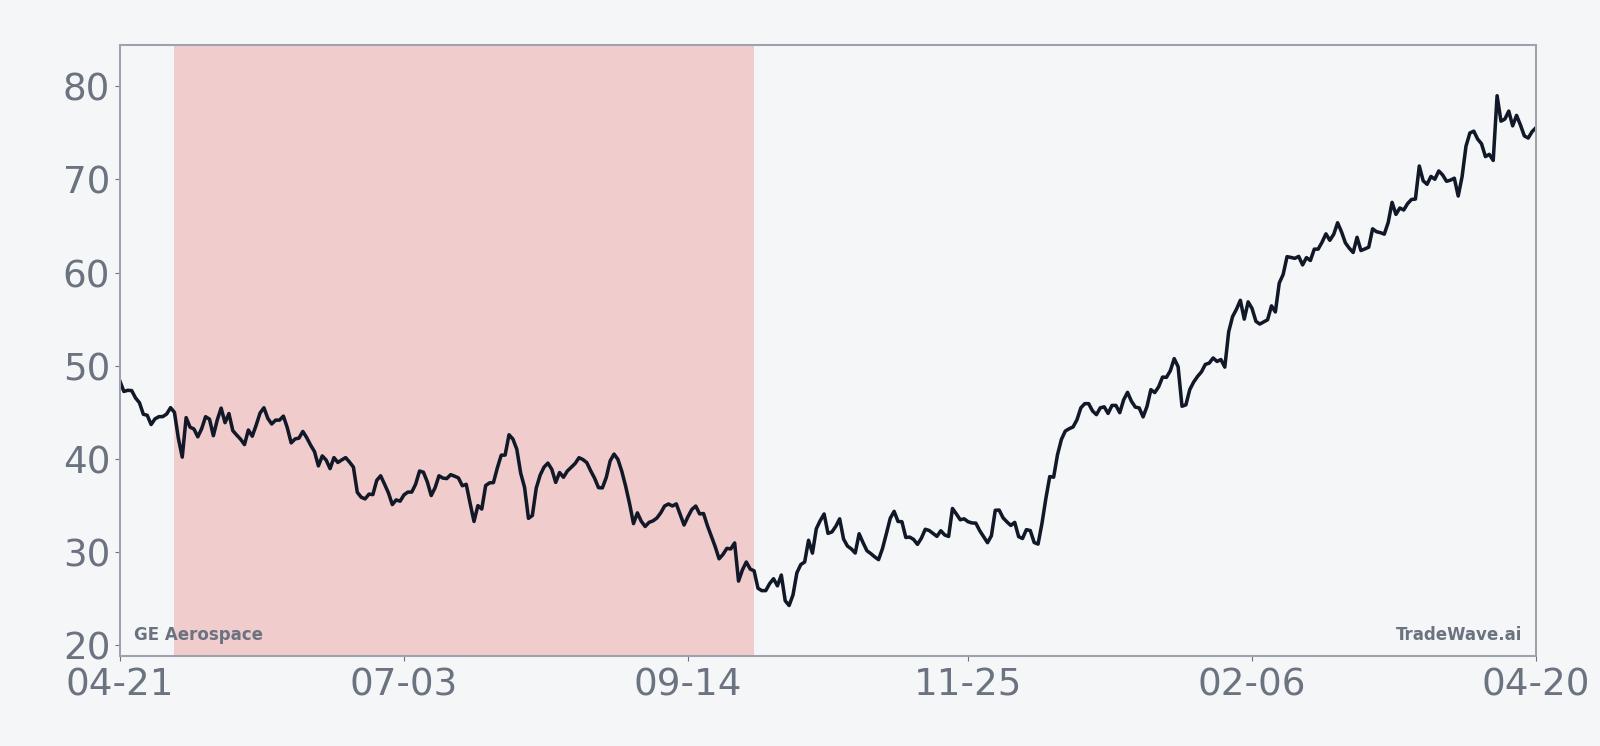
The historical seasonal average shows that weakness for the stock has tended to build gradually rather than in a single air pocket. For short trades, the typical pattern is a grind lower across the window, with the bulk of favorable moves accruing in the middle third of the period rather than right after entry. That fits a picture where early optimism around midyear catalysts gives way to more cautious positioning as the midterm campaign and budget debates heat up.
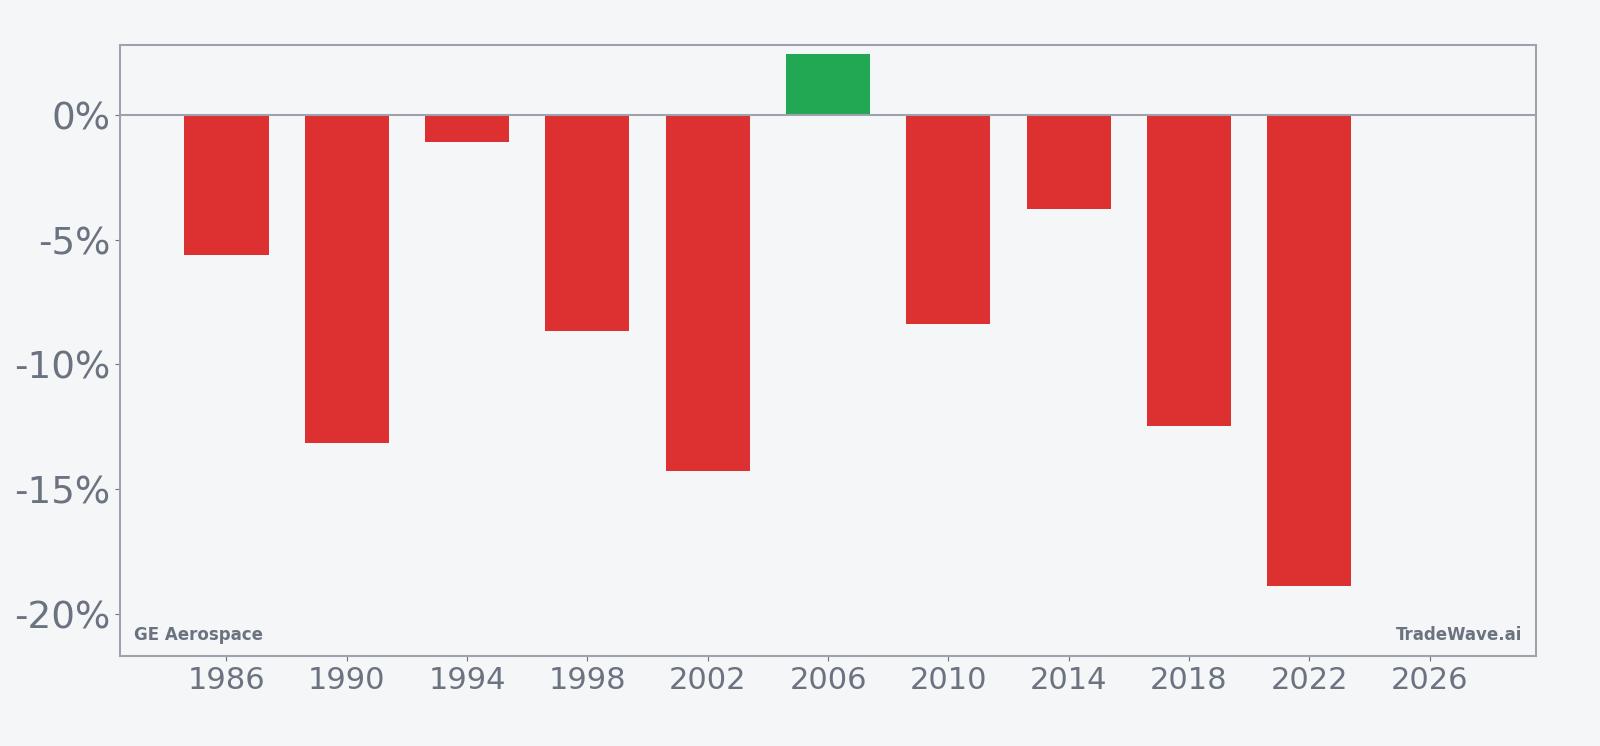
Across the 10 midterm years in the sample, short trades have been profitable in 9, with only one year delivering a loss of 2.45% against the pattern. Average profit in winning years is 9.58%, while the all-years average, which includes that losing year, comes in at 8%. Add it up and the cumulative return for the short side across these windows is 119%, a sizable haul for a single recurring slice of the calendar.
Intraperiod swings have been large. In the weakest year for the stock, 2022, the short trade finished up 18.88% with a worst drawdown from entry of 23.65% and only a modest 3.57% peak move against the short side. In the one losing year for shorts, 2006, the stock rallied 2.45% over the window, with a maximum 8.13% adverse move against the trade and only a 3.06% favorable excursion, a reminder that even in this bearish seasonal pattern, squeezes can appear.
Looking across individual years, some of the sharpest short-side wins came in 2002 and 2022, when net returns for the pattern were 14.28% and 18.88% respectively, both accompanied by deep intraperiod drawdowns of more than 23%. That mix of strong end-of-window results and heavy mid-window turbulence is why the Sharpe ratio sits at 1.03 while the TradeWave Ratio is higher at 1.82, reflecting how far price has tended to travel in the trade direction inside the window.
The combined net, peak favorable and peak adverse moves by year underline how much room GE has historically had to swing inside this window.
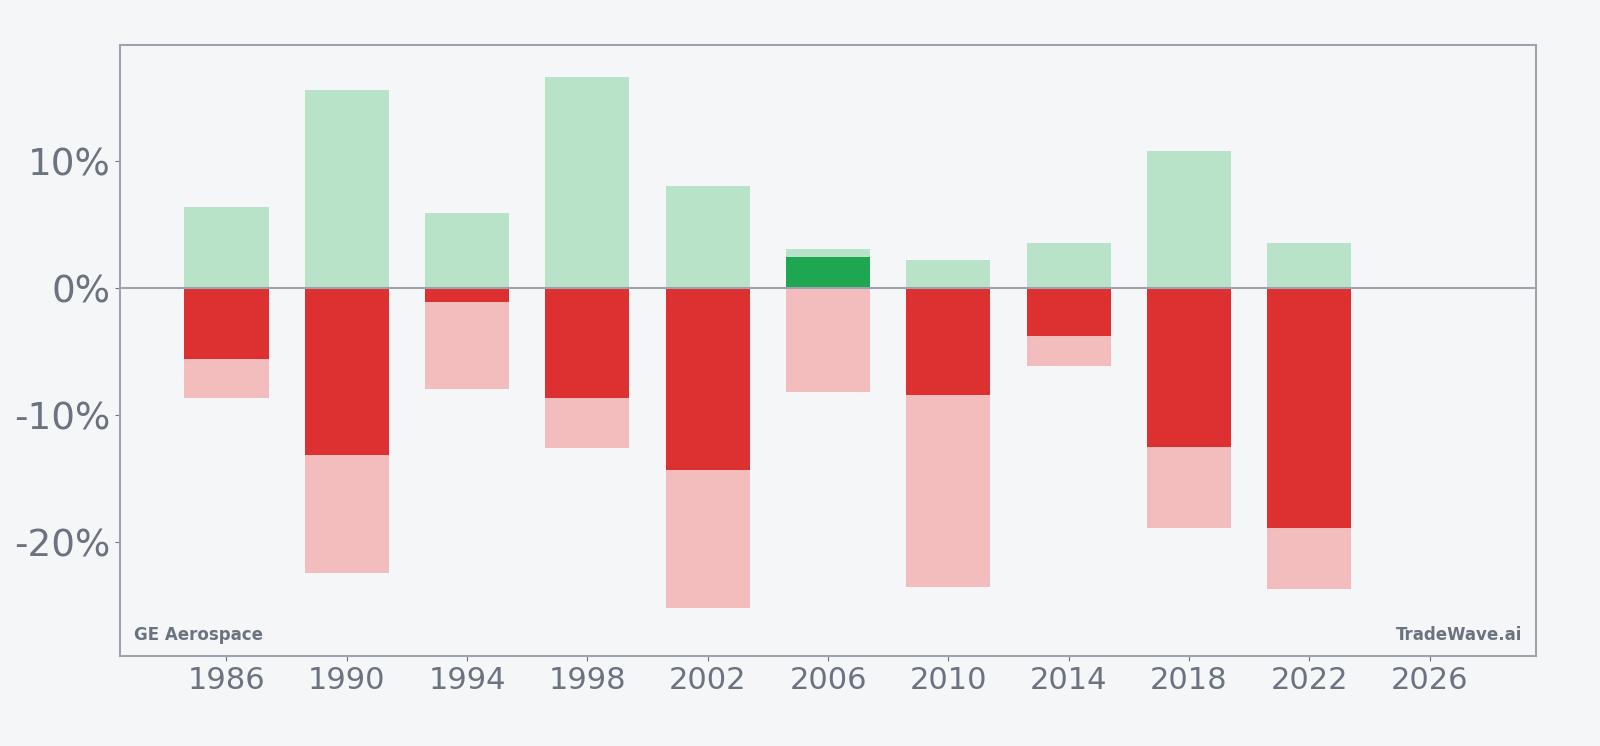
Viewed together, the per-year bars show a clear bias toward negative net returns for the stock and sizable favorable excursions for shorts, but also repeated double-digit adverse swings that would have tested conviction. The pattern is clear: this window has favored short-side exposure in 9 of 10 midterm election years, but it has rarely been a smooth ride.
History does not guarantee future results; adverse excursions (MAE) can be large even in winning windows.
Why does GE Aerospace (GE) follow this seasonal pattern?
This midterm-year pattern may reflect a mix of earnings timing, defense and aerospace budget debates and institutional portfolio repositioning around the policy calendar. One likely driver is that midyear often brings clarity on airline capex, government spending and regulatory shifts, which can cool expectations after strong first-half optimism. Analysts have also pointed to sector rotation in midterm years, when investors sometimes trim industrial and aerospace winners to fund moves into more defensive or rate-sensitive areas as election noise builds.
What is driving GE Aerospace (GE) today?
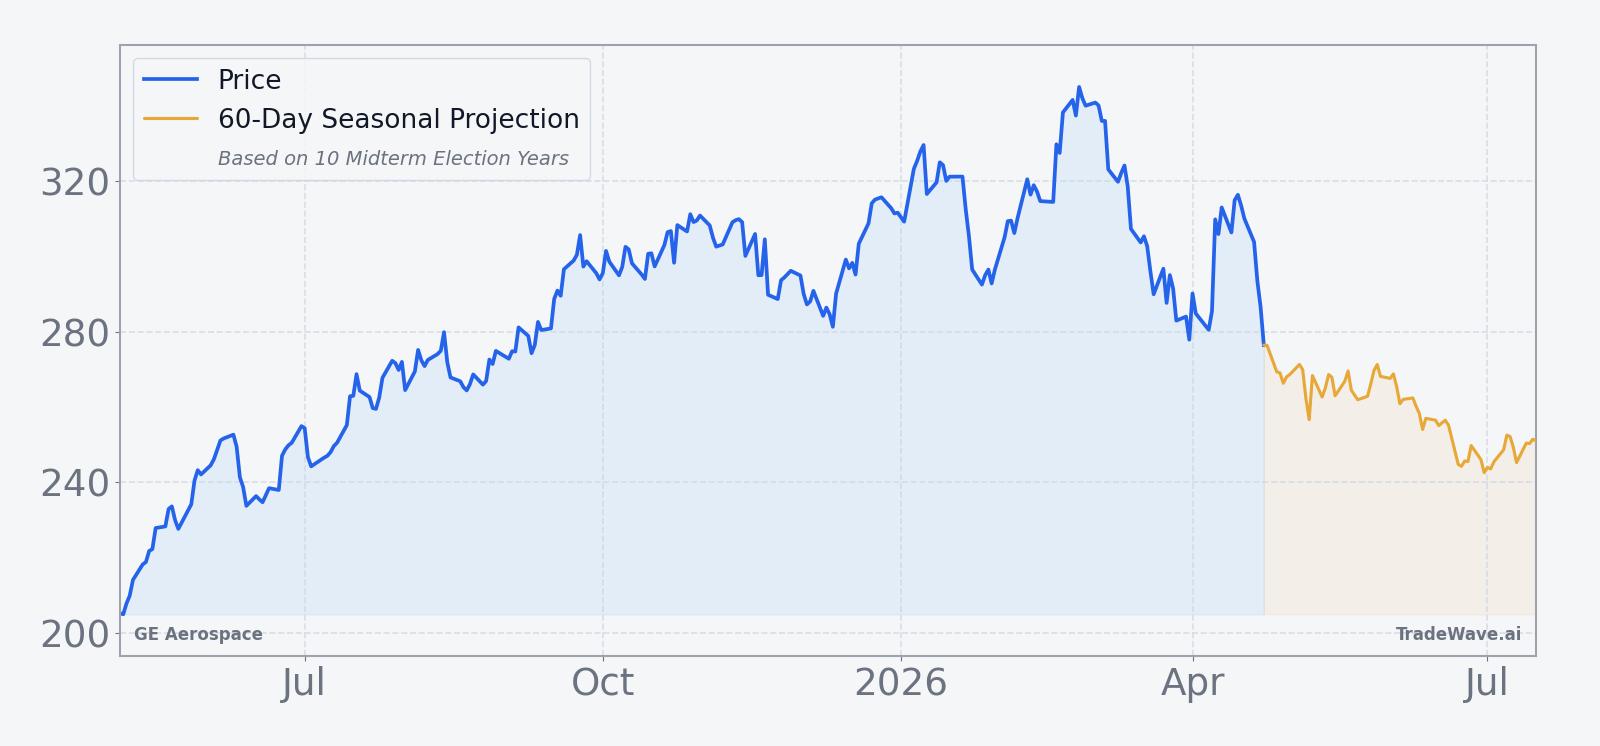
GE Aerospace closed at $282.34 on Thursday, up 2.2% on the session, with roughly 8.6 million shares changing hands against a 20-day average volume of about 6.4 million.[5] The stock has pulled back 4.79% over the past month and now trades about 18.7% below its 52-week high of $347.47, but it remains well above the 50-day moving average of $309.71, underscoring how strong the prior run has been.[5] On Apr 21, Reuters reported that GE Aerospace reaffirmed its outlook even as higher fuel costs threatened to slow flight growth, highlighting both confidence in its 2026 profit range and the macro risks facing airlines and engine suppliers.[5]
Fundamentally, the company is still riding a powerful earnings story. In 2025, GE Aerospace raised its profit forecast on robust aftermarket demand as airlines kept older jets flying longer, boosting high-margin maintenance and service revenue.[6][7] The company has also guided to full-year 2025 adjusted EPS of $6.00 to $6.20 and projected 2026 adjusted profit of $7.10 to $7.40 per share, numbers that have helped underpin a Buy consensus rating and a $355.09 price target from GuruFocus as of early 2026.[2][6] Sector-wide, strong demand for engines and services tied to the air travel rebound and production delays at competitors has continued to support the aerospace and defense group, even as geopolitical tensions and regulatory scrutiny add headline risk.[1][2][5]
Insider activity has tilted toward selling in recent months, with about 8,000 shares sold over the past three months, a modest but notable signal that some executives are taking chips off the table after the stock’s big move.[2] At the same time, commentary from high-profile market voices has remained constructive, with television analysts earlier this year highlighting what they described as “extraordinary” self-improvement in GE Aerospace’s operations and balance sheet.[8][9] That mix of strong fundamentals, stretched technicals and light insider selling sets the stage for how investors may react as the historically weak midterm-year window opens in early May.
The chart below situates the latest move in its recent multi-month context and overlays the near-term seasonal projection.
What should traders watch in this GE Aerospace (GE) window?
For this midterm-year stretch, the first marker is how GE trades as the May 5 window opens: if the stock continues to grind higher despite the historical pattern, it would signal that current fundamentals are overpowering the usual seasonal drag. The second is how price behaves around the 50-day moving average and the $300 area, which has been a key reference point in prior pullbacks; sustained trading below that band during the window would be more in line with the historical short-side bias.[5]
Macro and policy catalysts also matter. Any shift in airline capacity plans, fuel prices or defense spending headlines could either reinforce or blunt the typical midterm-year weakness for industrial and aerospace names.[5] Traders should watch upcoming earnings commentary for signs that aftermarket demand is cooling or that airlines are pushing back on pricing, both of which have historically weighed on sentiment when they appear in the middle of the cycle.[6][7]
Finally, positioning and insider behavior will be important tells. If insider selling continues to build from the roughly 8,000 shares sold over the past three months, or if options and volume data start to show more aggressive hedging, that would align with the historical pattern of investors de-risking into this window.[2] If, instead, insiders turn into net buyers and the stock shrugs off the seasonal headwind, it would be a clear sign that this midterm-year playbook is being rewritten in real time.
Sources
- [1] Forbes, "GE Aerospace Stock Surged 65%: Here’s Why," Oct 16, 2025.
- [2] GuruFocus, "GE Partners in Aviation Research to Advance Aerospace Technology," Feb 2, 2026.
- [3] MarketWatch, "GE’s stock surges toward a record after a big profit beat and raised outlook," Oct 21, 2025.
- [4] Forbes, "Is GE Stock Fully Valued Around $300?," Jan 23, 2026.
- [5] Reuters, "GE Aerospace holds outlook as fuel surge slows flight growth, tests airlines," Apr 21, 2026.
- [6] Reuters, "GE Aerospace raises 2025 profit forecast on robust aftermarket demand," Oct 21, 2025.
- [7] Reuters, "GE Aerospace lifts 2025 profit view on rising demand for fixing older jets," Jul 17, 2025.
- [8] Yahoo Finance, "Jim Cramer on GE Aerospace: “Self-Improvement Here Is Extraordinary”," Jan 24, 2026.
- [9] Finviz, "Jim Cramer on GE Aerospace: \"Self-Improvement Here Is Extraordinary\"," Jan 24, 2026.
About this seasonal analysis
Seasonal pattern data is sourced from TradeWave.ai, which analyzes historical price behavior across annual calendar windows going back up to 30 years. Read the full data methodology or the book The 100-Year Pattern by Afshin Moshrefi (2026 edition). Past performance of seasonal patterns does not guarantee future results. This article is for informational purposes only and does not constitute investment advice.