Merck & Co. (MRK) Has Rallied in 10 of 10 Midterm May Windows, Averaging 25.24% Gains
Merck & Co. is heading toward a midterm-election-year seasonal window that has never lost in the last 10 cycles, just as shares trade near 52-week highs and investors weigh oncology deal-making and looming patent cliffs.

What is the seasonal pattern for Merck & Co. (MRK)?
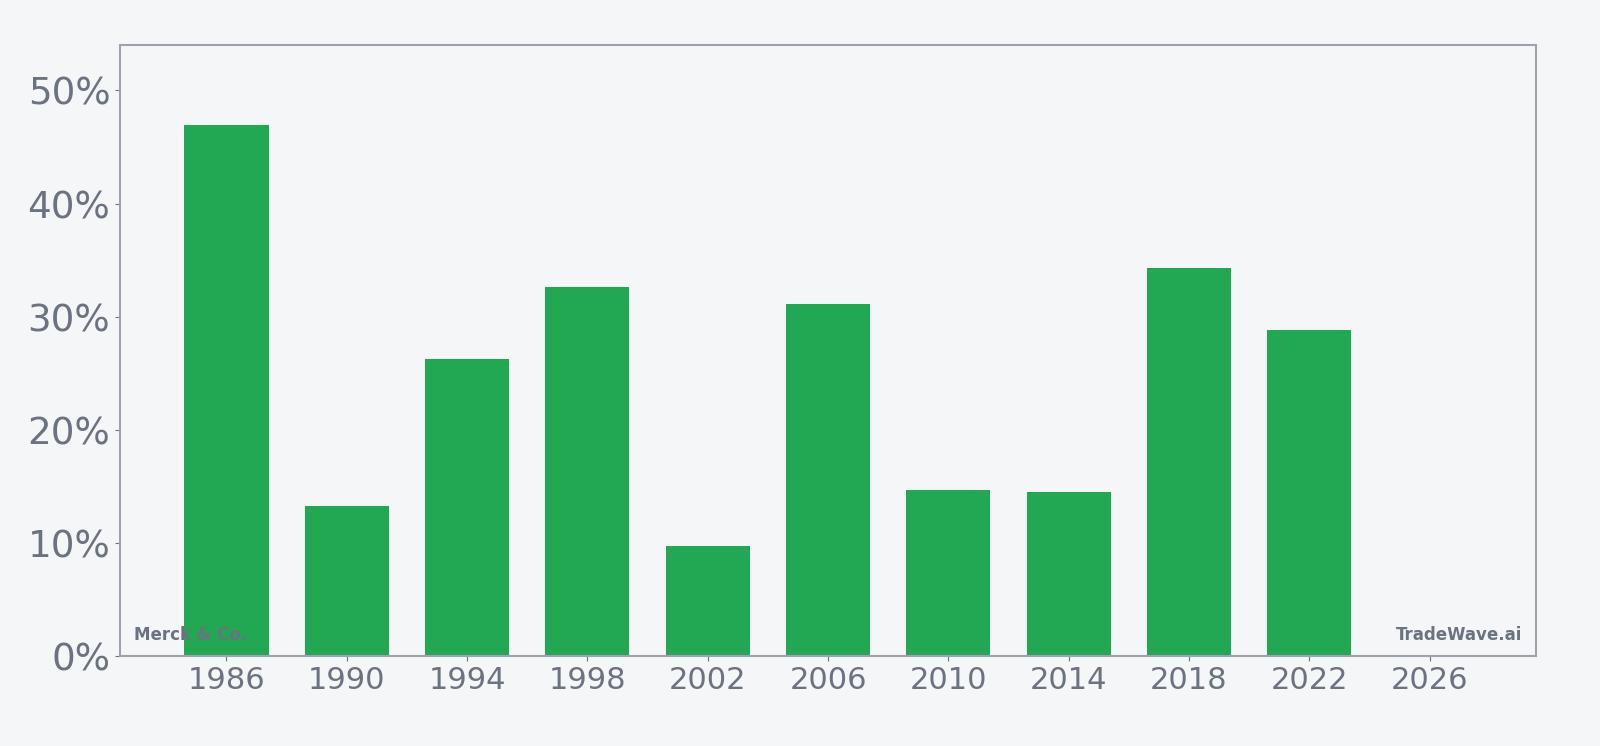
Merck & Co. has risen in 10 of 10 midterm-election-year windows starting in early May, with an average gain of 25.24% in winning years.
- 10 for 10 in this window, with average winning-year gains of 25.24% across the last 10 midterm election years.
- Seasonal window begins May 7 and runs 248 trading days, spanning late in the midterm year into the following pre-election year.
- Percent Profitable is 100%, with 10 winners and 0 losers in the historical sample.
- Annualized return across these windows is 24.75%, with a Sharpe ratio of 1.9 based on end-of-window outcomes.
- TradeWave Ratio of 2.13 indicates price has typically traveled meaningfully in the long direction within the window, not just at the close.
- Even the weakest year still finished positive, though some windows saw sizable intraperiod drawdowns before recovering.
According to historical data from TradeWave.ai, this upcoming stretch for Merck & Co. has behaved very differently from an average year, with a distinct midterm-election-year bias that traders rarely see discussed in standard research.
How has Merck & Co. (MRK) traded in past midterm-year windows starting in May?
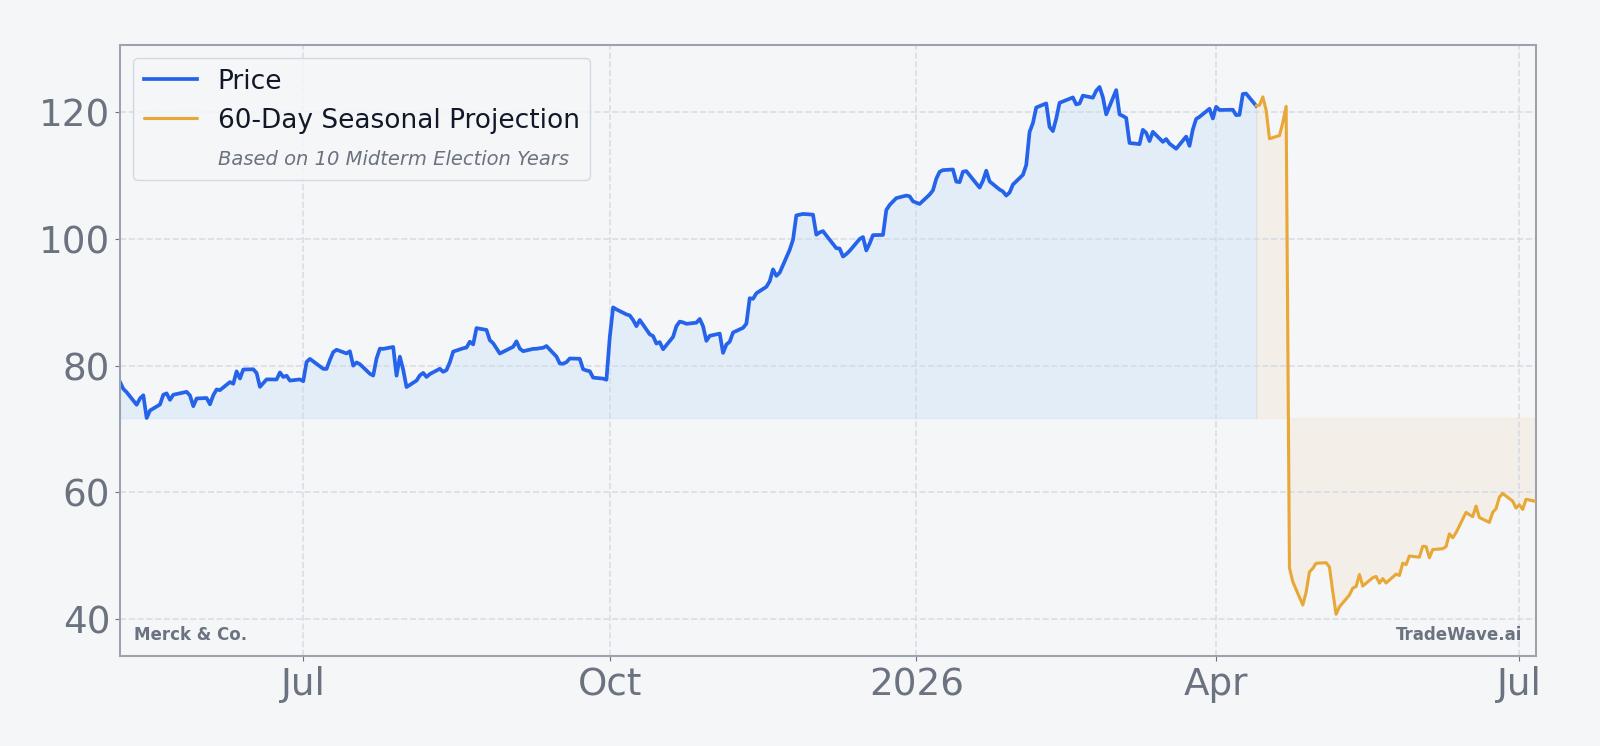
Merck & Co. has posted gains in every one of the last 10 midterm-election-year windows that began around May 7 and ran for 248 trading days, averaging 25.24% advances for long positions. Shares finished Monday at 120.13, up 5.6% year to date and about 4.0% below their 52-week high of 125.14.[8]
The pattern groups Merck’s behavior by the presidential election cycle, focusing on the last 10 midterm election years rather than consecutive calendar years. That matters because drug pricing debates, reimbursement rules and research funding often track the political calendar, and large-cap pharma stocks like Merck tend to feel those shifts most acutely in the midterm and pre-election phases.
Across those 10 midterm-year windows, the trade direction is firmly long. Percent Profitable is 100%, with 10 winners and 0 losers, and the median gain is 27.56%, slightly above the average, which points to a cluster of strong outcomes rather than a single outlier year. The weakest net result in the sample still delivered a 9.8% gain in 2002, while the strongest year, 1986, produced a 46.98% advance from entry to exit.
Average profit of 25.24% means that, in a typical winning year, a long position held from early May of the midterm year through this 248-day window would have added roughly a quarter to its value by the end. Because every year in the sample finished positive, the all-years average is effectively the same as the average winner, which is unusual for a single-stock seasonal pattern of this length.
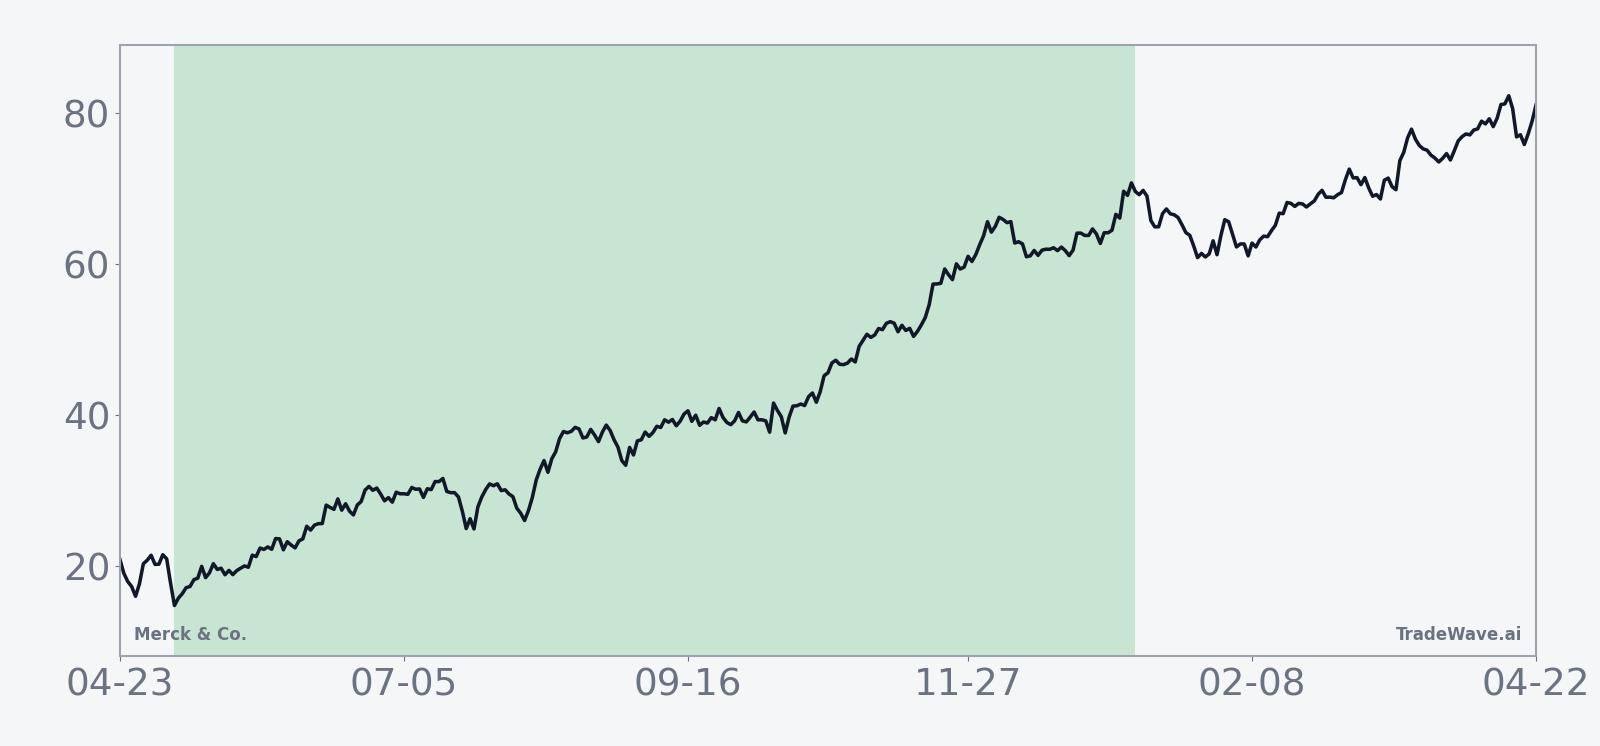
The historical seasonal average curve for this Merck & Co. trading window slopes higher for most of the 248 days, with only modest pauses. Gains tend to build through the back half of the midterm year and continue into the early part of the following pre-election year, which lines up with the broader pattern of risk appetite often improving as policy uncertainty clears.
Year-by-year bars that include both peak run-ups and worst drawdowns show how much the stock has typically moved inside the window before settling at its final gain.
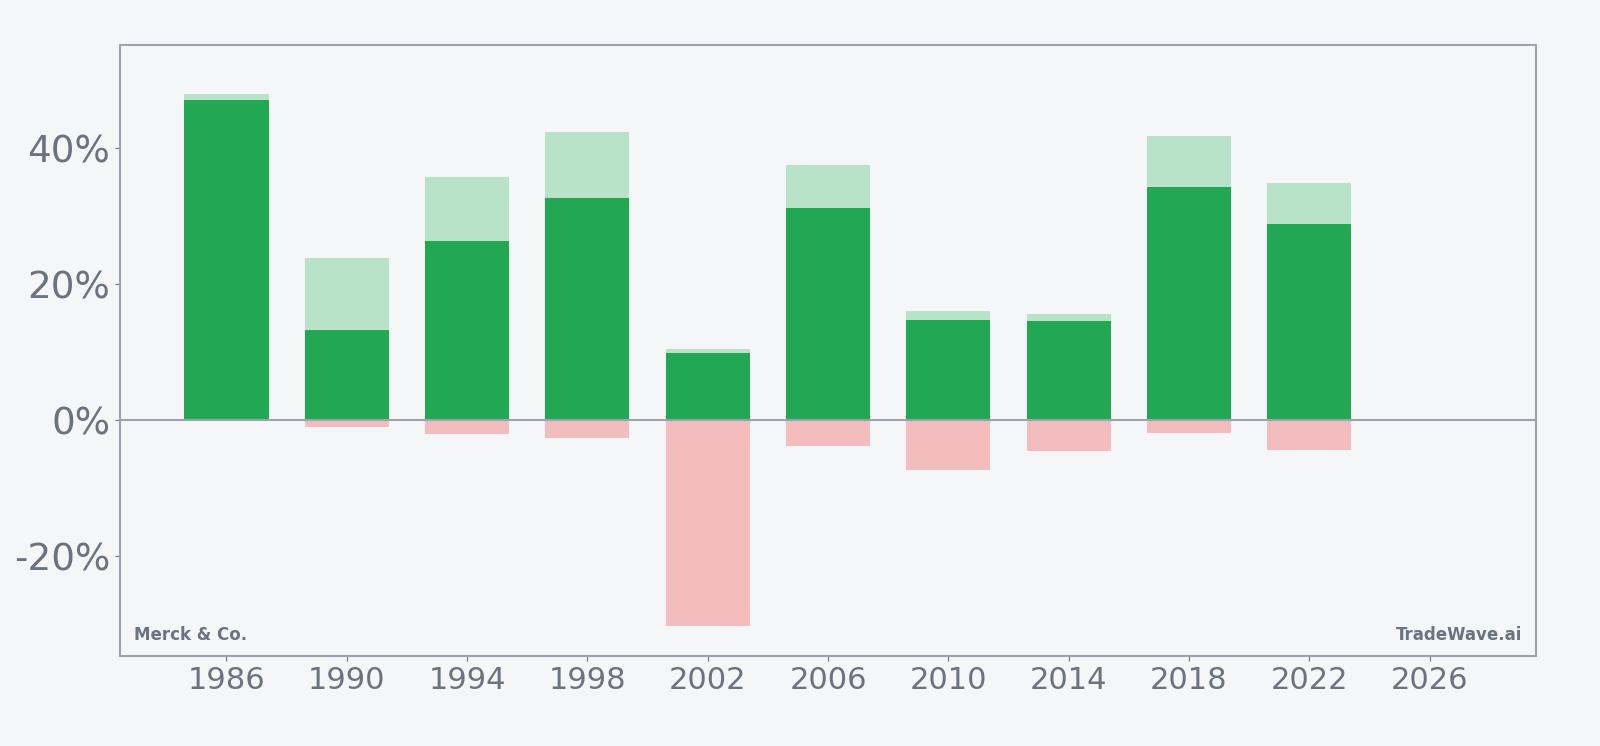
The maximum favorable move in strong years has often pushed well beyond the final net gain, with peak run-ups above 40% in 1986, 1998 and 2018 before the window closed. At the same time, the maximum adverse move shows that even winning years can involve uncomfortable drawdowns, such as a roughly 30% intraperiod drop in 2002 before the stock recovered to finish positive. That mix of large positive excursions and occasional deep pullbacks is captured in the TradeWave Ratio of 2.13, which measures how far price typically travels in the trade direction within the window, and in the 1.9 Sharpe ratio that reflects strong risk-adjusted returns based on end-of-window outcomes.
History does not guarantee future results; adverse excursions can be large even in winning windows, and traders should treat this seasonal pattern as context rather than a forecast.
Why does Merck & Co. (MRK) follow this seasonal pattern?
One likely driver is the way Merck’s earnings calendar and drug trial milestones cluster in the back half of midterm election years and into the following pre-election year, when policy visibility often improves and risk appetite for healthcare increases.[3] Analysts have also pointed to institutional portfolio repositioning around drug pricing debates and acquisition pipelines, which tend to heat up as Washington’s agenda becomes clearer in the run-up to the presidential election.[4] This pattern may reflect a blend of those forces, with investors rewarding oncology growth stories like Keytruda once regulatory and political overhangs ease.[1]
What is driving Merck & Co. (MRK) today?
Merck & Co. shares slipped 1.1% in the latest session to 120.13, leaving the stock up 5.6% year to date and trading in the upper end of its 12-month range, about 4.0% below the 52-week high of 125.14.[8] The move comes as investors weigh Merck’s push to extend its oncology leadership and offset the 2028 patent expiration for Keytruda, including talks over a roughly $6 billion all-cash acquisition of Terns Pharma to bolster its cancer portfolio.[8] In late 2025, Merck reported higher third-quarter sales driven by Keytruda growth, with revenue of $17.28 billion and adjusted EPS of $2.58, and narrowed 2025 revenue guidance to a range of $64.5 billion to $65.0 billion, reinforcing the company’s focus on pipeline-driven expansion rather than near-term margin maximization.[3][1]
The chart below shows how that backdrop fits into Merck’s recent 12-month trading range and a short-term seasonal projection.
Strategically, Merck has signaled a willingness to accept slower earnings growth as it spends on acquisitions and pipeline investments, a stance that The Wall Street Journal reported in early February as management prepared investors for a more deal-heavy phase.[4] That message followed a series of analyst upgrades in late 2025, including moves by Wells Fargo and BMO Capital that cited confidence in the oncology pipeline and raised price targets as Merck’s stock rallied on Keytruda strength and new indications.[1][5] Sector-wide, large-cap pharma has benefited from steady demand for cancer therapies even as some vaccine franchises, such as Gardasil in China, have faced pressure, leaving Merck leaning harder on oncology to drive top-line growth.[3]
Corporate deal-making has become a recurring theme for Merck, with coverage from Reuters and others highlighting how the company is using its balance sheet to secure future growth as blockbuster drugs age.[8][7] That acquisition strategy fits the broader healthcare and pharmaceuticals sector backdrop, where companies with strong cash flows are increasingly buying late-stage assets rather than relying solely on internal R&D to fill their pipelines.[3] For Merck, the combination of a rich oncology franchise, active M&A pipeline and a stock trading near its highs sets a very different stage heading into this midterm-year seasonal window than in earlier cycles when the company was more exposed to patent cliffs and vaccine volatility.
What should traders watch in this Merck & Co. seasonal window?
First, watch how Merck trades as the May 7 window opens relative to its current position near the top of the 12-month range. Historically, the pattern has favored longs across the entire 248-day stretch, but some years saw early drawdowns before the uptrend took hold, so behavior in the first few weeks will be a key tell.
Second, monitor policy and regulatory headlines tied to drug pricing and oncology approvals, which often intensify in midterm election years and can either reinforce or temporarily disrupt the historical seasonal trend.[3][4] Any confirmation of the Terns Pharma deal or additional acquisition news would also matter, since investors have been primed to accept slower earnings growth in exchange for a stronger post-Keytruda pipeline.[8][4]
Third, keep an eye on how Merck’s earnings cadence lines up with the window, especially updates on Keytruda, Gardasil and late-stage oncology assets.[3][1] Stronger-than-expected results or guidance revisions have historically been catalysts for the stock, and upside or downside surprises could either amplify or blunt the typical midterm-year seasonal pattern.
Finally, track the broader healthcare and pharmaceuticals sector tone, since Merck’s seasonal strength has often coincided with periods when investors rotate toward defensive growth and cash-generative names.[3] If sector flows stay supportive and Merck holds above key recent support levels while the window is open, that would be more consistent with the 10-for-10 historical record; a sharp break lower on heavy volume would be an early sign that this cycle may diverge from the past.
Sources
- Forbes – “Why Is Merck Stock Surging?” (Nov 26, 2025)
- Forbes – “Should You Buy MRK Stock At $80?” (May 26, 2025)
- Reuters – “Merck posts higher third-quarter sales as Keytruda growth offsets drop from Gardasil” (Oct 30, 2025)
- The Wall Street Journal – “Merck Expects Slower Earnings Growth As It Spends on Acquisitions” (Feb 3, 2026)
- Forbes – “Is Merck Stock’s Run Legitimate?” (Dec 24, 2025)
- Forbes – “40% Upside For Merck Stock?” (Jun 27, 2025)
- Seeking Alpha – “Key deals this week: Merck, Glencore, CrowdStrike, Marvell Technology, Steel Dynamics and more” (Jan 10, 2026)
- Reuters – “Merck nears $6 billion acquisition of Terns Pharma to boost cancer portfolio” (Mar 25, 2026)
About this seasonal analysis
Seasonal pattern data is sourced from TradeWave.ai, which analyzes historical price behavior across annual calendar windows going back up to 30 years. Read the full data methodology or the book The 100-Year Pattern by Afshin Moshrefi (2026 edition). Past performance of seasonal patterns does not guarantee future results. This article is for informational purposes only and does not constitute investment advice.