Seven Straight Midterm Windows Have Seen International Paper (IP) Drop, Shorts Averaged 13.35%
International Paper is heading into a 158-day midterm-election-year seasonal window that has been consistently bearish in past cycles, even as the stock trades well below its 52-week high.

What is the seasonal pattern for International Paper (IP)?
International Paper has fallen in 7 of 7 midterm-election-year windows starting around May 9, with an average gain of 13.35% in winning years for a short position.
- 7 for 7 in this window for shorts, with an average profit of 13.35% across winning years.
- The upcoming International Paper trading window starts May 9 and runs for 158 trading days in midterm election years.
- Percent Profitable is 100%, with 7 winners and 0 losers for the short-side seasonal pattern.
- The TradeWave Ratio of 1.85 suggests price has typically moved meaningfully in the trade direction within the window.
- A Sharpe ratio of 1.17 points to historically strong risk-adjusted returns for this specific short pattern.
- Past years show sizable intraperiod swings, with both sharp favorable drops and notable adverse rallies before the window closes.
According to historical data from TradeWave.ai, this midterm-election-year stretch has behaved very differently from an average calendar period for International Paper. The next section looks at how that pattern has played out across the last seven comparable cycles.
How has International Paper (IP) traded in this midterm-year seasonal window?
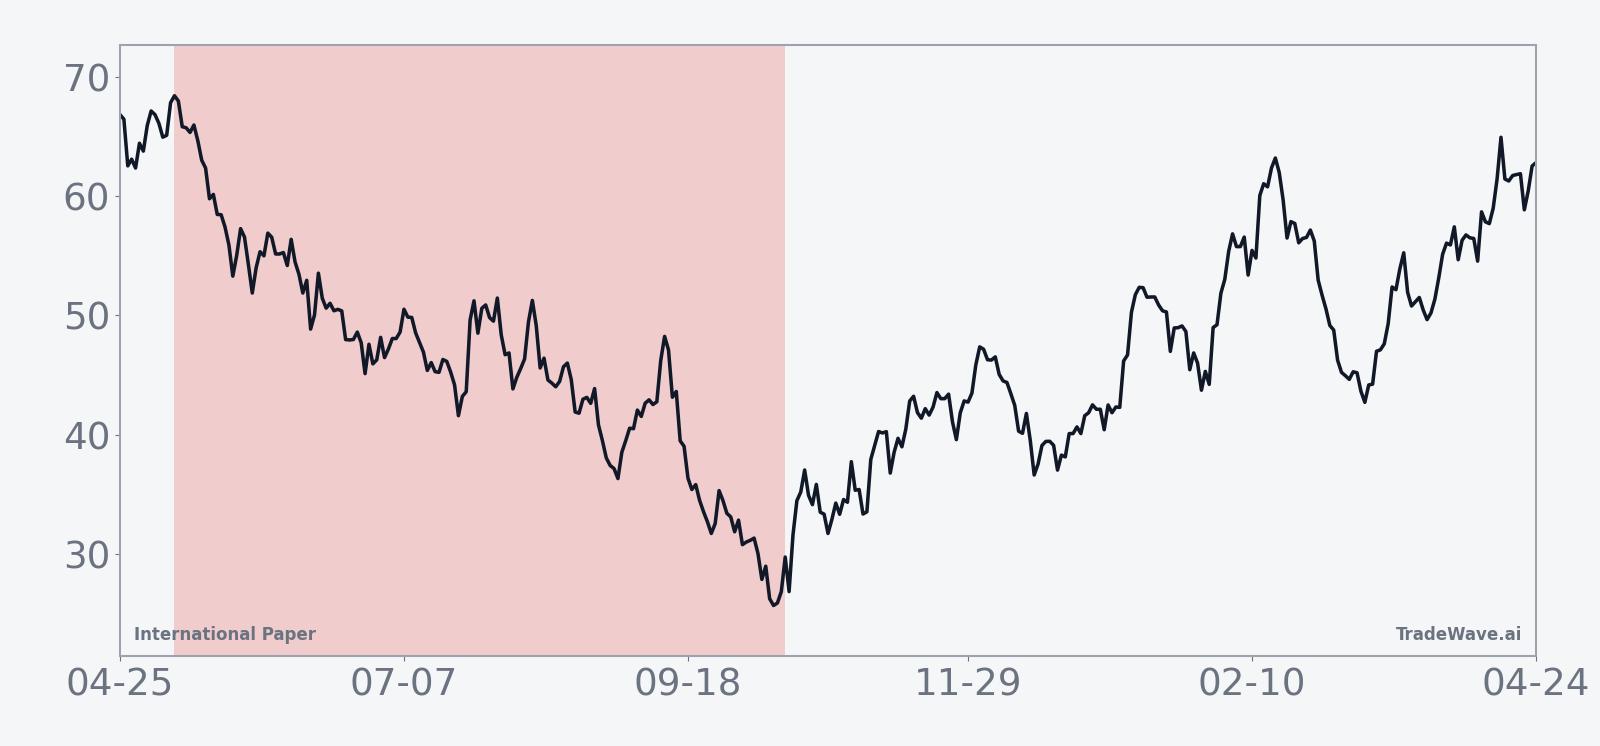
In the last seven midterm election years, International Paper has declined in this May-to-autumn window every single time, rewarding short positions in all seven cycles. The stock last closed at 31.955, up 5.0% on the day and about 40.8% below its 52-week high of 53.73, leaving plenty of room on the chart if the historical pattern repeats.
Because this analysis groups only midterm election years, it lines up the stock’s behavior with a specific phase of the policy and business cycle rather than treating every year the same. For a cyclical industrial name tied to packaging demand and capital spending, that election-cycle lens can matter as much as the calendar month when it comes to recurring stock pattern analysis.
This seasonal window begins on May 9 and spans 158 trading days. Historically, during this period, International Paper has been a strong short-side trade, with a 100% win rate for shorts across the last seven midterm election years and an average profit of 13.35% in those winning years.
The trade direction for this setup is explicitly short, which means years with negative returns for the stock have been favorable for the pattern. Across the seven historical windows, there were 7 winners and 0 losers for the short side, so every midterm-year iteration in the sample delivered a net decline by the end of the window.
Average profit of 13.35% reflects the mean gain for those winning short trades, while the all-years average of 13% is effectively the same because there were no losing years in the sample. That combination of a clean win record and double-digit average profit is unusual for a single-stock seasonal regime of this length.
The TradeWave Ratio (TWR) for this pattern is 1.85, which describes how far price typically travels in the trade direction within the window, independent of the final close. In plain English, shorts have often seen meaningful downside excursions at some point during the 158 days, even in years where the stock later bounced part of the way back before the window ended.
The Sharpe ratio of 1.17 captures the risk-adjusted average return based on end-of-window outcomes. For a single-name short pattern, a Sharpe above 1.0 across seven cycles signals that the historical seasonality has not just been directional but also relatively efficient in terms of return per unit of volatility.
Looking at individual years, 2022 stands out as the strongest short window, with International Paper dropping 30.04% from entry to exit while experiencing a worst intraperiod drawdown of 34.5% from the starting level and only a modest 4.14% peak rally against the short before resuming lower. At the other end of the spectrum, 2014 was the mildest iteration, with a 1.34% net decline but a sizable 12.81% favorable move at one point and only a 1.43% adverse move against the short.
Other midterm years such as 1998 and 2018 also delivered double-digit net declines of 13.09% and 18.18% respectively, but with deep intraperiod swings. In 1998, the stock’s best move against the short was a 4.25% rally, while the worst drawdown in favor of the short reached 33.02%. In 2018, the pattern saw a 14.14% favorable drop at one stage and a 19.77% adverse move, underscoring how choppy the path can be even in a winning year for the short-side seasonal trend.
A second view layers each year’s net result with its best and worst intraperiod swings to show how far the stock has tended to move inside the window.
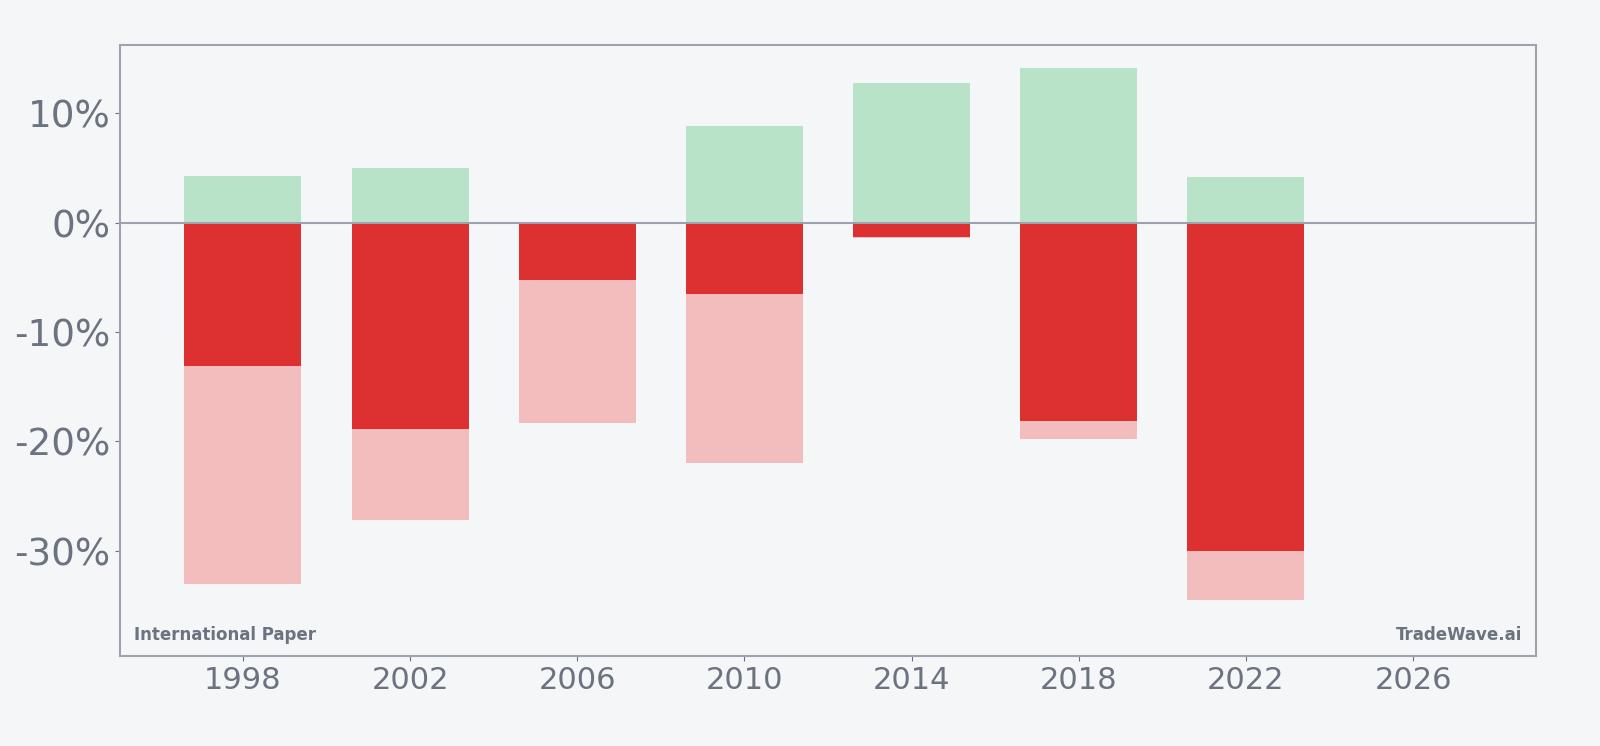
The bar chart highlights that even in years with relatively small final declines, International Paper has often seen large intraperiod moves both in favor of and against the short. Maximum favorable excursion (MFE) captures the best point-to-peak drop during the window, while maximum adverse excursion (MAE) shows the worst drawdown from entry, and both have been sizable in several cycles.
History does not guarantee future results; adverse excursions (MAE) can be large even in winning windows.
Why does International Paper (IP) follow this seasonal pattern?
One likely driver is the way midterm election years line up with corporate capital spending and packaging demand, which can soften as companies wait for policy clarity before committing to new projects. Analysts have also pointed to sector rotation in industrials and materials around this phase of the presidential cycle, as investors rebalance toward or away from economically sensitive names. For a company like International Paper, whose fortunes are tied to box demand and input costs, those shifts can translate into recurring pressure on the stock during this specific stretch of the year.
What is driving International Paper (IP) today?
International Paper shares closed at 31.955, up 1.535 points or 5.0% on the day, with roughly 9.7 million shares changing hands against a 20-day average volume of about 6.9 million. The stock is trading about 40.8% below its 52-week high of 53.73 and roughly 7.4% above its 52-week low of 29.45, while sitting well under its 50-day moving average of 37.19, a setup that keeps the broader trend under pressure even after today’s bounce.
The company is still digesting a difficult stretch of fundamentals. In Jan 2026, International Paper reported a wider fourth-quarter loss tied to higher costs and an asset impairment charge, and at the same time laid out plans to split into two publicly traded companies, a move aimed at sharpening its strategic focus and unlocking value over time.[2] Earlier, in Aug 2025, the company agreed to sell its global cellulose fibers business to American Industrial Partners for $1.5 billion, a portfolio move that came with expected pretax cash charges of about $158 million and signaled a push toward higher-return packaging assets.[1]
Those corporate actions sit against a macro backdrop where corporate profits have been beating expectations, the Federal Reserve has remained accommodative, and merger activity has picked up, all of which can support risk appetite for cyclical names like International Paper even as company-specific restructuring plays out.[1] Within the packaging industry, the company remains a leading containerboard and box producer, focusing on efficiency and high-return projects while managing headwinds from softer demand and cost inflation.[1]
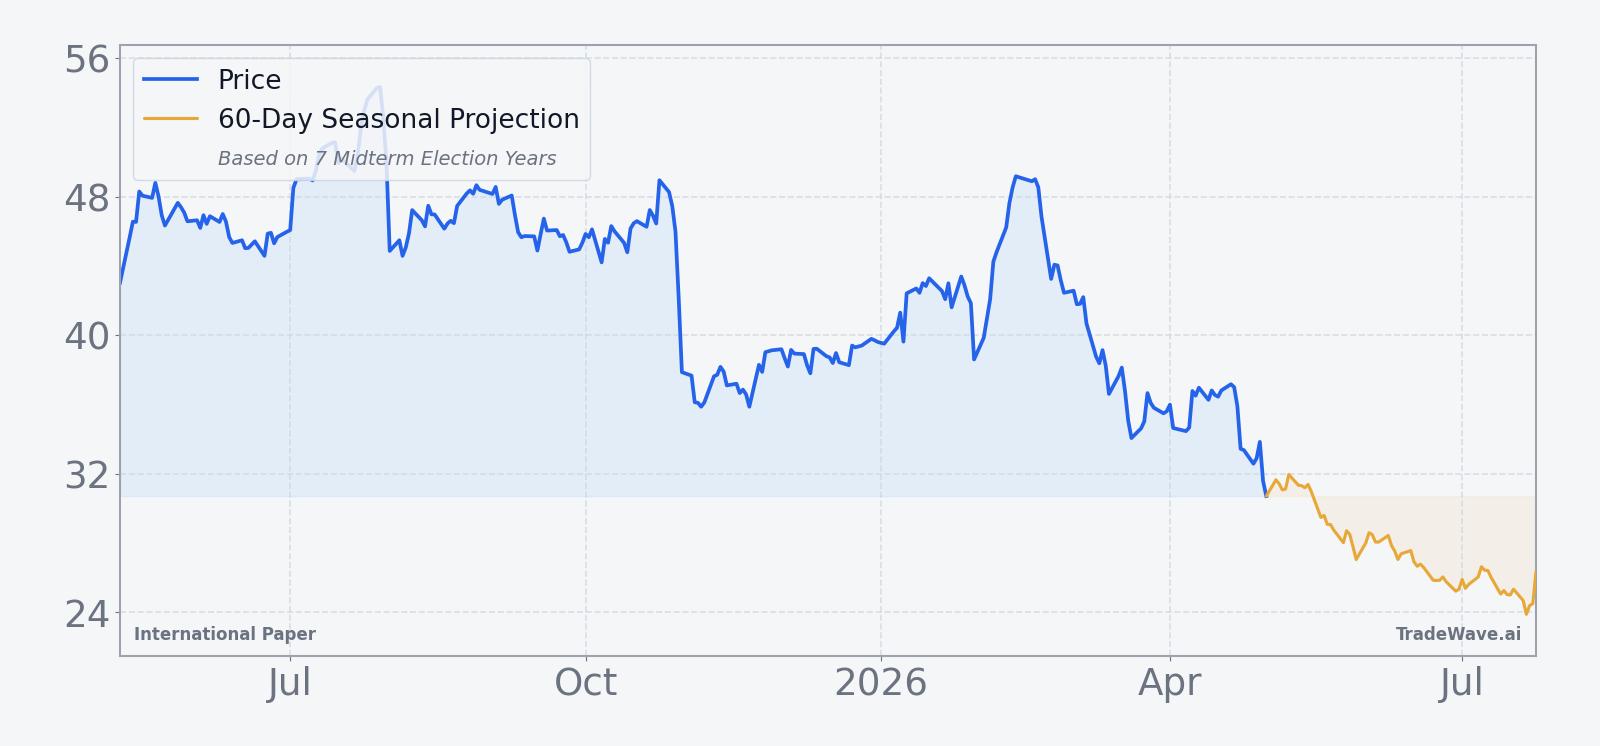
The chart below situates the latest move in its recent multi-month context alongside a short-term seasonal projection.
What should traders watch as this International Paper seasonal window approaches?
First, the calendar: the 158-day midterm-year window starts on May 9, so any sharp rallies or reversals around that date will be watched against the backdrop of a pattern that has historically favored shorts. Price action relative to the 50-day moving average near 37.19 and the recent 52-week low at 29.45 will be key reference points; a break below the low early in the window would line up with the historical seasonal trend, while a sustained move back above the moving average would cut against it.
Second, the policy and macro calendar matters. Midterm election years often bring shifting expectations around fiscal policy, regulation and trade, all of which can influence packaging demand and industrial sentiment. Any changes in guidance from International Paper on its planned split, cost structure or capital spending, as well as broader data on manufacturing and freight volumes, will help confirm whether this cycle is tracking closer to the stronger short years like 1998 and 2022 or the milder ones like 2014.[1][2]
Finally, traders will be watching how volume behaves as the window opens. The stock already trades with elevated liquidity relative to its recent average, and spikes in turnover around key support or resistance levels could signal whether institutional investors are leaning into or fading the historical midterm-year seasonal pattern. If the stock starts to slide with rising volume as the window progresses, that would echo the behavior seen in prior midterm cycles; a firming tape on light volume would suggest this time may look different.
Sources
About this seasonal analysis
Seasonal pattern data is sourced from TradeWave.ai, which analyzes historical price behavior across annual calendar windows going back up to 30 years. Read the full data methodology or the book The 100-Year Pattern by Afshin Moshrefi (2026 edition). Past performance of seasonal patterns does not guarantee future results. This article is for informational purposes only and does not constitute investment advice.