Tariffs, Trade Tensions Weigh on HP Inc. (HPQ) as Weak Mid-May Window Nears
HP Inc. is heading into a historically weak 13-day midterm-year trading window just as the stock trades well below its 52-week high and navigates tariff and PC demand headwinds.
What is the seasonal pattern for HP Inc. (HPQ)?
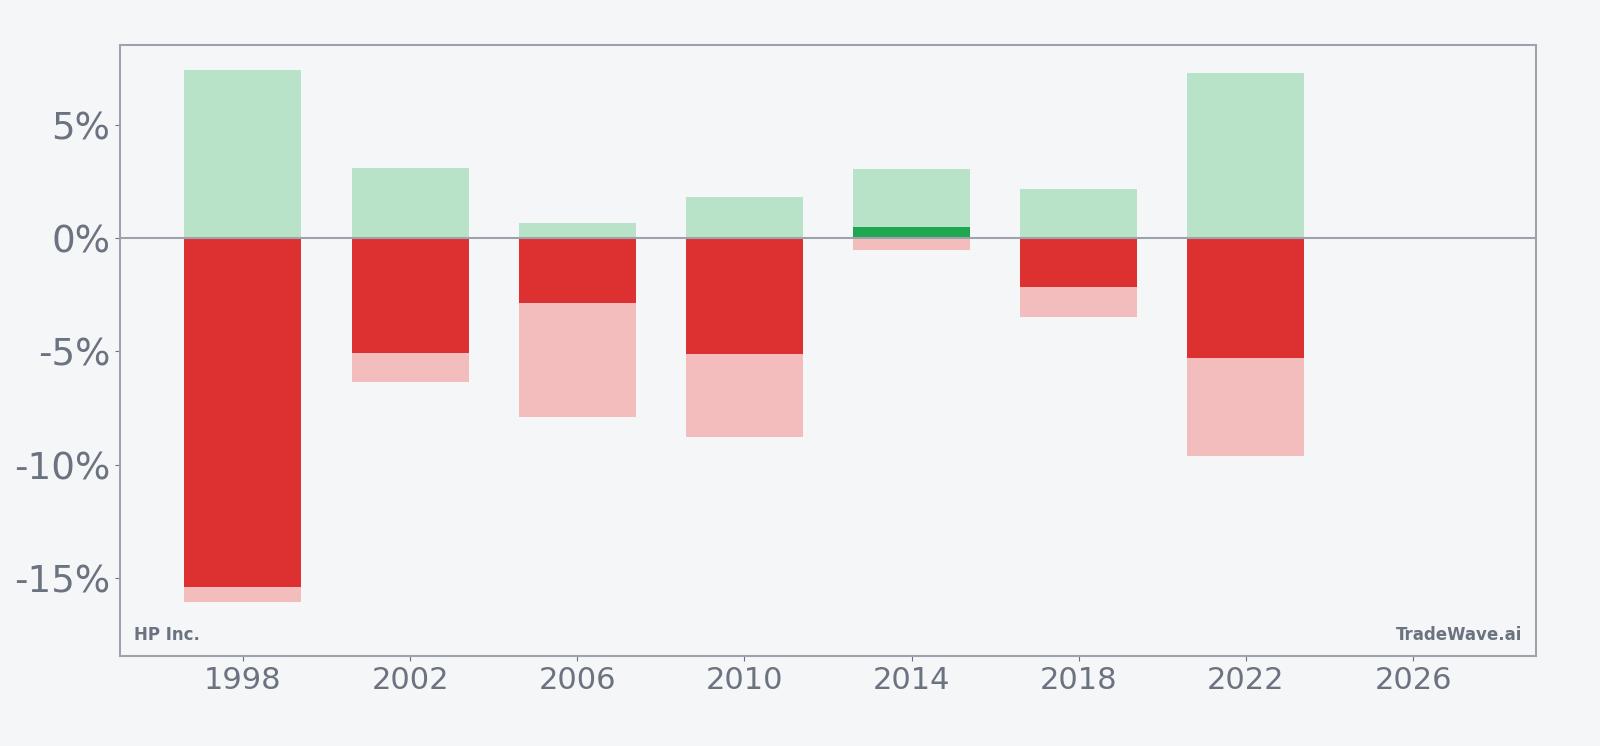
HP Inc. has fallen in 6 of 7 midterm-year May windows during this 13-day stretch, with an average 5.98% gain in winning years for the short-side pattern.
- 6 for 7 in this window for short trades, with winning years averaging 5.98% moves in the trade direction.
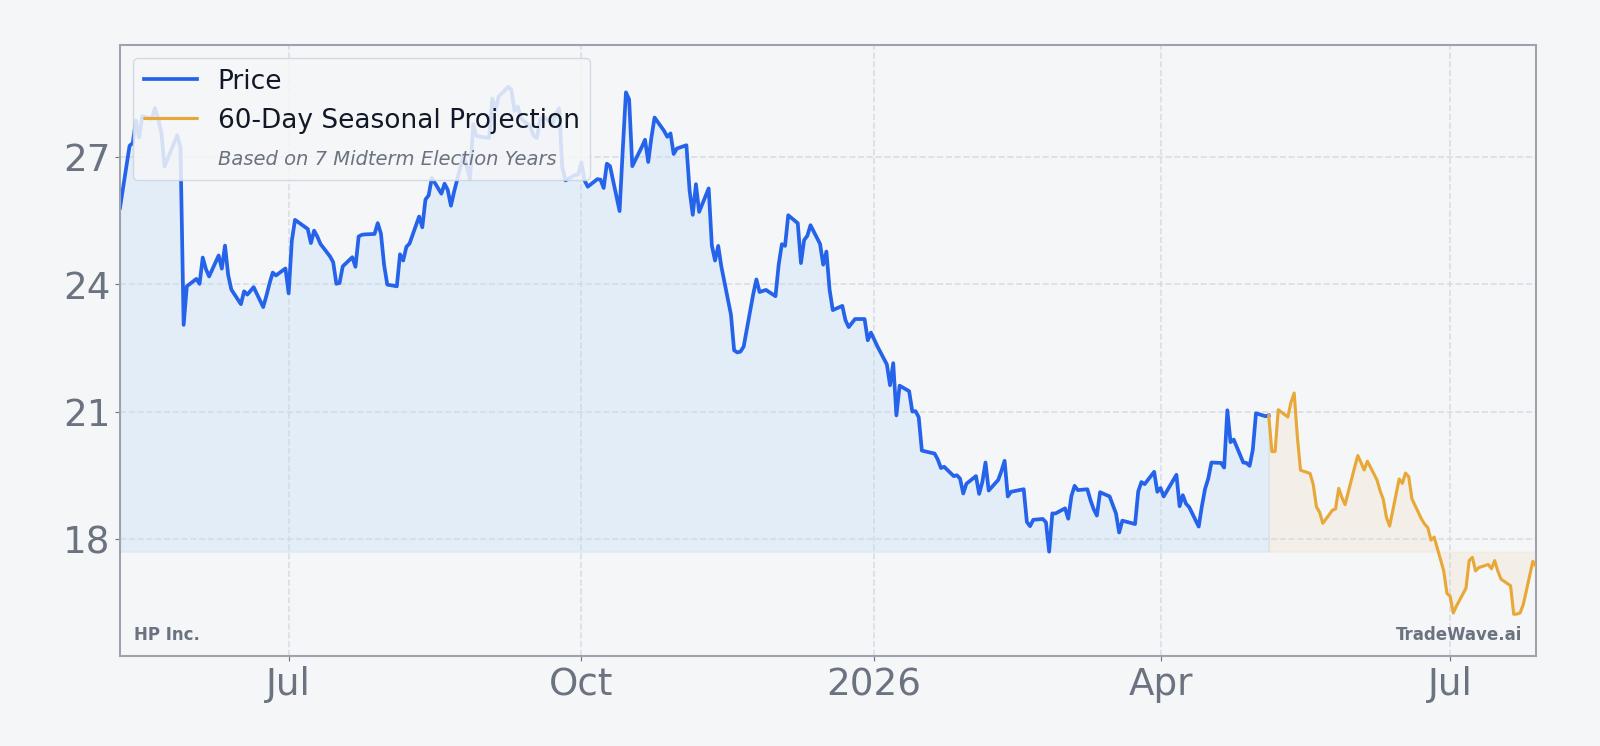
- The upcoming 13-day window starts May 9 and is grouped across the last 7 midterm election years.
- Percent Profitable is 86%, with 6 winners and 1 loser for the short-side setup.
- Avg Profit - All, which includes the lone losing year, is still a sizable 5% move in favor of shorts.
- Historical maximum adverse excursions have reached double digits in some years, showing that rallies against the short can be sharp before prices roll over.
- The pattern sits in the mid part of the midterm election year, a phase that often brings policy and demand uncertainty for PC makers.
According to historical data from TradeWave.ai, this mid-May stretch has behaved very differently from an average month for HP Inc., and the next iteration is only days away.
How has HP Inc. (HPQ) traded in this midterm-year May window?
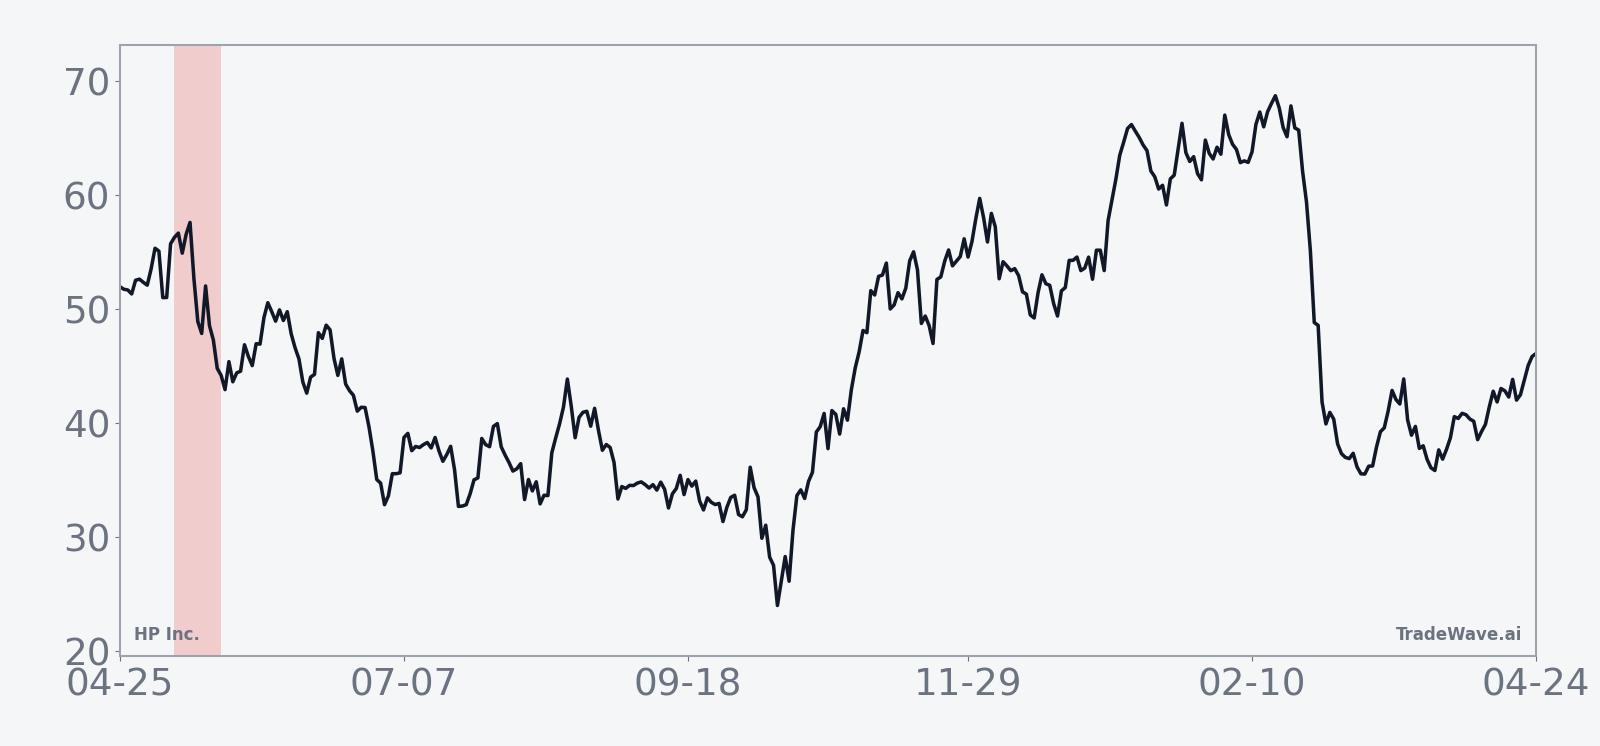
HP Inc. has delivered profitable short trades in 6 of the last 7 midterm election years during this 13-day May window, with an average 5.98% gain in winning years for the short side. The stock closed at 21.37 on May 5, up 2.7% on the day and about 24.5% below its 52-week high of 28.31, after a tough stretch that has left shares down roughly 16% year to date.[1]
Because this pattern is grouped by the presidential election cycle, it only looks at the last seven midterm election years, not seven consecutive calendar years. That matters for a PC and printer heavyweight like HP Inc., since midterm years often coincide with shifting fiscal priorities, tariff debates and corporate spending pauses that can hit hardware refresh budgets.
Across those seven midterm-year samples, the short-side HPQ seasonal trend has been both consistent and sizable. Percent Profitable sits at 86%, with 6 winners and just 1 losing year, and even after including that outlier the all-years average move in favor of shorts is still 5% over just 13 trading days. For a stock that typically does not move double digits in two weeks, that is a meaningful historical edge for traders who pay attention to election-cycle seasonality.
The per-year breakdown shows how this has played out in practice. In 1998, the short pattern captured a 15.4% decline from entry to exit, while 2022 delivered a 5.27% drop over the same calendar slice. The lone losing year was 2014, when HPQ finished the window up 0.49%, a modest move against the short direction that barely dented the longer-run stats.
The historical seasonal average suggests that, in winning years, HPQ has tended to weaken fairly steadily through the window rather than spiking all at once. The curve slopes in favor of the short direction, with only brief countertrend rallies, which fits a picture of gradual de-risking or demand worries rather than a single shock event.
Intraperiod swings tell an important part of the story, combining net results with the best and worst moves inside each window.
The bars with maximum favorable and adverse excursions show that even in years where the short ultimately worked, HPQ often staged sharp rallies inside the window before rolling over. In 1998, for example, the best intraperiod move against the short reached 7.42% before the stock reversed into a 15.4% decline by exit, while the worst drawdown in the trader’s favor hit 16.05% at the low. That mix of large maximum favorable excursion and sizable maximum adverse excursion points to a high-variance window where both squeezes and air pockets have been common.
Other years tell a similar story. In 2022, the short pattern finished with a 5.27% gain, but the stock first rallied as much as 7.3% from entry before sliding to a 9.62% intraperiod low relative to the starting point. For traders, that means timing and risk management have mattered more than simply knowing the direction of the historical bias.
Put together, the pattern is clear: this mid-May midterm-year window has historically favored short exposure in HPQ, with 6 of 7 years delivering meaningful downside over just 13 trading days.
Why does HP Inc. (HPQ) follow this seasonal pattern?
One likely driver is the way corporate PC and printer budgets line up with the fiscal year and the U.S. policy calendar. Analysts have pointed to midterm election years as periods when CIOs and CFOs often delay hardware refresh decisions until after Washington’s spending and tariff outlook becomes clearer, which can weigh on order books for a few weeks at a time.[1] For HP Inc., that may translate into a recurring pocket of softer demand and cautious guidance chatter in mid-May, reinforcing the historical short-side seasonal trend.
History does not guarantee future results, and even in winning years the worst intraperiod drawdowns have been large, so traders using this pattern need to respect the potential for sharp rallies against the short.
What is driving HP Inc. (HPQ) today?
HPQ finished the latest session at 21.37, up 2.7% on the day, extending a roughly 13.65% gain over the past month but still leaving the stock about 24.5% below its 52-week high of 28.31 and roughly 20.6% above its 52-week low of 17.56.[1] The rebound comes after a difficult stretch in fiscal 2025, when tariffs and trade tensions cut into margins and forced HP to trim its full-year profit outlook, even as demand for AI PCs and Windows 11 upgrades helped stabilize revenue.[1]
In May 2025, HP reported second-quarter revenue of $13.22 billion, beating estimates, but profit fell 17% to $700 million as tariffs pushed up costs and pressured demand, triggering a stock drop of as much as 15%.[1] A day later, the company cut its fiscal 2025 adjusted profit forecast to a range of $3.00 to $3.30 per share, citing tariffs and economic volatility, which kept investors cautious on the name.[1] By Aug 27, 2025, HP was able to beat third-quarter revenue expectations with $13.93 billion in sales and adjusted earnings of 75 cents per share, helped by AI PC demand and Windows 11 upgrades, but the stock still traded as a value play rather than a growth story.[1]
More recently, on Feb 24, 2026, HP warned of a double-digit decline in PC shipments for fiscal 2026 due to memory chip volatility and a broader PC sales slump, signaling that profitability could remain under pressure even as the company leans into AI-enabled devices.[1] That backdrop has kept the consensus analyst rating around “Hold,” with investors weighing cyclical PC weakness and tariff risk against the potential for AI PCs to drive a replacement cycle over the next few years.[1]
The chart below situates the latest bounce against HPQ’s past year of trading and a 60-day seasonal projection.
What should traders watch in this upcoming HPQ seasonal window?
With the 13-day midterm-year window starting May 9, the first thing to watch is whether HPQ’s recent rebound stalls near the low-20s or pushes back toward the mid-20s despite the historical short-side bias. A firm break above the 50-day moving average around 19.26 has already shifted near-term momentum, so how the stock behaves between 21 and 23 during the window will show whether sellers still control this seasonal stretch.[1]
Second, the policy and macro calendar matters. Any fresh headlines on tariffs, trade negotiations or memory chip supply could either reinforce the historical pattern of midterm-year caution or blunt it if investors see clearer visibility on costs and demand.[1] Traders will also be watching for any updates on AI PC adoption and enterprise refresh plans, since stronger-than-expected commentary there could offset the usual mid-May softness in the PC hardware cycle.[1]
Finally, behavior inside the window will be key. If HPQ rallies sharply early in the period and then fades into lower lows, that would rhyme with prior years where maximum adverse excursions against the short were followed by larger favorable moves. If instead the stock grinds higher throughout the window without a meaningful pullback, it would mark a rare break from a pattern that has historically favored shorts in 6 of 7 midterm election years.
Sources
About this seasonal analysis
Seasonal pattern data is sourced from TradeWave.ai, which analyzes historical price behavior across annual calendar windows going back up to 30 years. Read the full data methodology or the book The 100-Year Pattern by Afshin Moshrefi (2026 edition). Past performance of seasonal patterns does not guarantee future results. This article is for informational purposes only and does not constitute investment advice.