8-for-8: Gilead Sciences (GILD) Has Rallied Every Midterm May Window, Averaging 25% Gains
Gilead Sciences is trading off its highs just as a historically powerful midterm-year seasonal window opens, raising the stakes for a stock already reshaping its oncology pipeline.

What is the seasonal pattern for Gilead Sciences (GILD)?
Gilead Sciences has risen in 8 of 8 midterm-election-year windows starting in May, with an average gain of 25.14% in winning years.
- 8 for 8 in this window, with Gilead Sciences averaging 25.14% gains in winning years across the last eight midterm election cycles.
- The current pattern window began on May 10, 2026 and spans 324 trading days, covering the heart of the midterm year into the following pre-election phase.
- Percent Profitable is 100%, with 8 winners and 0 losers in this GILD seasonal trend during comparable midterm-election-year windows.
- Average winner gains of 25.14% come alongside a TradeWave Ratio of 2.0, indicating that price has typically traveled meaningfully in the long direction within the window.
- Intraperiod swings have been sizable, with historical best-case rallies and worst-case drawdowns both showing that this Gilead Sciences trading window can be volatile even when it finishes higher.
- The pattern aligns with the presidential election cycle, clustering around midterm-year policy uncertainty and the subsequent pre-election-year risk-on backdrop for large biopharma stocks.
According to historical data from TradeWave.ai, this stretch of the calendar has behaved very differently from an average year for Gilead. The next section walks through how that midterm-year pattern has played out in past cycles and where the current window fits.
How has Gilead Sciences (GILD) traded in this midterm-year window?
Gilead Sciences has risen in every single midterm-election-year window starting around May 10 across the last eight cycles, averaging 25.14% gains over 324 trading days. Shares finished Monday at $131.33, down 2.0% on the day and about 15.6% below their 52-week high of $155.52.[6] That combination of a strong historical season and a stock trading well under its recent peak gives this year’s setup unusual tension.
The presidential election cycle matters here because this pattern is built only from midterm election years, a phase that often brings policy uncertainty, drug-pricing debate and choppy risk appetite before a typically stronger pre-election year. Grouping Gilead’s history this way isolates how the stock has behaved when Washington is in mid-cycle and investors are already looking ahead to the next presidential race.
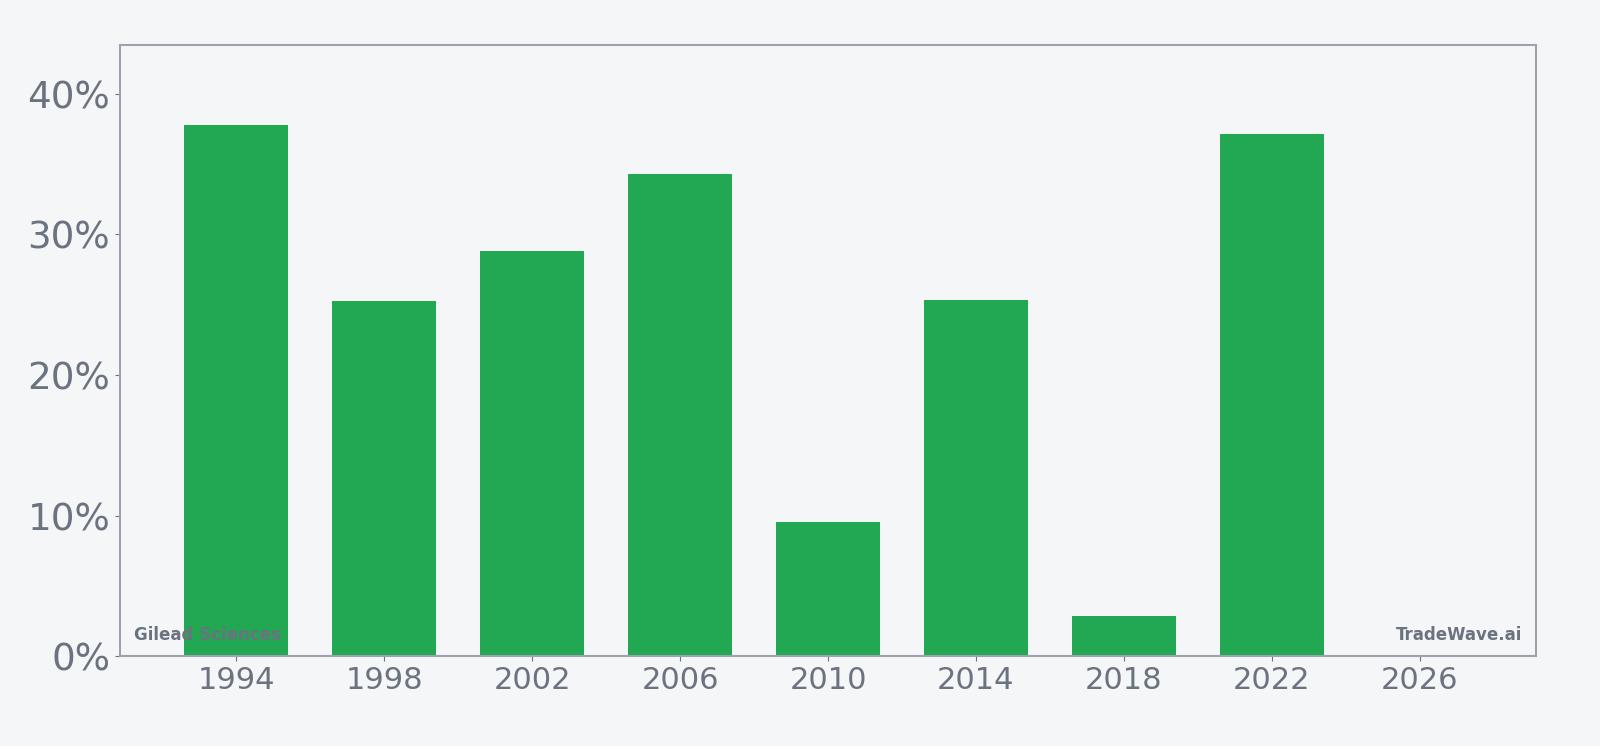
Across those eight midterm-year windows, the trade direction is long and the record is clean: 8 winners, 0 losers, for a Percent Profitable reading of 100%. Average gains of 25.14% mask a wide range of outcomes, from a modest 2.87% advance in 2018 to a 37.81% surge in 1994, but every instance finished in the green. Add it up and the cumulative return across all eight windows is 478%, with an annualized return of 24.54% for this specific slice of the calendar.
The per-year table shows how those gains have clustered. In 2006, Gilead climbed 34.27% during the window, while 2022 delivered a 37.15% advance as the stock rallied from roughly $53.54 to $73.43. Even the softer years have still been positive: 2010 posted a 9.56% gain and 2018’s 2.87% move was the weakest outcome in the sample, yet it still kept the 8-for-8 streak intact.
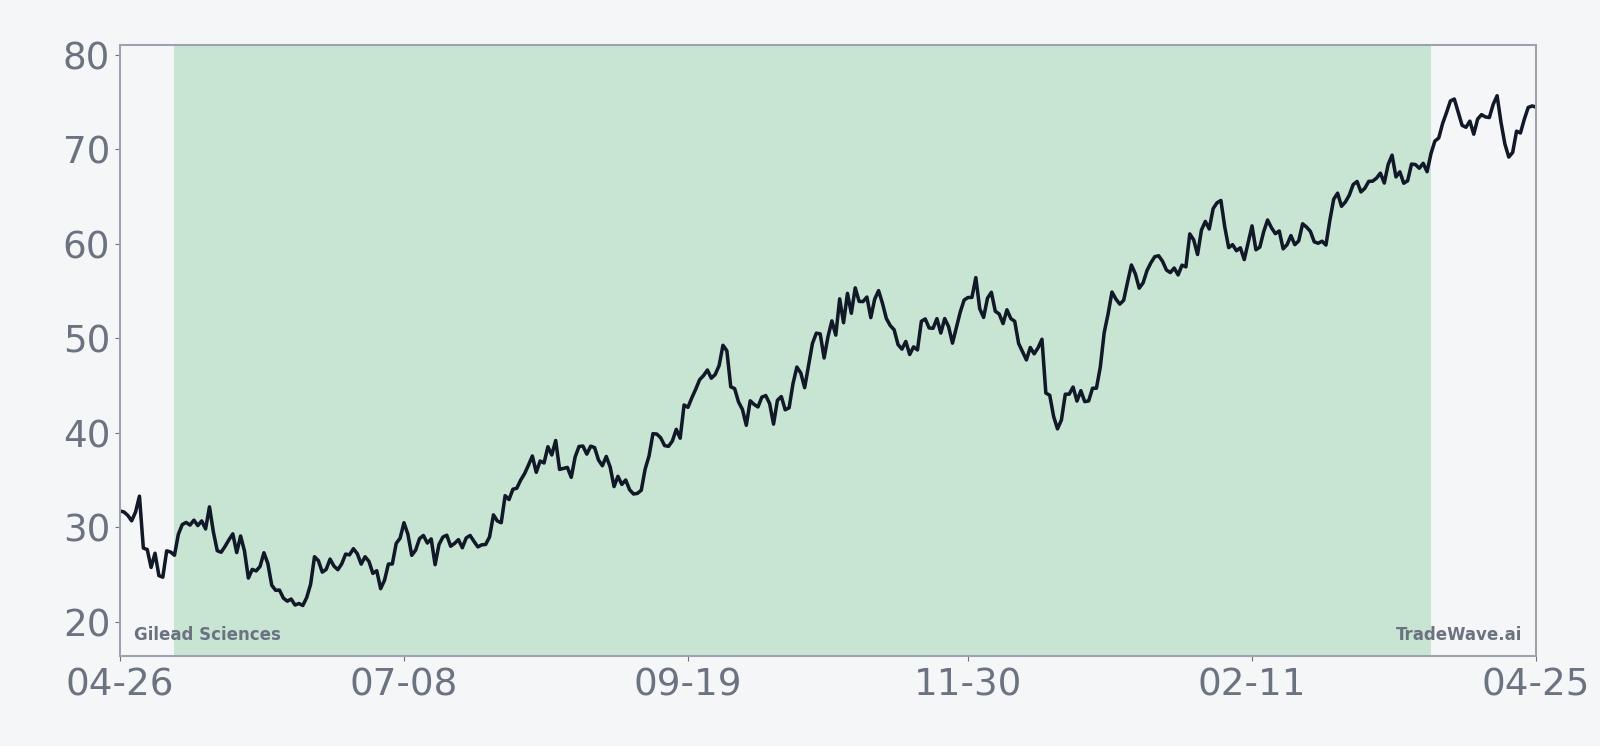
The historical seasonal average suggests that gains have tended to build steadily rather than in a single burst. The curve slopes higher across much of the 324-day span, with some mid-window choppiness but no persistent stretch where the pattern has typically given back all of its early progress. That fits a story where midterm-year volatility eventually gives way to a more constructive pre-election-year backdrop for large-cap biopharma.
A closer look at yearly net returns alongside best and worst intraperiod swings shows how much room GILD has historically had to run and how deep drawdowns have gone inside this window.
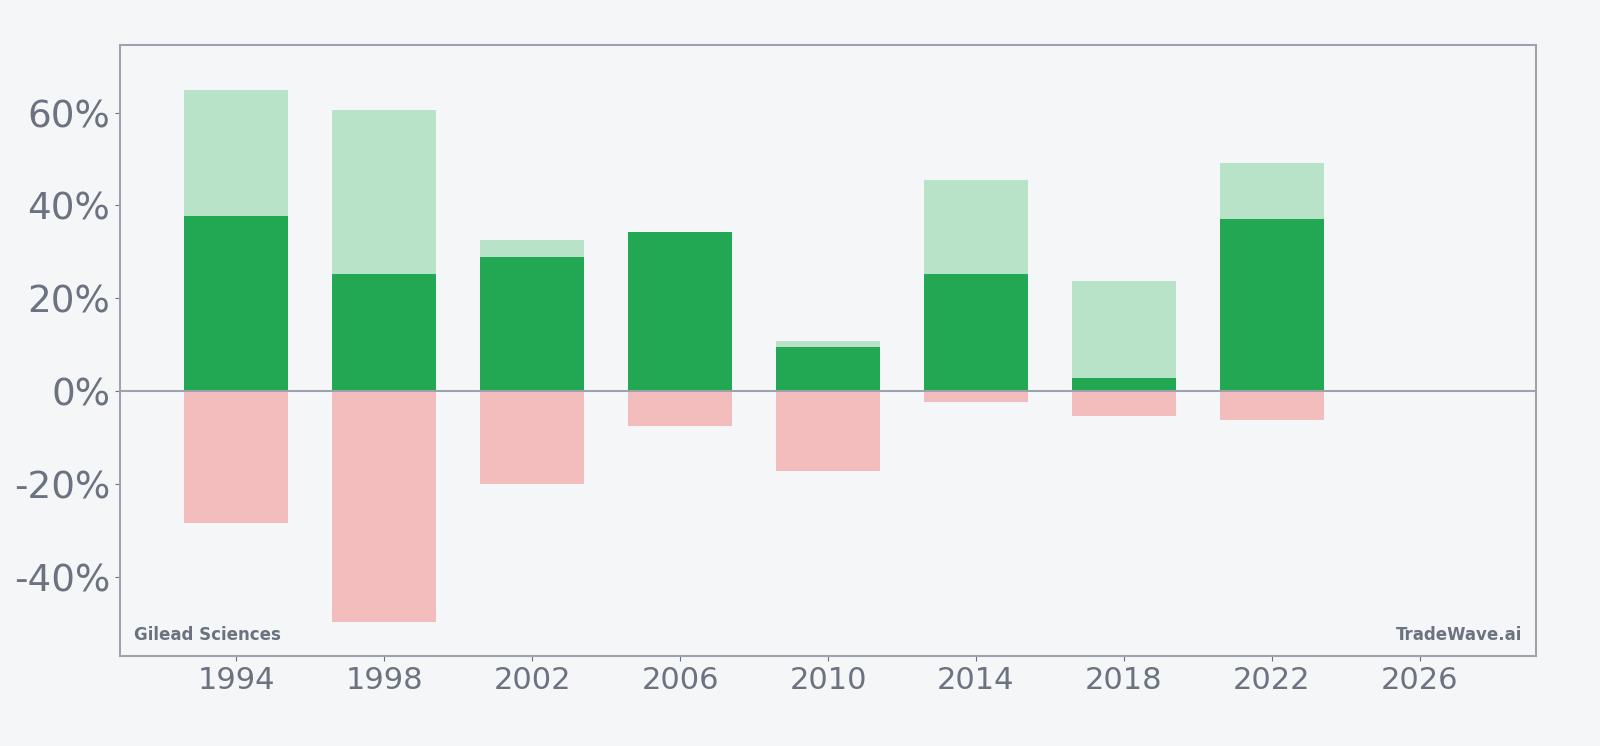
The maximum favorable move and maximum adverse move numbers underline that this has been a high-energy window even when it ends well. In 1998, for example, Gilead’s best intraperiod rally reached 60.57% while the worst drawdown from entry was a sharp 49.73% before the stock still closed the window up 25.3%. Other years show more contained downside, such as 2014, where a 45.4% peak run-up came with only a 2.3% worst drawdown. The TradeWave Ratio of 2.0 captures that tendency for price to travel meaningfully in the long direction within the window, but the MAE readings remind traders that the path has not been smooth.
History does not guarantee future results; even in windows where every past instance has finished higher, adverse excursions can be large and painful before the final outcome.
Why does Gilead Sciences (GILD) follow this seasonal pattern?
One likely driver is the way the presidential election cycle shapes risk appetite for defensive growth names like big biopharma. Analysts often point to midterm-year policy noise around healthcare and drug pricing, followed by a more supportive pre-election-year environment as Washington shifts toward stimulus and away from confrontation. This pattern may also reflect institutional portfolio repositioning around Gilead’s earnings calendar and the timing of clinical and deal news, which tend to cluster in ways that line up with this long May-to-spring trading window.
What is driving Gilead Sciences (GILD) today?
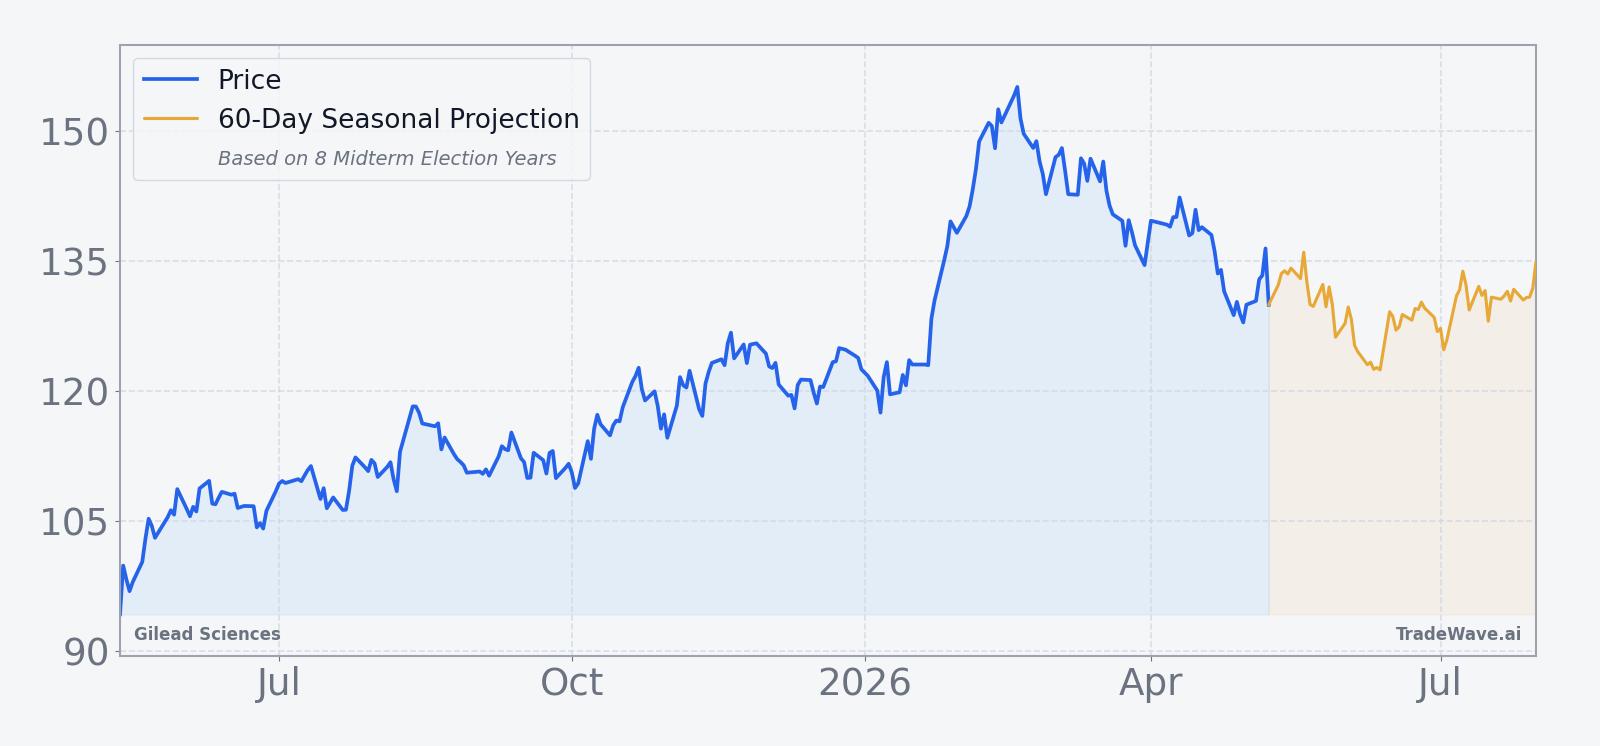
Gilead closed Monday at $131.33, down 2.0% on the session, with the stock sitting below its 50-day moving average of about $138.56 and roughly in the middle of its 52-week range between $90.43 and $155.52.[6] The pullback comes after a busy stretch of deal-making in oncology and immunology, including a planned acquisition of Ouro Medicines to advance T-cell engager therapies for autoimmune diseases and expand its inflammation portfolio,[7] and an agreement to buy clinical-stage biotech Tubulis for up to $5 billion to bolster its antibody-drug conjugate pipeline.[6]
The chart below situates the latest move in its recent multi-month context, alongside a 60-day seasonal projection based on prior midterm-year behavior.
What should traders watch in this Gilead Sciences seasonal window?
The first marker is whether GILD can reclaim its 50-day moving average and start closing the gap toward the 52-week high while the seasonal window is still young. In prior midterm-year cycles, some of the strongest gains have come after periods of consolidation, so how the stock behaves around the $130 to $140 band will be an early tell. A sustained break back toward the mid-$140s would be more in line with the historical pattern, while a failure to hold the low-$130s would represent a clear departure from the typical GILD seasonal trend.
Second, the policy calendar matters. As the midterm year progresses, investors will parse any renewed debate on drug pricing, Medicare negotiations and reimbursement rules, all of which can swing sentiment for large-cap biopharma. Historically, this May-start window has spanned both the noisy middle of the midterm year and the early part of the following pre-election year, when risk appetite has often improved. If Washington rhetoric stays contained and the macro backdrop remains supportive, that would rhyme with prior cycles where Gilead’s stock pattern analysis has skewed positive.
Finally, traders should track how Gilead executes on its recent deal pipeline and whether oncology and autoimmune assets from Tubulis and Ouro Medicines move smoothly through development.[6][7] Strong clinical updates or regulatory milestones during this window would reinforce the historical tendency for the stock to build value across midterm-year stretches, while setbacks or delays could be the kind of adverse shock that tests the pattern’s 8-for-8 record. The key tell will be whether pullbacks stay within the kind of intraperiod drawdowns seen in past cycles or break materially below them.
Sources
- WSJ, "Gilead Sciences to Buy Clinical-Stage Biotech Tubulis for Up to $5 Billion," Apr 7, 2026
- Gilead Sciences, "Gilead Sciences to Acquire Ouro Medicines," Mar 23, 2026
- Reuters, "Gilead posts flat second quarter profit, ups full-year outlook on strong HIV sales," Aug 7, 2025
- MarketWatch, "Gilead shows belief in its partner’s cancer treatment with $7.8 billion buyout," Feb 23, 2026
About this seasonal analysis
Seasonal pattern data is sourced from TradeWave.ai, which analyzes historical price behavior across annual calendar windows going back up to 30 years. Read the full data methodology or the book The 100-Year Pattern by Afshin Moshrefi (2026 edition). Past performance of seasonal patterns does not guarantee future results. This article is for informational purposes only and does not constitute investment advice.