8-for-8: Gen Digital (GEN) Has Dropped Every Midterm May-June Window for Shorts
Gen Digital is heading into a midterm-election seasonal window that has been reliably weak for the stock, even as shares trade well below their 52-week high after a sharp one-day jump.

What is the seasonal pattern for Gen Digital (GEN)?
Gen Digital has fallen in 8 of 8 midterm-year windows starting around May 16, with an average gain of 8.85% in winning years for traders positioned short.
- 8 for 8 in this window, with short trades averaging 8.85% gains in winning years across the last eight midterm election cycles.
- The upcoming 31-day Gen Digital trading window begins May 16 and has historically favored downside for the stock.
- Percent Profitable is 100%, with 8 winners and 0 losers for the short-side seasonal pattern.
- Gen Digital’s seasonal trend in this slice of the calendar lines up with midterm-year policy uncertainty and sector rotation pressures.
- Intraperiod swings have included double-digit favorable moves for shorts alongside notable drawdowns, underscoring the need to respect volatility.
- Add it up: a 94% cumulative return for the short pattern across these eight midterm-year windows.
According to historical data from TradeWave.ai, this midterm-year stretch has behaved very differently from an average month for Gen Digital, and the next iteration is only days away.
How has Gen Digital (GEN) traded in this midterm-year May–June window?
Gen Digital has declined in all eight midterm election years during this 31-day window starting May 16, with short positions averaging 8.85% gains when the pattern worked. Shares last closed at 22.57, up 11.8% on the day and sitting about 28.5% below their 52-week high of 31.66, so the stock is rallying into what has historically been a soft patch for longs.
Grouping the data by the presidential election cycle matters here because this window only looks at the last eight midterm election years, a phase that often brings policy fights, regulatory noise and choppy risk appetite. In other years of the cycle, Gen Digital’s May–June behavior can look very different, so this pattern is specifically about how the stock has traded when Washington is in the midterm year of a presidential term.
Historically, this seasonal window begins on May 16 and spans 31 days, and it has been a consistently bearish stretch for Gen Digital when viewed from the short side. Percent Profitable sits at 100%, with 8 winners and 0 losers for traders who were short during this midterm-year slice, and the cumulative return across those trades is 94%. The average winning outcome of 8.85% means that in a typical successful year, the stock finished the window almost nine percent lower than where it started.
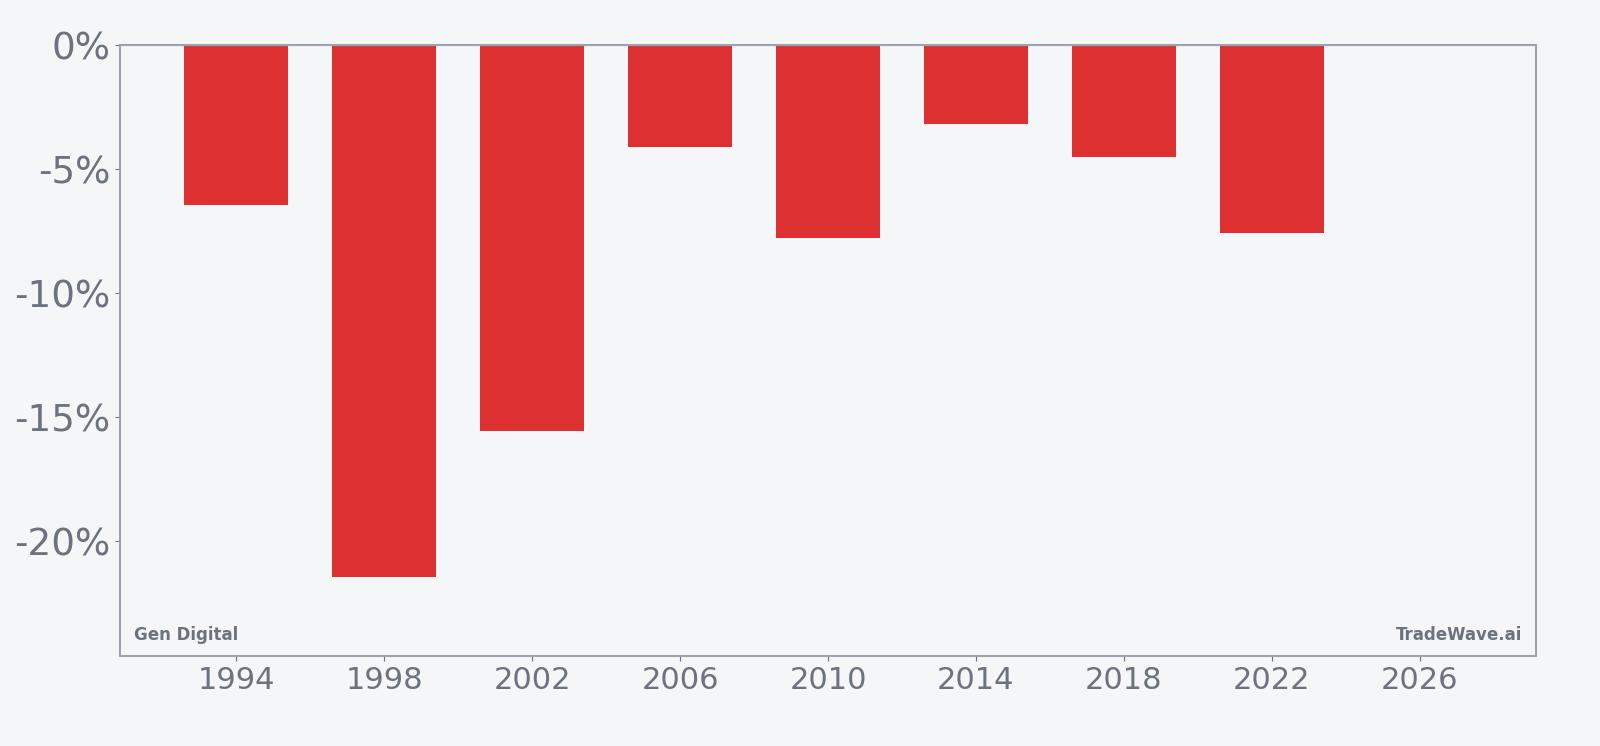
The per-year table shows that 1998 was the strongest year for the pattern, with a net return of -21.46% for the stock and a maximum favorable move of 12.02% in the direction of the short. At the other end of the spectrum, 2014 was the mildest outcome, with Gen Digital slipping 3.2% over the window and a relatively contained worst drawdown of -5.47% from the entry. Even in that quieter year, the short still finished ahead.
The MFE and MAE profile across these eight windows points to meaningful volatility inside the pattern. Maximum favorable moves for shorts have reached into double digits, such as 10.2% in 1994 and 12.02% in 1998, while maximum adverse moves have also been sizable, including -23.6% in 1998 and -23.58% in 2002. In plain English, the stock has often swung hard in both directions during this period, even though the final result has always favored the short side in this sample.
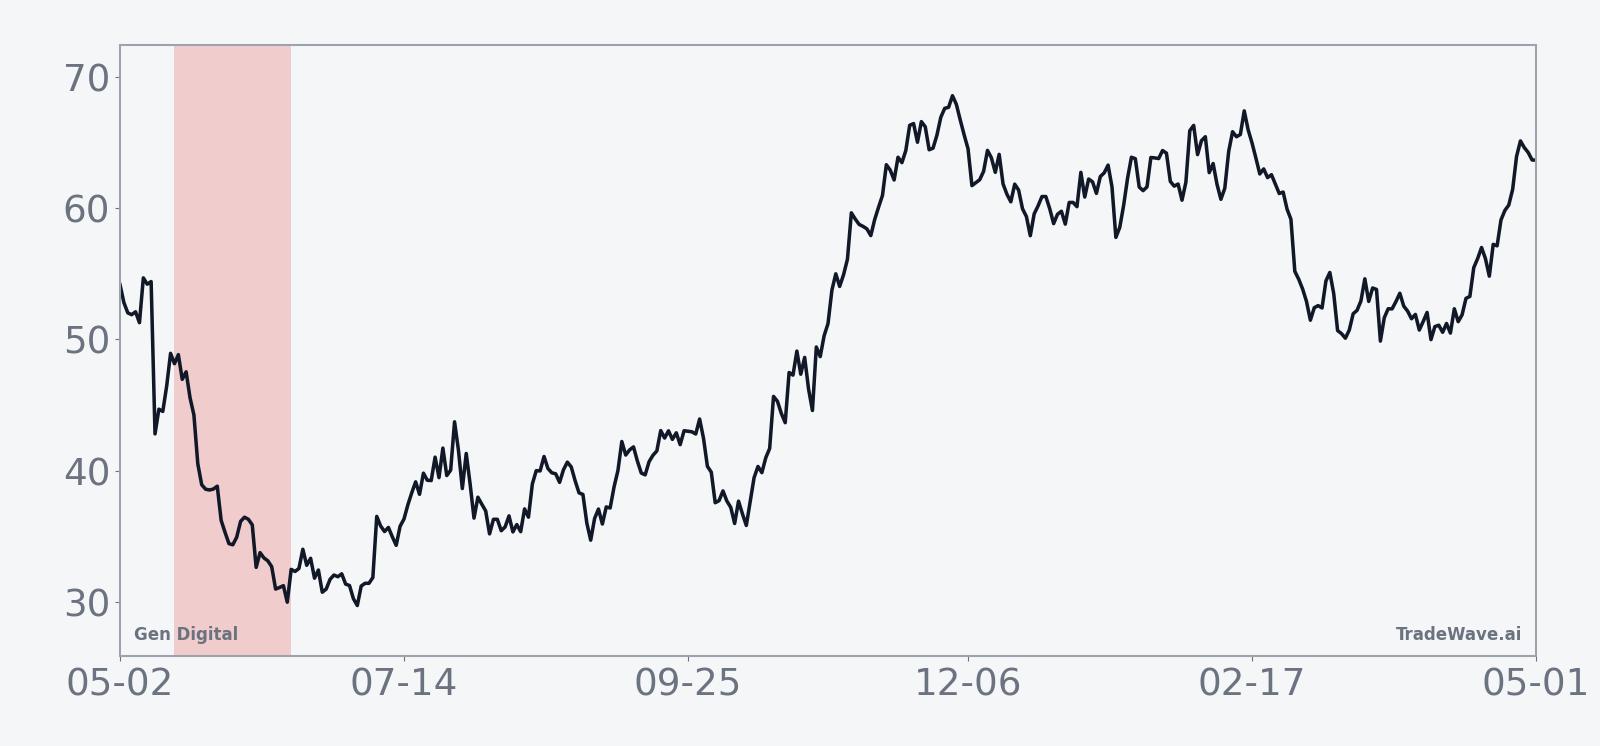
The historical seasonal trend chart for this window shows that weakness has tended to build gradually rather than in a single air pocket. On average, Gen Digital has drifted lower across the 31 days, with the bulk of the downside accruing in the middle of the window rather than right at the start or the final few sessions. That pattern suggests that rallies early in the window have often faded rather than turning into sustained squeezes.
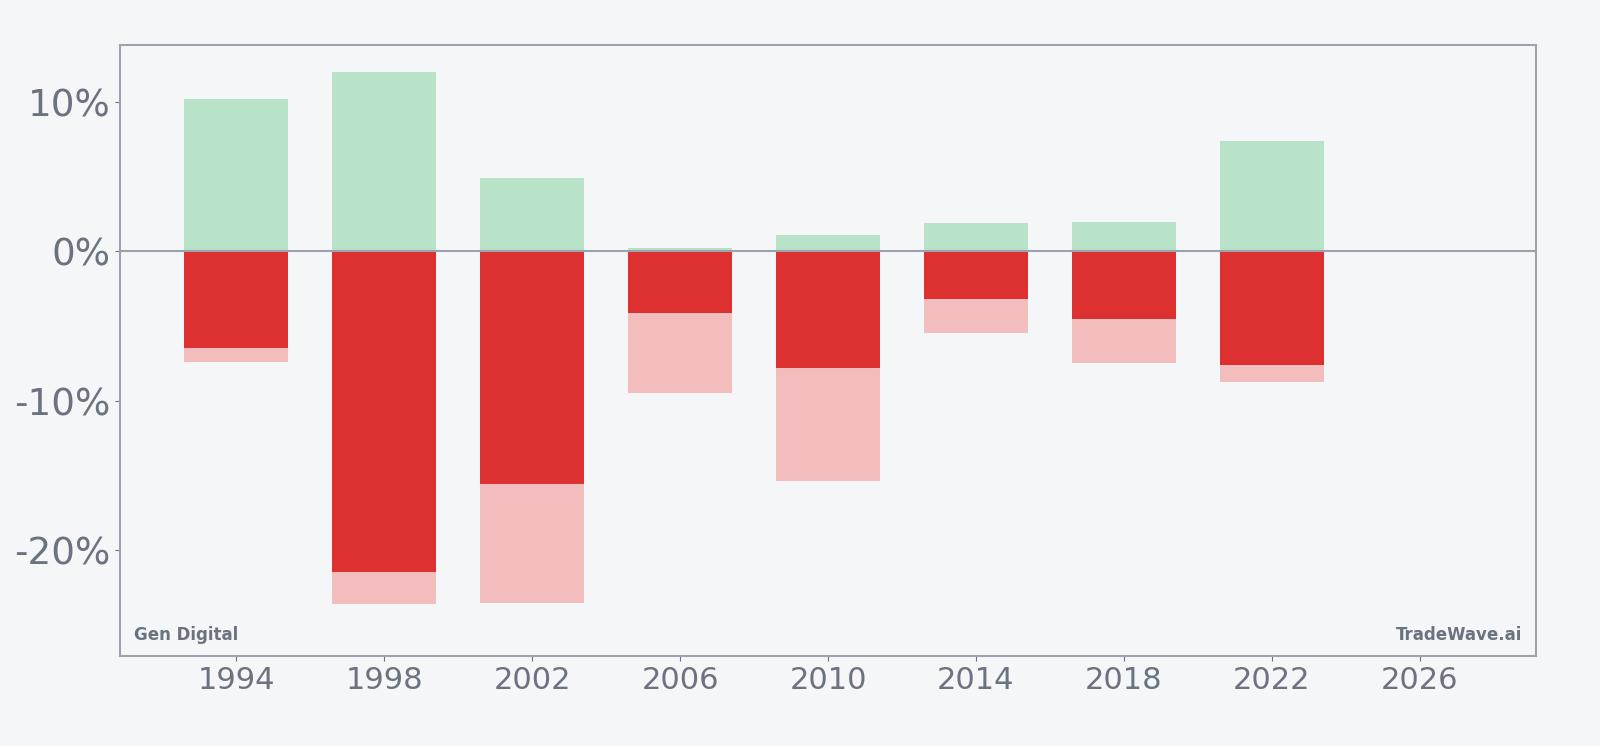
A stacked view of net returns with peak run-ups and worst drawdowns shows how far Gen Digital has tended to travel inside the window.
Put together, the pattern is clear: in the last eight midterm election years, this specific May–June window has favored shorts every time, with meaningful but manageable drawdowns along the way.
Why does Gen Digital (GEN) follow this seasonal pattern?
One likely driver is the way midterm election years cluster regulatory headlines and budget debates that can weigh on cybersecurity and consumer-software names. Analysts often point to institutional portfolio repositioning around midyear, as managers rebalance tech exposure after first-quarter earnings and ahead of the summer lull. This pattern may also reflect options positioning and volatility selling that leaves stocks like Gen Digital vulnerable to pullbacks when macro or policy headlines hit during this part of the calendar.
History does not guarantee future results, and even in a window with a perfect track record for shorts, adverse moves within the period have at times been large.
What is driving Gen Digital (GEN) today?
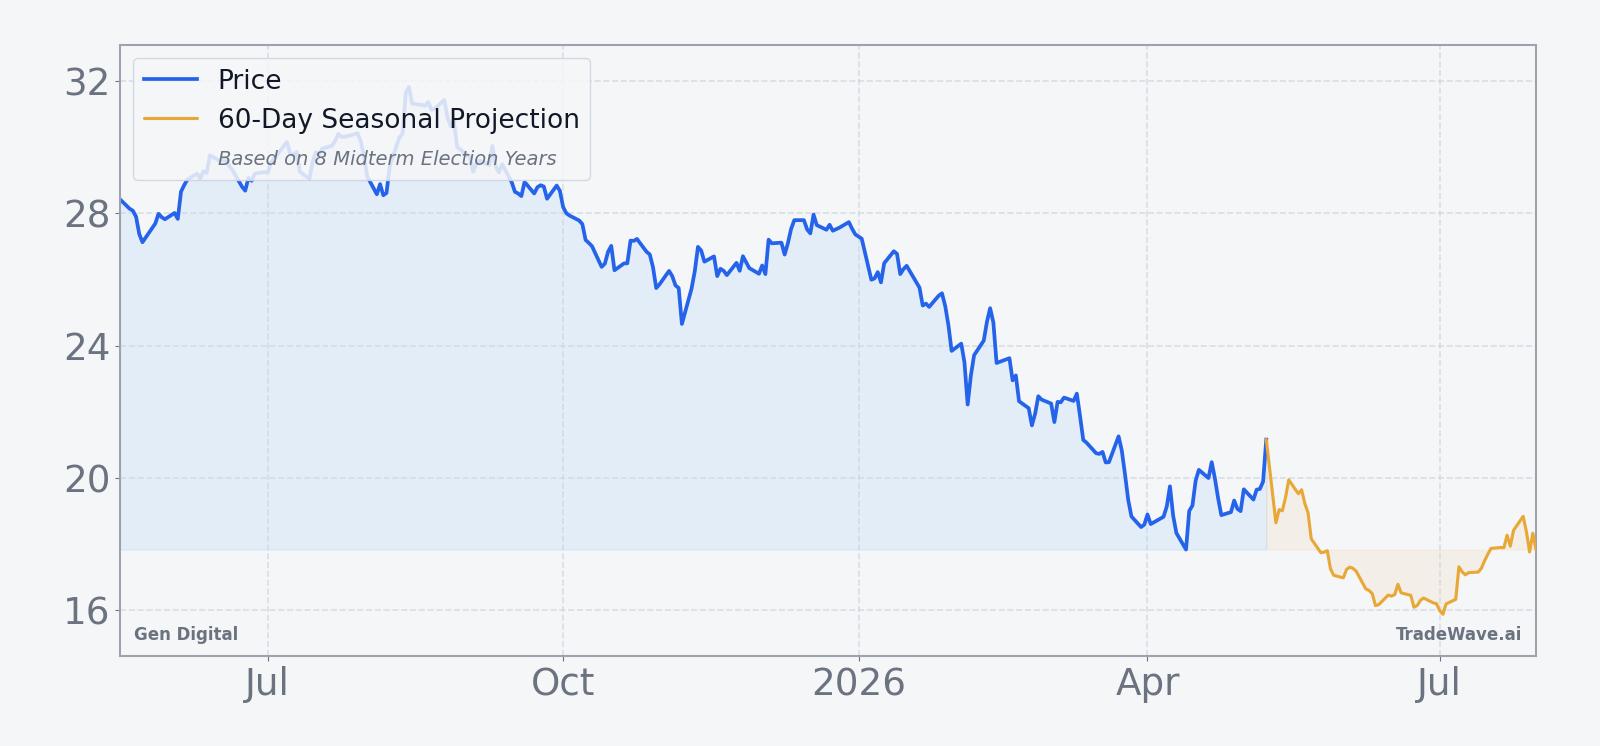
Gen Digital closed at 22.57 on May 11, up 11.8% on the day, extending a one-month gain of 26.77% and leaving the stock about 28.5% below its 52-week high of 31.66 while still well above its 52-week low of 17.78.[1] That mix of a sharp short-term rebound and a longer-term drawdown sets the stage for the upcoming seasonal window, with traders weighing whether the recent strength is a catch-up move or the start of a more durable trend.
The chart below situates the latest move in its recent multi-month context alongside a 60-day seasonal projection.
With no near-term earnings date or major company-specific catalyst flagged in the current data, the focus for many traders is shifting toward the broader tech-sector backdrop and the policy calendar as the United States moves deeper into the midterm election year.[1] Against that macro and political backdrop, the GEN seasonal trend in this May–June window offers a distinct historical lens on how the stock has behaved when Washington headlines and portfolio rebalancing have collided in prior cycles.
What should traders watch as this Gen Digital seasonal window opens?
First, the calendar: the 31-day window begins on May 16, so price action in the days just before and after that date will show whether this cycle starts with a relief rally or an early fade. Second, levels: traders will be watching how Gen Digital behaves around the low-20s zone that has been a recent launchpad, and whether any push toward the mid-20s stalls as it has in past rebounds.[1]
Third, volatility: the historical MFE and MAE profile suggests that even in winning years for shorts, the stock has often staged sharp countertrend moves inside the window. Monitoring intraday ranges and volume as the pattern unfolds can help gauge whether this year is tracking closer to the big-swing years like 1998 and 2002 or the more muted 2014 setup. Finally, the macro and policy tape matters: if midterm-year regulatory or budget headlines start to bite across software and cybersecurity, a renewed risk-off tone would line up with the established GEN seasonal trend, while a calm policy backdrop and continued tech bid would be a clear break from the historical script.
Sources
About this seasonal analysis
Seasonal pattern data is sourced from TradeWave.ai, which analyzes historical price behavior across annual calendar windows going back up to 30 years. Read the full data methodology or the book The 100-Year Pattern by Afshin Moshrefi (2026 edition). Past performance of seasonal patterns does not guarantee future results. This article is for informational purposes only and does not constitute investment advice.